141 Figure 5.7 Scatter plot with regression lines visualizing the relationship between watershed land use (agricultural plus developed) and log (x+1) transformed water quality variables with 95% confidence intervals for each lake. 151 Figure 5.12 Biplot from redundancy analysis of the zooplankton communities in Balsam, Cameron, Sturgeon and Pigeon Lakes.
The Kawartha Lakes
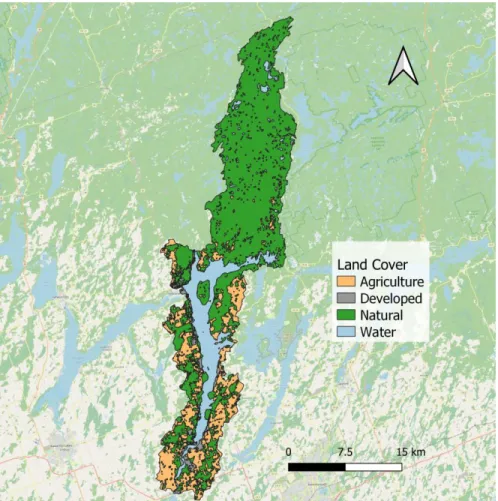
- Lake Scugog
- Balsam Lake
- Cameron Lake
- Sturgeon Lake
- Pigeon Lake
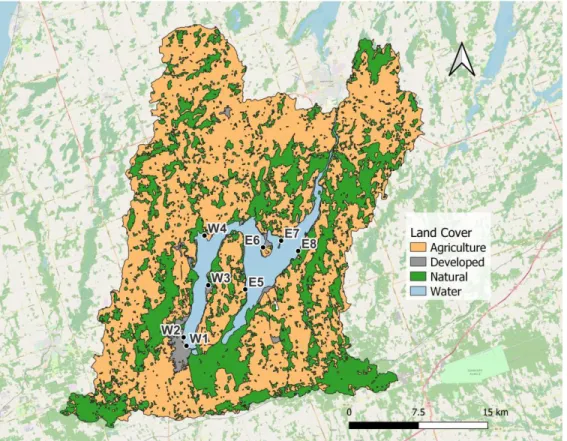
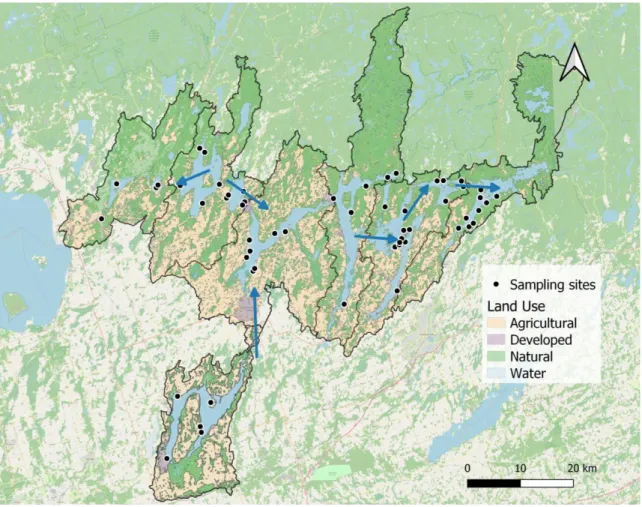
Most of the development in the basin is located in the city of Port Perry on the southwest shore of the lake. Sturgeon Lake lies in the middle of the studied lakes that connect Cameron, Scugog and Pigeon lakes.

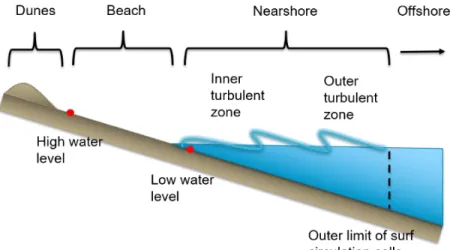
The Nearshore Zone
In freshwater systems, phytoplankton respond to increased phosphorus with increased biomass and often a change in phytoplankton type (Downing et al., 2001). Macroinvertebrates are directly affected by shoreline hardening, resulting in reduced richness and altered community composition (Porst et al., 2019).
Community Science
Many projects showed that participants gain scientific knowledge, especially within the topic of the community science project (Bonney et al., 2016). One finding that complicates this is that many community science participants are self-selected and already have positive attitudes toward science (Brossard et al., 2005).
Bioindicators
For example, if there are excessive amounts of phosphorus, cyanobacteria will dominate the water column (Downing et al., 2001). Zooplankton are also useful bioindicators of water quality and eutrophication because they are influenced by abiotic and biotic factors (Parmar et al., 2016).
Research Goals and Objectives
When water quality is less degraded (low nutrient, high oxygen), more sensitive taxa such as Ephemeroptera, Plecoptera and Trichoptera are expected to increase in abundance compared to more degraded environments (Lenat & Barbour, 1993). Examination of the macroinvertebrate community in the Kawartha Lakes will provide region-specific relationships with water quality and provide baseline metrics for future comparison.
Spatial scale and seasonal dependence of land use influence river water quality in the Huai River basin, China. Community science-based monitoring reveals the role of land use scale in driving coastal water quality in Lake Scugog.
Introduction
Despite the known importance of the coastal zone, it is rarely regularly monitored for water quality (Vadeboncoeur et al., 2011). Water quality monitoring programs have increasingly been expanded to include community science initiatives, where local volunteers collect water samples and record field observations (Jollymore et al., 2017; Poisson et al., 2020).
Methods
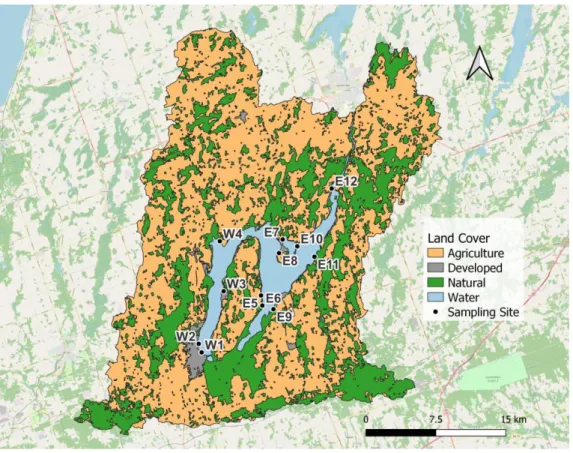
- Study Site
- Volunteer Recruitment and Training
- Water Sample Processing
- Land Use Classification
- Statistical Analysis
Each partner had a separate but important role in the implementation and execution of the water quality monitoring program, from study design to dissemination of results. None of the values dropped from the IQR were found to be due to sampling or processing error and were thus retained for later analysis.
Results
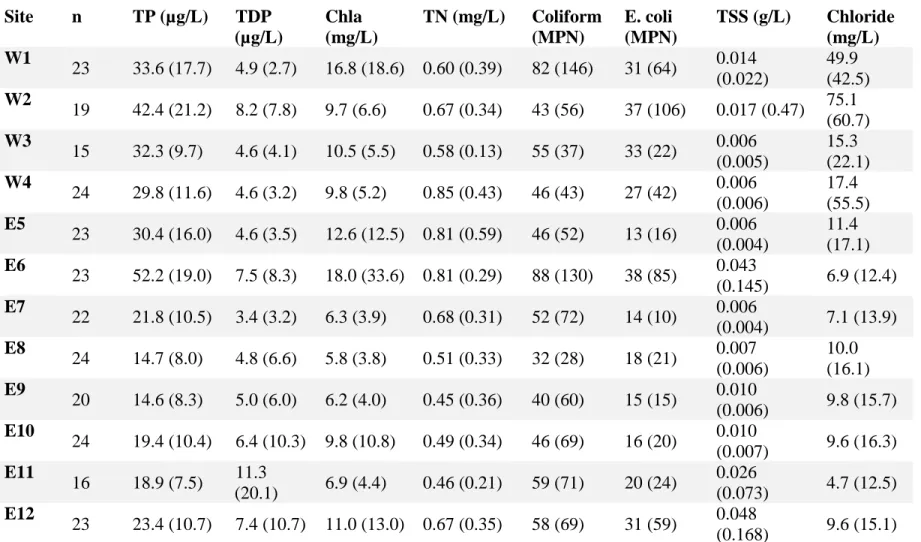
Water Quality
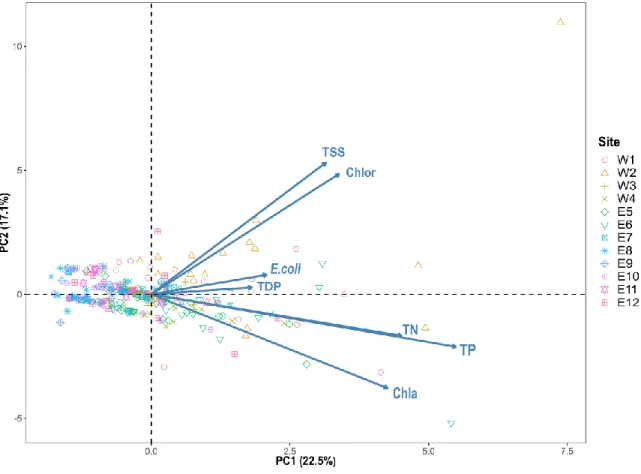
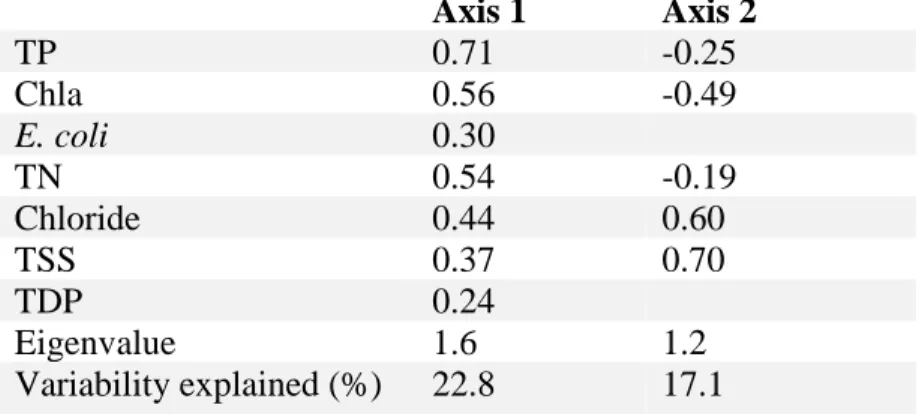
A principal component analysis (PCA) was conducted to reduce dimensionality to better examine drivers of nearshore water quality. Escherichia coli and faecal coliforms were the only water quality variables with significant differences between years.
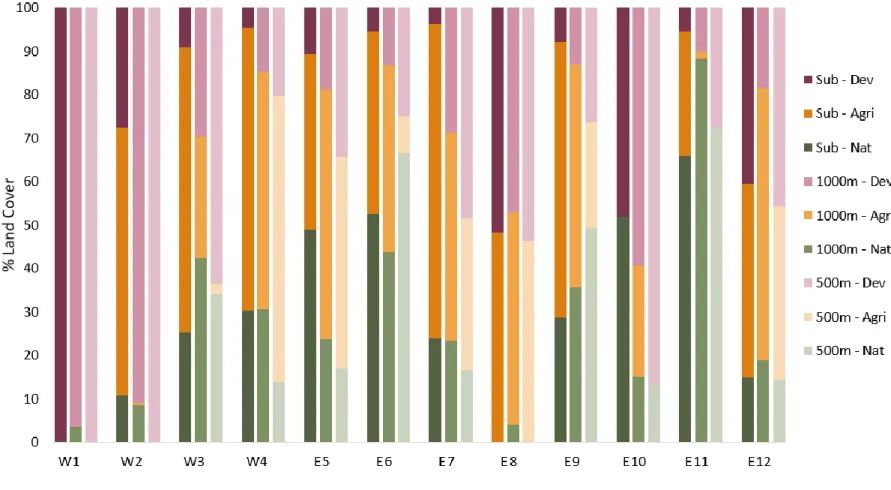
Land Use
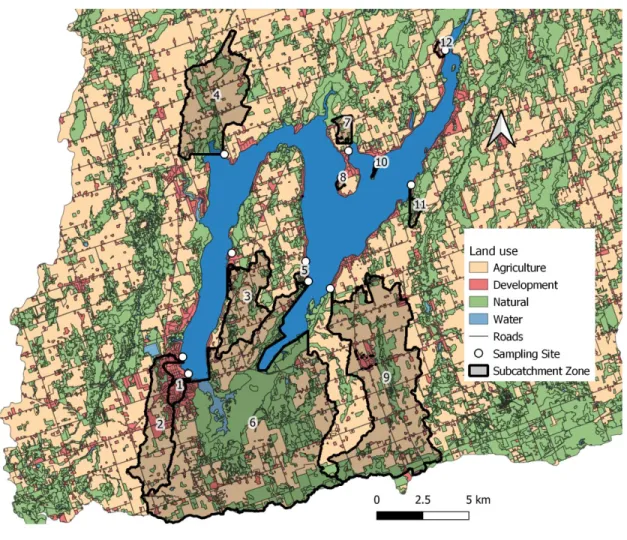
This pattern continues for the 500 m buffer, where all sites had an increase in the proportion of developed land use. Proportionally, the development is the highest and accounts for 100% of the land use in the sub-catchment scale, but in terms of area it is lower than three other locations (W2, E6 and E9).
Landscape – Water Quality Linkages
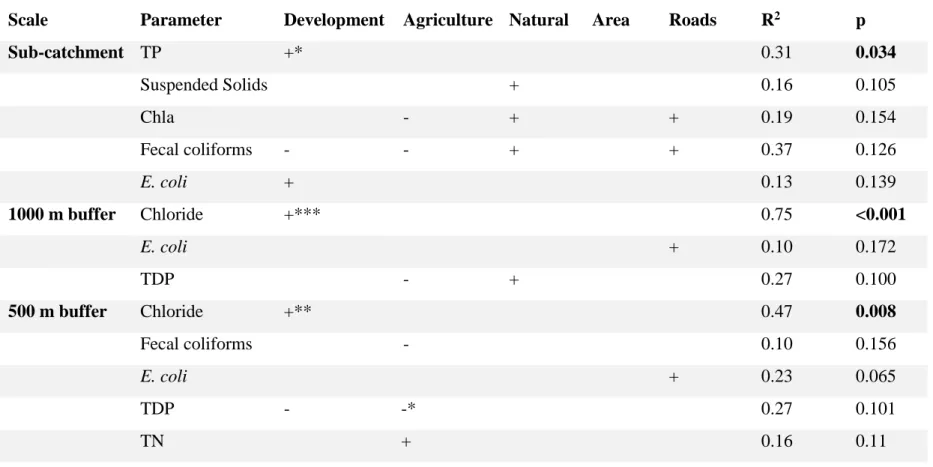
TP, suspended solids and Chla, had significant predictors of land use at the sub-catchment scale. In contrast, all land use variables were statistically significant in at least one of the predictive models, and development was included in most models (6/13).
Discussion
- Water Quality
- Land Use Patterns
- Water Quality – Land Use Relationships
- Management Implications
The regression models provide insight into the importance of each land use scale in influencing each individual water quality parameter. Notably, given the large proportion of agricultural land use at the sub-catchment scale for most sites, agriculture was not an explanatory variable for water quality in this study.
Effects of land cover, topography, and built structure on seasonal water quality at multiple spatial scales. Buffer zone in relation to the whole catchment approaches to the study of the impact of land use on river water quality.
Introduction
Since the nearshore zone plays an important role in the lake's food web, evaluating its composition and structure can provide important insights into the biological condition of a lake (Niemi et al., 2007). However, diversity was expected to decline with development due to the elimination of sensitive taxa from pollution (Morse et al., 2003).
Methods
- Study Site
- Sample Collection
- Sample Processing
- Statistical Analysis
By standardizing the collection technique, macrophyte abundance at each site could be estimated in the laboratory (Carr et al., 2003). Redundancy analyzes (RDA) were performed for each community using the R package vegan (Oksanen et al., 2013).
Results
Water quality and submerged macrophytes
Phytoplankton, zooplankton, and macroinvertebrate communities
Comparing the two models, I found that water quality variables explained about 92% of the variation in phytoplankton and macrophyte taxa abundance. In addition, the results of the GLLVMs indicate that water quality had an influence on zooplankton and macrophyte community interactions.

Discussion
It was expected that low macrophyte sites would increase nutrients due to lower nutrient uptake by aquatic plants (Levi et al., 2015). Macrophytes were expected to play an important role in shaping the zooplankton community, as other studies have found reduced zooplankton abundance and shifts in community composition in response to the removal of submerged macrophytes (Sagrario et al., 2009; Schriver et al. ., 1995) ).
Shifts in aquatic macrophyte abundance and community composition in cottage-developed lakes of the Canadian Shield. Impervious surface as a predictor of the effects of urbanization on stream insect communities in Maine, USA.
Introduction
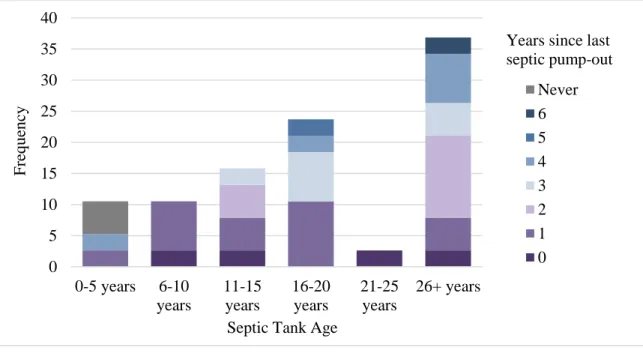
Community Science to the Rescue: Capturing water quality data in Kawartha Lakes during the COVID-19 pandemic. Excessive septic leakage could lead to elevated nutrient levels in nearby surface waters (Reay 2004; Oldfield et al. 2020).
Methods
- Study Site
- Community Science Model
- Water Sample Collection
- Volunteer Survey Deployment
- Water Sample Processing
- Statistical Analysis
This study provided a unique opportunity to test whether there is a detectable "anthropopause" effect, hypothesizing that increased human activity in the Kawartha Lakes during the pandemic resulted in increased nutrient loading in the studied lakes. The water samples collected in 2020 were immediately frozen by a local scientist and the frozen samples were returned to the laboratory in September.
Results
Community Science Survey
Permutational analysis of variance (PERMANOVA) was performed with vegan (Oksanen et al., 2013) based on Bray-Curtis dissimilarity to determine whether differences between watersheds were significant. Welch's t-test was performed on the survey data to determine if there were significant differences between the habits of property owners in 2019 and 2020.
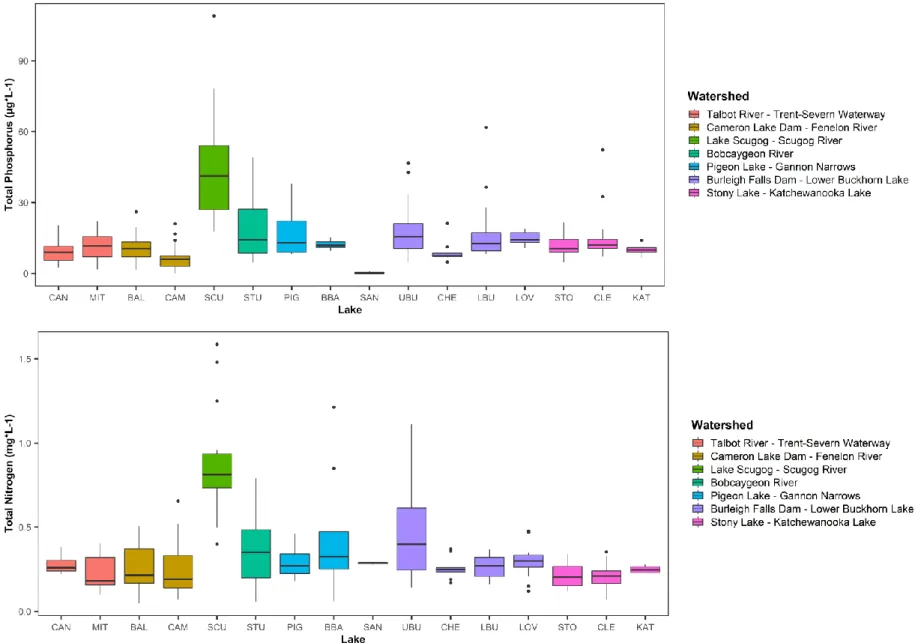
Kawartha Lakes Water Quality
Sub-watershed development was the only predictor selected and was significant for predicting total nitrogen, chlorophyll-a and total phosphorus (p < 0.05). The strongest relationship was between total nitrogen and development (R2 = 0.18), followed by chlorophyll a and development (R2 = 0.14), and total phosphorus and development (R2 = 0.08).
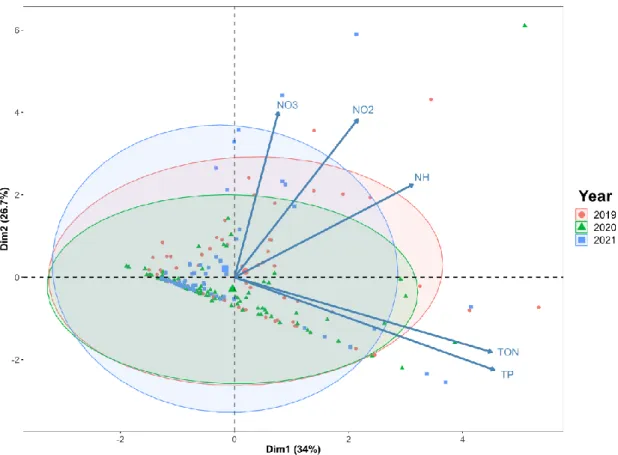
Annual Trends
The direction and length of the arrow indicate the relationship to the axes and the strength of the driver for each water quality variable. Precipitation and water temperature data were compared across years to examine potential climatic influences on water quality.
Discussion
Developed land use in the subbasin had a positive, significant relationship with total nitrogen, total phosphorus, and chlorophyll. There was no clear relationship between precipitation and total phosphorus content in the surveyed lakes in 2020 (Figure 4.8).
The impact of the COVID-19 lockdown period on surface water quality in the Meriç-Ergene river basin, Northwest Turkey. Evaluating the role of land use type and scale in nearshore water quality and biological community structure in the Kawartha Lakes (Balsam, Cameron, Sturgeon, and Pigeon).
Introduction
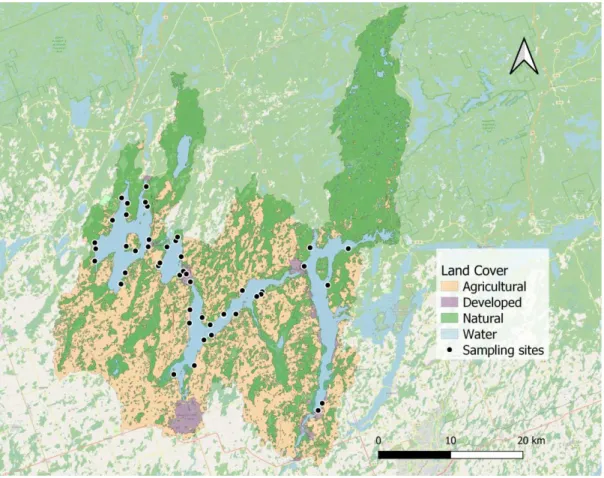
Spatial variation in the nearshore area is likely to provide an accurate reflection of large- and small-scale land use. Large and small scale land use was expected to be associated with nearshore water quality.
Methods
Sample collection and processing
It was also predicted that the associated effects of land use on water quality would have direct and/or indirect effects on nearshore biological communities. Findings from volunteer-collected samples are presented in the "Water Quality and Land Use" results section.
Statistical Analysis
Taxonomic diversity was calculated using Simpson's Index of Diversity using the vegan R package (Oksanen et al., 2013). Multiple linear regressions were performed with abundance and richness for each community, calculated with the vegan (Oksanen et al., 2013) package, and environmental variables.
Results
Water quality and land use
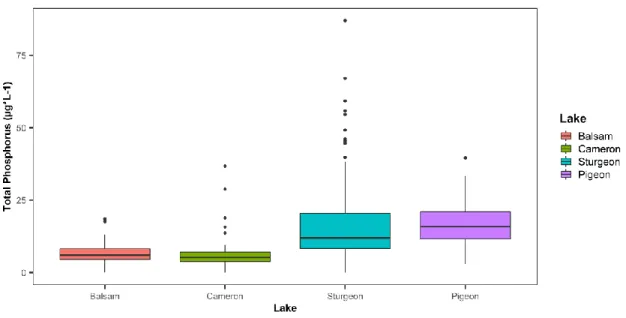
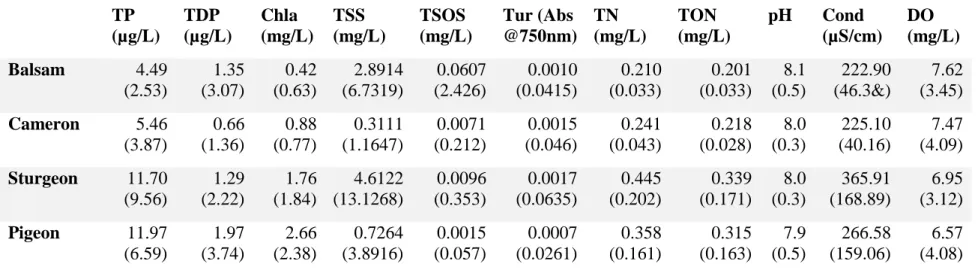
Agricultural and developed land use was associated with many water quality parameters, driving negative scores on axis 1. Only Sturgeon and Pigeon Lakes had a positive, significant relationship with watershed land use and total phosphorus (Figure 5.7, p < 0.05).
Biomonitoring findings
Rip-rap shorelines had significantly lower total phosphorus compared to armor rock and natural shorelines (Figure 5.10, p < 0.05). Total phosphorus in Balsam and Cameron lakes was significantly lower than in Sturgeon and Pigeon lakes (p < 0.05).
Discussion
Water quality and land use patterns
In sturgeon and pigeon, urban and agricultural land use is more concentrated in the southern part of their watersheds, which may strengthen the relationship between land use and nutrients (Uuemaa et al., 2005). No significant associations were found between water quality variables and land use at the 100 m buffer scale.
Biotic communities
In addition, the invasive Dreissena polymorpha has been shown to alter the TP – Chla relationship (Higgins et al., 2011), but I identified D. The positive relationships between total phosphorus and chlorophyll a and macroinvertebrate abundance are consistent with previous findings that macroinvertebrate abundance increases with nutrient enrichment (Blumenshine et al., 1997).
Effects of land cover, topography and soils on stream water quality at multiple spatial and seasonal scales in German. The COVID-19 pandemic has not significantly affected coastal water quality in the Kawartha Lakes.
Building a community science water quality monitoring program
Previous work has identified the role of community science in creating spatially and temporally explicit datasets that can be used to answer a range of research questions, and this has been particularly valuable in the United States, where more than half of the observations for general water quality parameters came from community scientists (Poisson et al., 2020). My work provided another example of the role that community science can play in producing a large, high quality data set using a unique co-production.
Determining the influence of land use on nearshore water quality
These findings suggest that nearshore water quality is not only influenced by local activities and shoreline conditions, but that different water quality parameters are determined by different scales of land use activity. Previous work has shown that the relationships between land use and water quality are region specific (Read et al., 2015), but I found that even within the same region, the coastal zone of lakes had different relationships with different scales of watershed land use.
Water quality trends during the COVID-19 pandemic
Although we could not examine soil transport capacity with this study, we found patterns that indicated the role of hydrologic connectivity in determining water quality in these lakes. More importantly, my results also showed that urban development had a disproportionate impact on water quality compared to agriculture, where only a small percentage of urban development resulted in significant increases in e.g. phosphorus and chloride.
Land use and shoreline modifications impact nearshore biotic
Study limitations and future directions
Final thoughts