Lake Superior's surface water temperature, water level, and ice cover are believed to be changing due to higher atmospheric temperatures caused by climate change. However, it was found that surface water temperatures, ice cover and atmospheric temperatures showed similar patterns.
OBJECTIVES
HYPOTHESIS
LITERATURE REVIEW
CHARACTERISTIC REVIEW OF LAKE SUPERIOR
The warm coastal upwelling areas will be just outside the ice-covered areas in January. If the topography of the lake bottom is rough, the movement of the isothermal rod will be slow (Irbe.
SURFACE WATER TEMPERATURE
The persistent surface water temperature gradient and the slow vertical heat transfer in the deep water areas prevent this from happening (Irbe 1992:32). However, multiple studies have shown that all of the Great Lakes' surface water has increased within the last few decades (Anderson et al 2021, Austin and Colman 2007). Small surface water temperature variations were noted during mixing such as late November to December and during the spring (Irbe 1992:172).
Atmospheric temperatures affected summer surface water warming, but not as much as ice cover. Summer water temperature gradients were predicted to begin to decline due to reduced seasonal variation resulting from increased surface water temperatures (Austin and Colman 2007). The model demonstrated that surface water increased by 0.107°C each year (variance of 0.08 and probability 0.27).
ICE COVER
Spring warming was shown to have the weakest annual increase in water temperature (Austin and Colman 2008). Ice cover decline is projected to warm the annual water temperature of Lake Superior by (6.3± 4.2)x10-2°C (Austin and Colman 2007). Thus, the long-term change in the thermal regime of Lake Superior is greatly influenced by the onset of summer stratification and thus the melting of the ice.
At this rate, it has been projected that Lake Superior will be ice-free by 2036, further increasing summer water temperatures (Austin and Colman 2007), because unlike ice-covered lakes, open water lakes will not reflect as much radiation and instead reflect most of it (Irbe 1992: 8). In 1998, an outlier caused a warmer than trend summer water temperature and reduced ice due to the El Nino event (Austin and Colman 2007, Piccolroaz et al 2015). This demonstrated that the percentage of ice cover is determined by atmospheric conditions, which in this case created a mild winter, minimal ice cover, then a warmer than usual summer season (Austin and Colman 2007, . Piccolroaz et al 2015).
ATMOSPHERE TEMPERATURES
The disproportionality seen between surface water temperature and overlying water air temperature is likely due to increased summer warming from reduced ice cover ( Austin and Colman 2007 ). Water temperatures responded to atmospheric warming trends but were not easily predictable due to geographic differences (Hansen et al 1999 from Austin and Colman 2008). Piccolroaz et al (2015) found that the atmospheric temperature increases by 0.098°C per year for the summer months.
Atmospheric temperature data from STDM4 was used, which is 35m above Lake Superior located on a lighthouse (Piccolroaz et al 2015). Their air2 model showed unusual surface water heating based on air temperature, which would increase spring overturning and incipient summer stratification. In 1998, there were unusually high air temperatures and warm surface water temperatures due to an El Nino event (Piccolroaz et al 2015).
WATER LEVELS
However, the large lakes also have fluctuating water levels due to general climatic conditions. However, studies have claimed that Lake Superior has since rebounded from these low water levels (Lean Times for Lake Superior 2007). Still other studies such as Lofgen (2002) have shown an increase in the water level due to increased rainfall.
In their dynamic linear regression model with NOAA data, Lamon and Stow (2010) found an overall decrease in mean water levels since the 1970s. It has been shown that the water levels have decreased by about 1 cm per year in the last 35 years. Lenters (2004) showed with a linear regression that the seasonal changes in water levels decreased by 20% between years.
LITERATURE REVIEW SOURCES
LAKE SUPERIOR DATA
The monthly water level data were also downloaded from the NOAA website (NOAA GLERL n.d.a) and were collected from representative lake-wide water level gauges from the United States. NOAA collects this data to support environmental science, decision-making and research to provide information to a variety of interested stakeholders (NOAA CWGL n.d.b) The atmospheric temperature was downloaded from the Thunder Bay Airport Meteorological Station, named "Thunder Bay A" from the Government of Canada website (GC 2023). The available data for Lake Superior goes back to 1995 for water temperature, 1918 for water levels, and 1773 for ice cover.
Atmospheric data from 1966-1988 was also collected for the Canadian government website to be atmospheric data. Also, some observations from other older data sets were made for comparison with older studies.
DATA ANALYSIS
All results were used to determine whether the hypothesis was true and to discuss further research needs.
RESULTS
SURFACE WATER TEMPERATURE
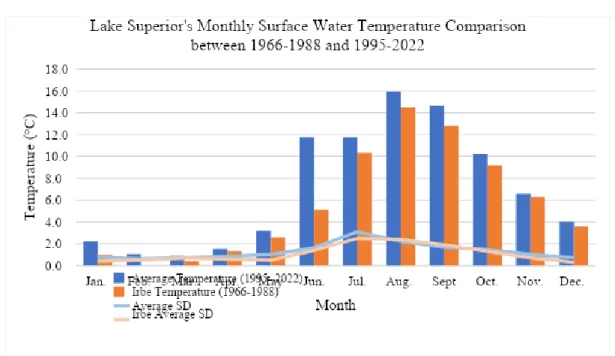
Data points that exceeded the standard deviation thresholds are labeled above the temperatures in Figure 1. The mean value is shown as a black line in Figure 2, and the standard deviation limits are shown as gray lines. For comparison with the data presented by Irbe, the mean temperatures for each month were shown along with their corresponding standard deviations.

ICE COVERAGE
ATMOSPHERE TEMPERATURE
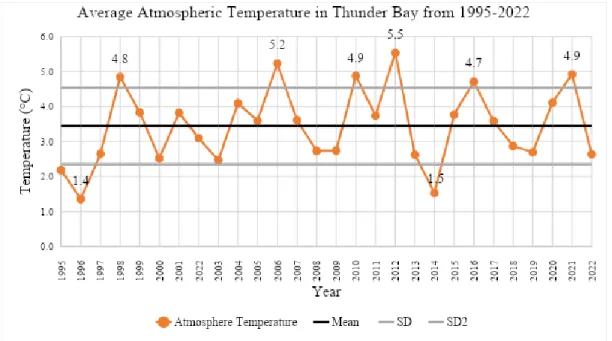
The mean is shown by the black line and the standard deviations are shown by the gray lines in Figure 5. The highest atmospheric temperature in 2012 (5.5°C) is shown as a red data point and the lowest atmospheric temperature in 1996 (1.4°C) C) is shown as a blue data point.
WATER LEVELS
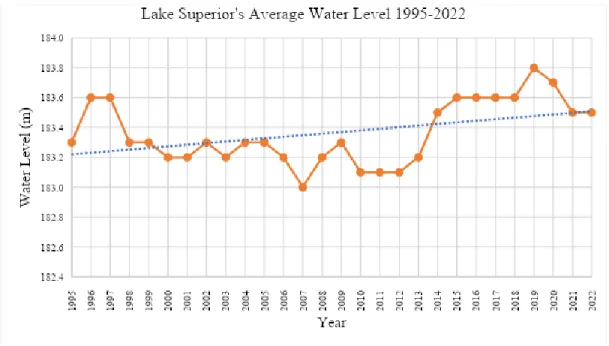
The mean is shown as a black line and the limits of the standard deviation are shown as gray lines in Figure 7. All data points that exceed the standard deviation are labeled, but there is only one label for the years and 2012 with the same water level.
COMPARISON BETWEEN VARIABLES
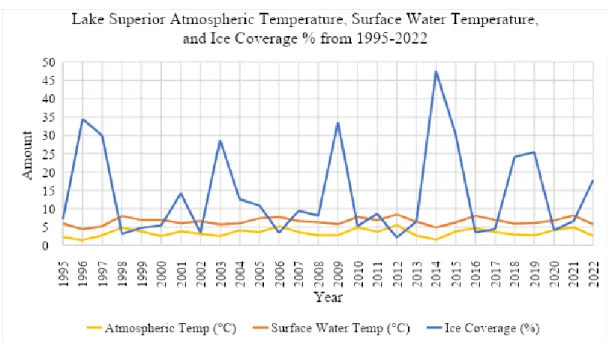
2014 had the second lowest surface water temperature (4.9°C), the second lowest atmospheric temperature (1.5°C) and the highest percentage of ice cover (47.6°C) .
DISCUSSION
WATER SURFACE TEMPERATURE
The lowest temperature occurred in March for both studies, but also in February for Irbe's (1992) study. This is because intensely stratified water will cause a higher temperature difference between the epilimnion and the water below. The standard deviations for winter and spring remained low, but increased since those calculated by Irbe (1992), as shown in Figure 2.
Rapid increases in summer temperature noted by Austin and Colman (2008) were shown to be insignificant in this study. Although this is the largest surface water temperature difference between the two studies, the spring surface water increase trend was the weakest in the study by Austin and Colman (2008). Even if the increase in surface water temperatures has not increased significantly annually, the comparisons between this study and Irbe's show that surface water temperatures have increased in recent years.
ICE COVERAGE
Although this study found ice decline to be insignificant, the surface water temperature increase during summer may suggest otherwise because early ice-out dates allow for more solar radiation absorption (Irbe 1992:32). Based on the insignificant trend of ice cover seen in between, ice does not appear to be declining enough to be completely absent by 2036 as suggested by Austin and Colman (2007). Ice cover data from the NOAA, which were only available as far back as 1973, were downloaded to help investigate the low surface water temperatures seen by Irbe (1992).
However, the relationship between surface water temperatures increasing with decreasing ice cover is suggested in other studies such as Austin and Coleman (2007), Austin and Colman (2008), Piccolroaz et al (2015). In addition, the large increase in surface water temperature in June, shown in Figure 2, may indicate lower ice volumes or faster ice melt in recent years. It appears that lower ice cover percentages cause earlier stratification dates, as suggested by Austin and Colman (2007).
ATMOSPHERIC TEMPERATURE
The mean atmospheric temperature between 1966-1988 was also analyzed to further assess Irbe's data shown in Figure 2. Thus, this study has so far determined that there are lower surface water temperatures, more ice cover, and lower atmospheric temperatures during Irbe's (1992) study period compared to the period 1995-2022. Surface water temperature was found to have no significant relationship with increasing annual trends, which is contrary to the results of Austin and Colman (2007).
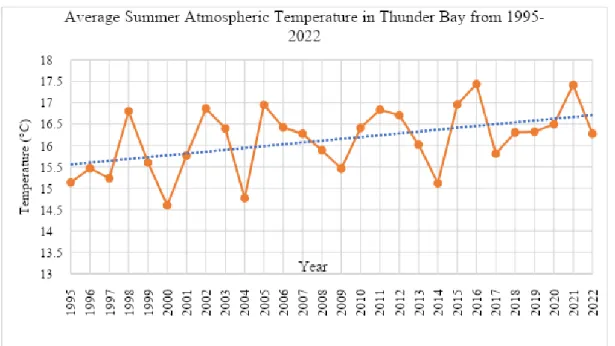
However, this study shows that there were increased surface water temperatures with the significant annual summer temperature increase. For a better comparison of atmospheric temperature with changes in the lake, several stations located closely around the lake should be used. The station used in this paper is about 8 km away from the coastline, which will have variables affecting atmospheric temperature that are incomparable to variables affecting surface water temperatures, ice cover, or water levels.
WATER LEVELS
Wang et al (2012) found that there were lower winter water levels due to reduced ice cover percentages and increased evaporation. The study by Lenters (2004) found that there were reduced summer and autumn water levels. Lamon and Stow (2010) claimed that there had been falling water levels since 1970, but here it was found that water levels from 1927 to 1988 were constant around the average of 183.5m.
Furthermore, from 1918-2022 it was found that water levels were more often above than below average. However, 2003 and 2007 had opposite trends in atmospheric and surface water temperatures, but still had similar water levels. Thus, atmospheric conditions as well as other watershed characteristics must also be considered when analyzing water levels.
COMPARISON BETWEEN VARIABLES
CONSIDERATIONS
Proposals, such as Irbe's that claim that the range and water temperature variability are within acceptable limits despite adequate winter temperature data, may quickly become unacceptable while trying to maintain the resilience of Lake Superior in the face of climate change. Normal atmospheric changes such as El Nino events must also be taken into account when analyzing trends caused by anthropogenically induced changes. It should be noted the ongoing effects of these events, for example the decline in surface water temperature was slow two years after the 1998 El Nino event despite the much lower atmospheric temperatures.
Piccolorz et al (2015) suggests a faster increase in water surface temperature compared to atmospheric temperature. For example, if this study had not included the 1998 El Nino event, we may not have known its potential effects over the next few years without further research. Despite the differences, ongoing studies of Lake Superior are useful for monitoring the impacts of climate change.
CONCLUSION
LITERATURE CITED
Assessing change in the inversion behavior of the Laurentian Great Lakes using remotely sensed lake surface water temperatures. Assessment of potential impacts on Great Lakes water resources based on climate scenarios of two GCMs.