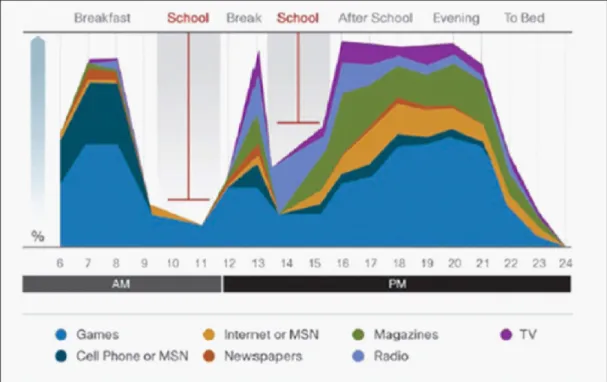
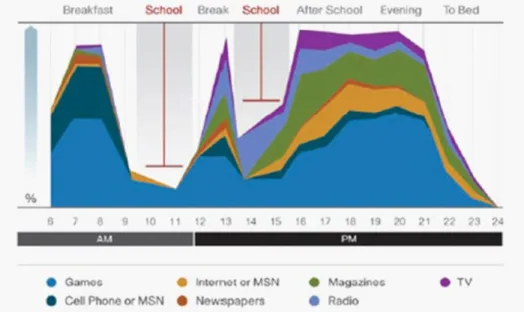
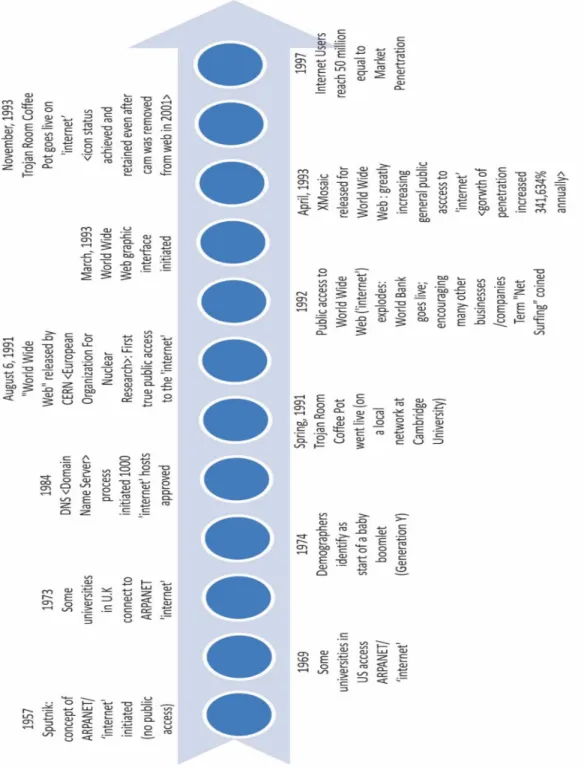
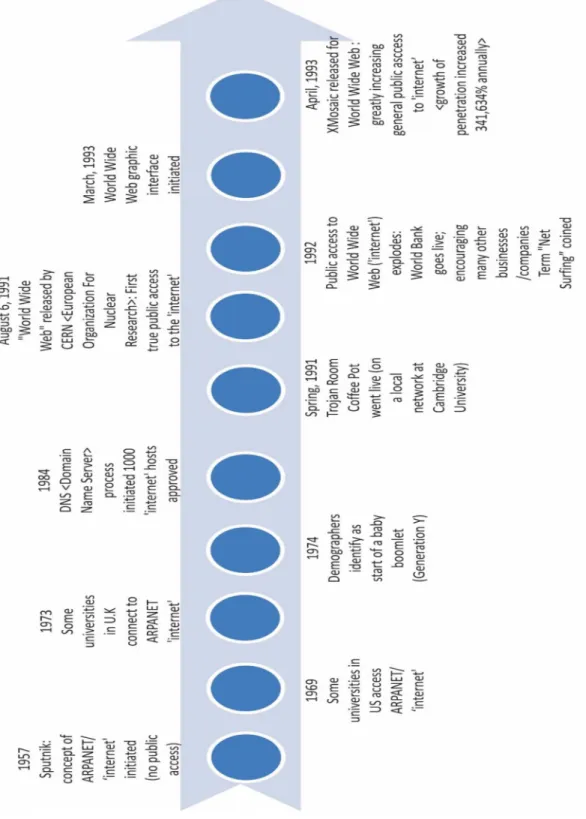
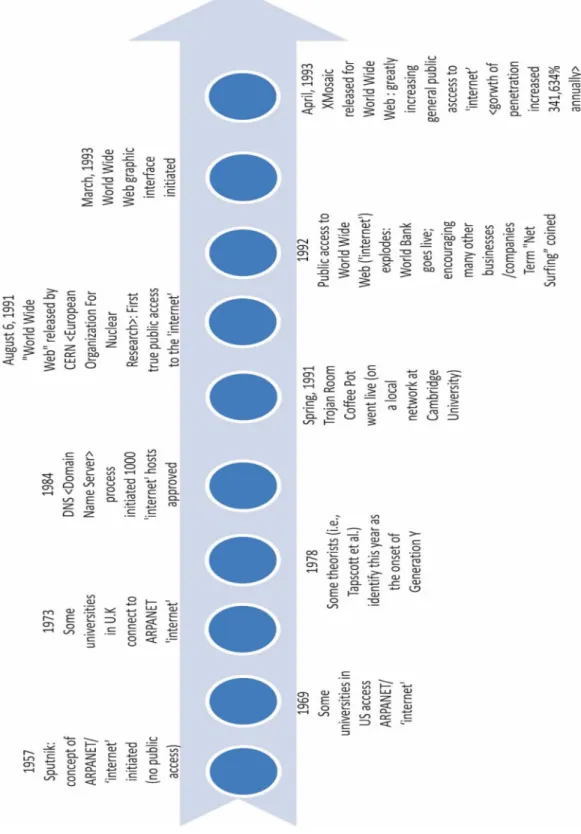
This study was also designed to investigate the possibility that both Prensky (2001a) and those who counter his concept (e.g. Bullen et al., 2011) have identified the wrong generation and that Generation Z is the true digitally native cohort - the generation for whom digital media technologies are introduced early enough in life to provide enhanced digital capabilities. An ongoing institution now, the Internet, in fact, is a recent entity—the study of which helped develop a working operational definition for the age cohort of Generation Z, because it is the Internet, at some point in time, facilitating access to and sharing of digital media across a sufficiently large spectrum of society to create the critical mass proportion of a generation necessary for the digitally native cohort to emerge. The accompanying suggestion is that the absence of use (i.e., the valleys reflected in the graph in Figure 1) represents a lost opportunity to apply a cohort trend effectively in learning situations.
Literature Review
A relatively simple example of the potential complications in this regard can be found in the beginning of the baby boomer generation. This last facet of the construct has been elaborated again recently with specific reference to the use of digital media technology (Rosen a, 2010b). Rosen a, 2010b) argues for the concept of generational differences in technology use and in the process updates and refines facets of the Strauss-Howe construct of generations (Straus & Howe, 1991).
The history of the Internet is largely unclear, with some debate over the exact dates. It appears that members of Generation Y did not have access to technology early enough in age (Hargittai, 2010) and therefore in the learning cycles (i.e., during Piaget's preoperational stage) necessary to become digital natives (Piaget, 1952; Prensky, 2001a, 2001b).
Conceptual Framework
Somewhat comforted by the proposed results of this previous research project, but still grappling with the nuances of appropriate use and implementation of digital media, particularly in the learning environments facing students in the 21st century, led to this more extended and focused research project . The conceptual framework chosen for this project was constructivist, grounded in the work of a wide range of authors. Bruner (1960) built much of his work on Piaget's (1952) and argued that effective learning today is based on learning acquired and adopted yesterday, and that learning yesterday was based on learning acquired and adopted the day before yesterday.
However, in later work he began to explore the influence of the cultural context as a consistent element in the process of constructing learning for each individual (Bruner, 2008). Although much maligned, the evolving conceptual framework of digital natives as opposed to digital immigrants was an obvious phenomenon for experienced teachers like this researcher in their everyday learning environment. Upon closer examination, as a result of the data from this study, among other work in this area, it can now be firmly concluded that Prensky's (2001a) underlying conceptual framework was indeed sound.
In summary, Prensky (2001a) made a fundamental mistake in working with age groups that entered Piaget's (1952) preoperational stage too early in the history of Western culture. Prensky identified a future trend, rather than one that was quantifiable across the age groups he was actually working with at the time. Persistence in conducting research at the postsecondary level, rather than focusing on younger students in K–.
It is unfortunate that research appears so late in the learning development of students in Western culture.
Methodology
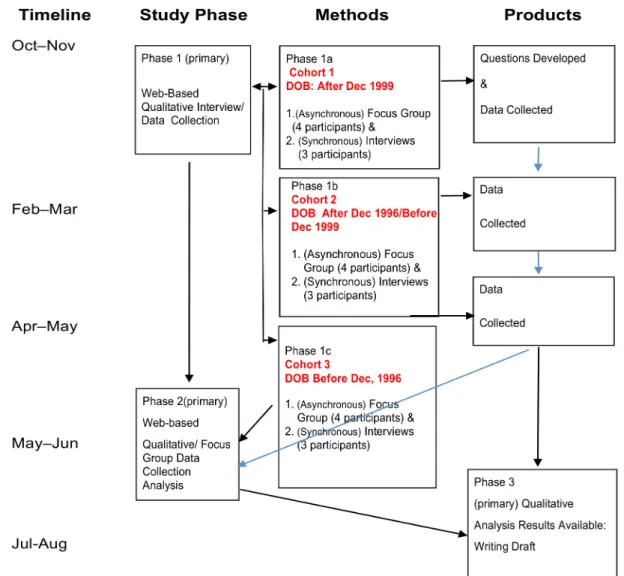
This phase involved the first subgroup of the case study age group invited to undertake focus groups and interviews. This phase involved the second subgroup of the case study age group invited to undertake focus groups and interviews. All aspects of Phase 1 data collection were conducted online, as described in detail in this section.
The content and form of the questions were a mixture of visual and textual material. As part of the process, each participant in the focus group was given a short series of identical prompts. When completing question set 4 in the focus group, each participant was contacted separately via e-mail and invited to participate in the follow-up semi-structured interviews.
This video was treated as significant because the participant was a member of the youngest cohort in the study. Also known as epoche (Moustakas, 1994), this process involved separating the researcher from any The purpose of the study was to begin the exploration of a recently emerged and to date.
During the data collection process, the researcher took steps to protect the participants and the integrity of the study.
Results
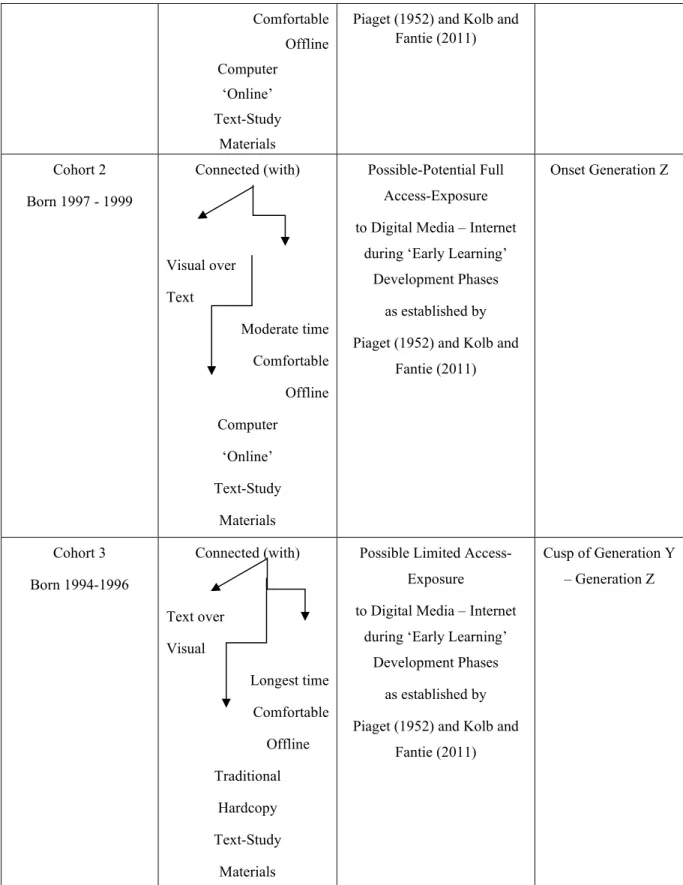
Data from this study provided additional information on topics specific to the subject area. The data from this study provided additional information in themes specific to the improvement of the “Offline Comfort Level” topic area presented in Tables H9 to H12 in Appendix H. The data from this study provided additional information in themes specific to improvement in the thematic area of “Offline Comfort Levels,” with the average amount of time participants expressed as “comfort and/or ability to stay offline” during an average school workweek day was approximately (a) 9.5 hours for those , born before December 1996, (b) 7 hours for those born between December 1996 and December 1999, and (c) 6 hours for those born after December 1999.
Data from this survey provided additional information on topics specific to refining the thematic area of "Comfort Level While Offline," as shown in Table H5 in Appendix H. Data from this survey provided additional information on topics specific to refining the thematic area of "Comfort level while offline." The participants were asked, Thematic area "Connecting." Data from this study provided additional information on topics specific to refining the thematic area of "Connecting," as participants in this study defined "Their activity during a long trip" (in their own words), as discussed in the sections, that follow.
Data from this survey provided further information on topics specific to refining the thematic area of 'Connecting', in that participants preferred to be contacted. Participant responses to the thematic area of “Length of Video (Preferred)” are shown in Table H24 in Appendix H. Additional data from this survey provided further information on topics specific to the thematic area of “Multitasking: Playing and to work. ” This information is shown in tables H30 through H32 in Appendix H.
Data from this study provided further information on topics specific to the thematic area of the "Work in groups or teams." This information is presented in Table H36 in Appendix H.
Discussion of Results
In the area of Multitasking, all three groups displayed a strong grasp of the concept and its relationship to their lives, demonstrating clarity in distinguishing multitasking during play from multitasking during work processes. This pattern repeated itself, as logic would dictate, in the realm of text messaging versus email. The data from this study provided further information on the specific topics of the thematic area of "Defining descriptions for play and work".
This pattern of consistency held through many facets of the data collected, as can be seen in the Appendices that indicate data collected. Data from this study provided further information on topics specific to the thematic area of the “Selection of tools. Data from this study provided further information on topics specific to the refinement of the thematic area of the "Friend-Peer Connection".
Data from this survey provided further information on topics specific to refining the thematic area of “Connecting with Friends-Peers.” The participants in this study defined. All interviewees in this study (i.e., the nine individuals who only participated in the interviews) were asked who they were. With regard to celebrities, none of the nine interviewees indicated that they admired “celebrities” (that is, any celebrity of her choice).
The analysis of the responses also produced a number of recommendations, including this urgent need for more research, which will be addressed in the final chapter of this study.
Conclusions and Implications
By treating these tendencies, preferences, and traits as thematic areas, in an exploration of the current adolescent-age cohort at the time of this study (e.g., following the parameters of Generation Z), the results of this study suggest digitally native students are connected via digital media, prefer text messaging over email and talking, prefer working with images over text, and prefer immediate results. Generation Z also considered the age range (i.e. dates of birth) for the cohorts of participants in this study. Oblinger, 2005; Prensky, 2001a; Rosen, 2010b; Tapscott, 2008), multitasking could be a quantifiable measure for defining the members of the digitally native cohort.
In preparing the recommendations, the data received from the three cohorts of this study are summarized in the context of thematic areas (see Table I2 in Appendix I). The sign on the door is supposed to tell us - in a marketing rather than an educational way - that this is the school headquarters of a local digital/virtual/online distance learning organization. Over the past decade, this school district in this mainstream BC community has repeatedly used its official website to argue that distance education school results (ie digital media environments) should be excluded from the school district's overall graduation rates.
This study explored the early onset propensities of this cohort of students (i.e. Generation Z), and the fact that this kind of interface space exists as their primary link between what 'was' and what 'now is' reinforces the overall significance of this study. What could be said, from the formal start of this study, is that the oldest members of Generation Z were potentially between 14 and 18 years old. The literature since this study was conducted continues to flourish (i.e., Chojak, 2019, et al., with their use of Nfirs studies that led to exploration in the emerging field of neuropedagogy) and creates substantial core value to an ongoing state of flux that is difficult to accommodate in one report.
The interface space of the type described is inappropriate because data from this study strongly suggests that students in the Generation Z cohort overall prefer less, not more, complexity in their environments. It is just one example of the real, practice-based paradigm shift needed for the learning capabilities of this group of adolescents. The goal now is to refine the current educational paradigm in light of the findings of this and other recent studies.
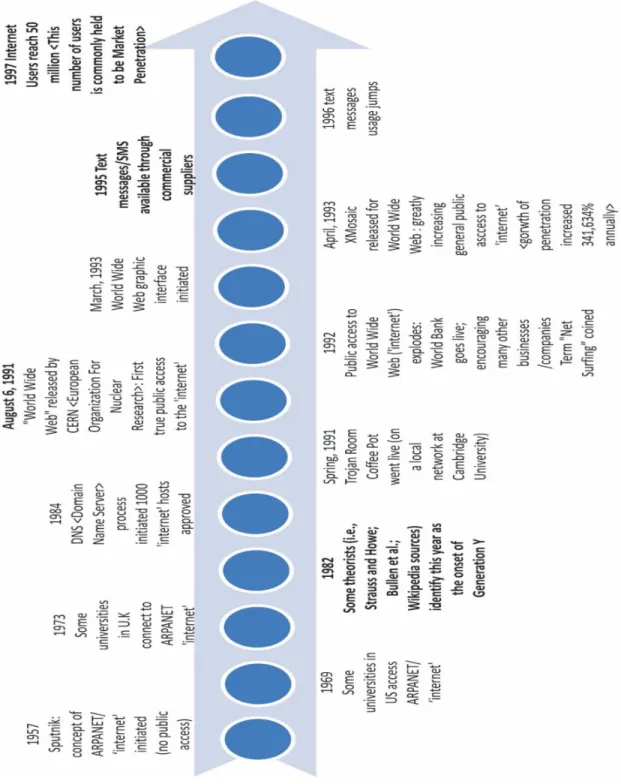
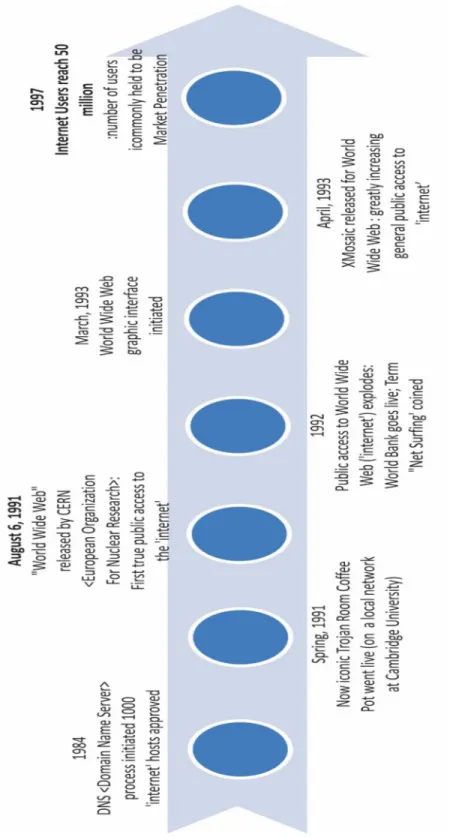
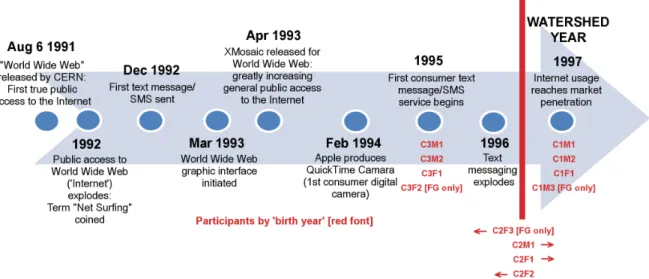
![Figure 8. Timeline [enhanced] for Internet/World Wide Web developments related to Generation Z characteristics](https://thumb-us.123doks.com/thumbv2/9docorg/12431651.0/76.918.244.711.114.897/figure-timeline-enhanced-internet-developments-related-generation-characteristics.webp)