Gabbar, "Feasibility Analysis of Grid-Isolated Nuclear Renewable Hybrid Energy System for Fast Charging Station", 41st Annual Conference of the Canadian Nuclear Association, June 5-June 08, 2022. Gabbar, "Techno-Economic Analysis of Grid-Connected Fast Charging Station Using SMR and Renewable Energy" , 41st Annual Conference of the Canadian Nuclear Society, June 5 - June 8, 2022.
Introduction
Background
As a result, renewable energy-based fast charging stations are needed to reduce dependence on the electricity grid. A Level III charging station is the third category, also called a fast charging station.
Motivation
As a result, energy storage devices are necessary, but a clean and continuous supply of energy is also required to reduce massive energy storage needs. Even if energy storage technologies are incorporated, a significant amount of energy will be wasted in these off-grid energy systems.
Problem Definition
Traditional energy management strategies cannot determine the optimal configuration of the hybrid system when a significant amount of data is involved. The reliability, efficiency and accuracy of the energy management system of the proposed system must be tested.
Objectives
These limitations can be addressed using an adaptive optimization approach, which can also be used to evaluate energy management and system reliability. Model four energy systems namely "Conventional Fossil Fuel Based Energy System", "Independent Nuclear Energy System", "Hybrid Renewable and Fossil Fuel Based Energy System" and "Hybrid Renewable Nuclear Energy System ".
Thesis Outline
The design of a control system for energy management and its optimization are discussed in this chapter. This chapter contains the characteristic equations for the control strategy, objective function, constraints and variables required for the dynamic modeling of the energy management and optimization technique in MATLAB software.
Fast Charging Station
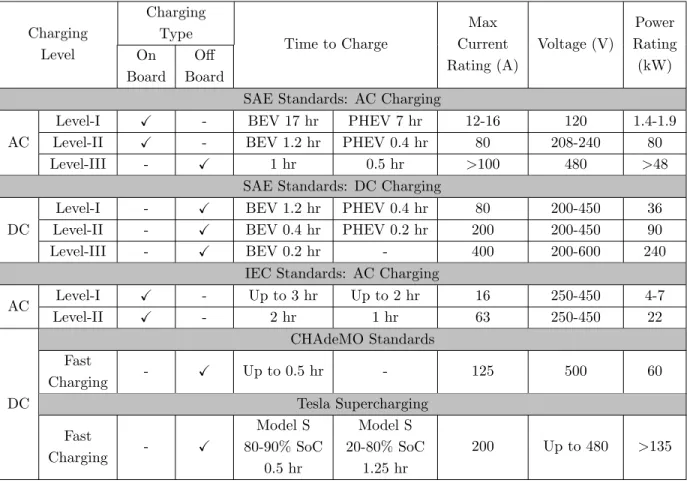
- Fast Charging Station Standards
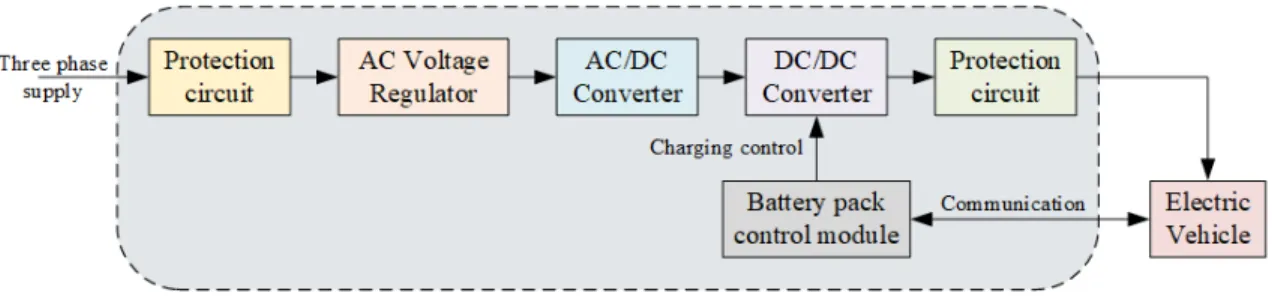
- AC Charging System
- DC Charging System
As a result, on-board chargers can be used to charge EVs at both levels 1 and 2, while off-board chargers can be used to charge EVs at levels III. There is no need for additional electronic components (eg, on-board chargers) to install as these chargers effectively use household outlets.
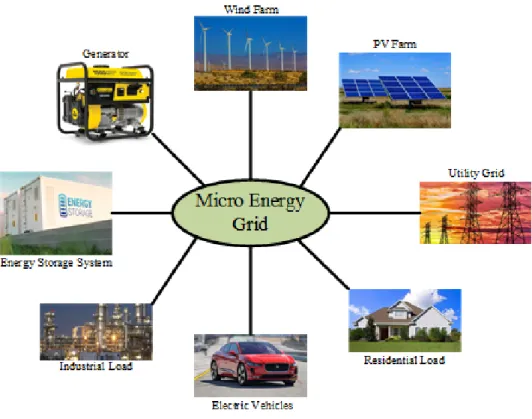
Micro Energy Grid (MEG)
- MEG-based Fast Charging Station
One of the main reasons for the appeal of EV adoption is the reduction in CO2 emissions. To improve the electricity demand curve and the profitability of the fast charging station, the authors in [67] proposed a coordinated charging approach.
Nuclear-Renewable Integration
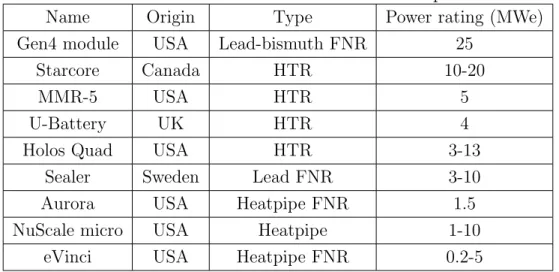
- Micro Modular Reactor (MMR)
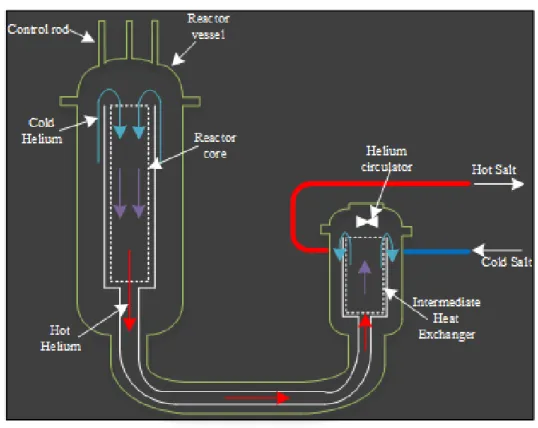
The nuclear heat supply system and the MMR reactor are housed in the Citadel building. An intermediate heat exchanger in a nuclear heat supply system is used to remove the heat produced by the reactor.
Key Performance Indicators (KPI)
- Net Present Cost (NPC)
- Cost of Energy (COE)
- Return on Investment (ROI)
- GHG Emission
The amount of electrical energy required to charge an electric vehicle requires adequate EV charging infrastructure. For EV charging companies to be successful, they must be able to demonstrate that their services are reliable and consistent.
Control Strategy of Fast Charging Station with HESHES
The DC voltage and flywheel speed are typically controlled by a proportional-integral (PI) controller based on a linear system model in a conventional control approach. The application of the gray prediction approach is used in [139] to construct a gray prediction control system.
Energy Management System for Fast Charging StationStation
With the significant inter-temporal fluctuation of power generation from the PV system and the varying traffic in a parking lot, optimal energy management has been emphasized [145]. In [152], MPC was used to control the power flow via a voltage source converter and a DC/DC converter for a hybrid PV/battery-based island AC microgrid.
Optimization Techniques for Energy Management SystemSystem
- Linear and Non-linear Programming Methods
- Dynamic Programming
- Meta-heuristic Approaches
In [167], for example, binary variables were used to handle the ON/OFF states of the microgrid's photovoltaic, wind, biomass, gas turbine, and fuel cell generators. Using a linear approximation of the objective function and constraints to make a mixed integer linear programming (MILP) problem is an excellent way to solve some of the problems with MINLP.
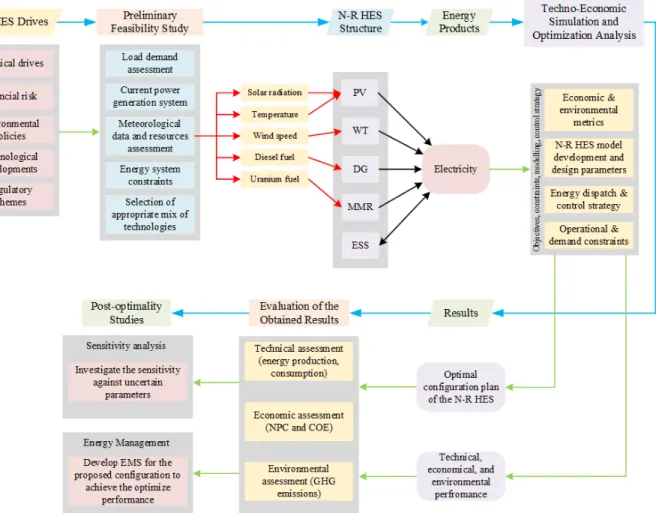
Research Framework
After adopting the candidate energy technology, the best possible strategy must be determined. As a result, as described in the third step of the suggested strategy, it is essential to provide a comprehensive techno-economic simulation and optimization study.
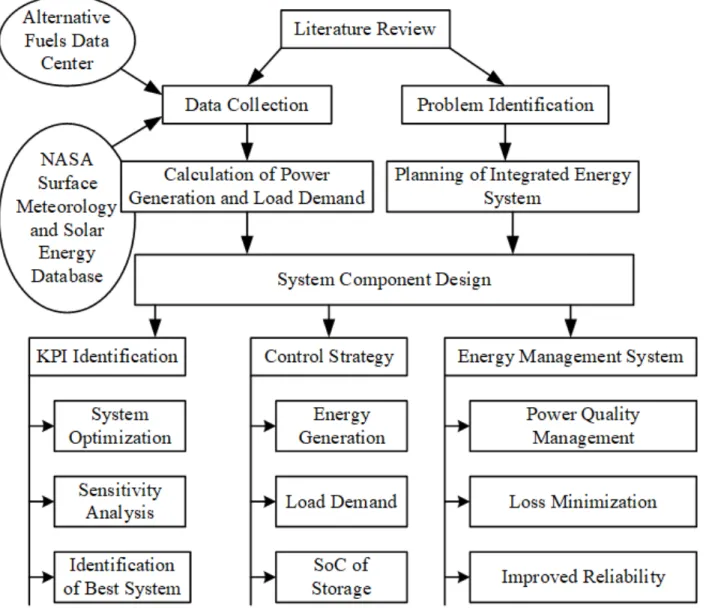
Methods of Data Collection
The nature of the problem determines the optimization objective or criterion to be used for each optimization task. An effective energy management system with a control strategy is also needed to provide optimal performance of the hybrid integrated system.
Methods of Analysis
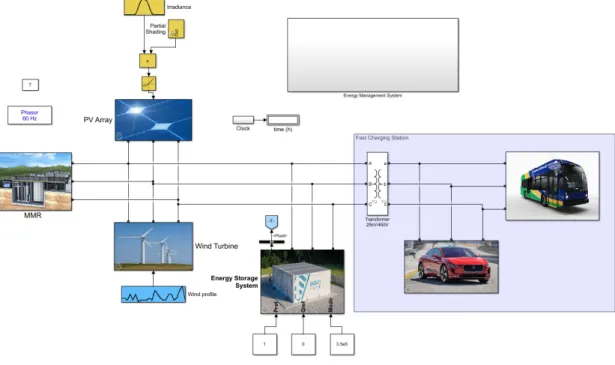
The average daily electrical load profile for a typical fast charging station was obtained from the Alternative Fuels Data Center (AFDC). In order to verify the performance of the proposed N-R HES, a fast charging station with the capacity to accommodate one thousand cars per day was evaluated in this study.
Analysis of Methodology Selection
MATLAB enables users to perform simulation based on mathematical modeling and object-oriented simulation (MATLAB/Simulink). Based on the discussion in Chapter 2, this thesis aims to design a control strategy that combines MRAC and MILP to effectively account for uncertainty and capture part of the nonlinear dynamics of the system.
Control Algorithm for Energy Management Sys- temtem
The second mode of operation is when renewable sources produce excess electricity beyond load demand. When the output power of PV and WT is less than the load demand, the final operation mode is activated.
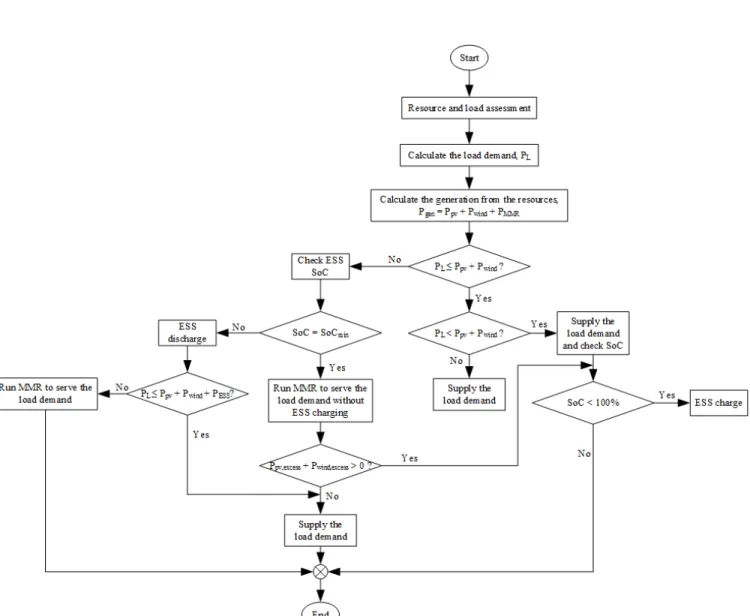
Assumptions
It minimizes NPC by reducing MMR operating hours and thus fuel consumption. In this mode of operation, the renewables will first meet the load demand, with additional energy used to charge the energy storage system if the SoC of the ESS is less than 100%.
Micro Modular Reactor (MMR)
Due to the rapid rate of temperature change, the load-following approach also affects heat exchangers. In addition, load-following nuclear power plants are necessary if a significant part of the power generation comes from nuclear sources [201].
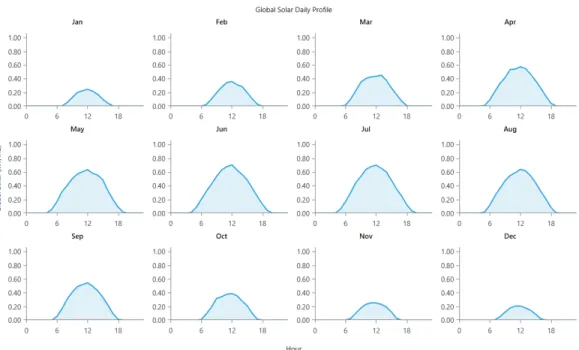
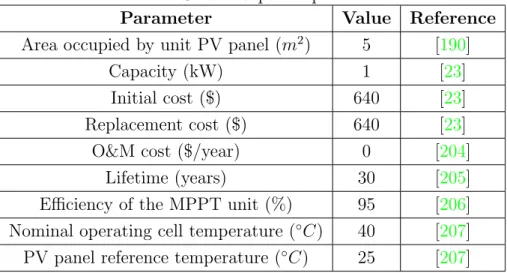
Solar Energy
1 +αp(T empt−T empstc)] (4.3) where,γpv indicates the capacity rating of the solar panel (kW),Fpvis the derating factor (%), Irt represents the irradiance (kW/m2) at time t, Irstc is the irradiance (kW/m2) at standard test conditions, αp is the temperature coefficient (%/◦C), T empt and T empstc represent the temperature (◦C) for the current time and the standard test condition, respectively. In this study, the derating factor is considered during the modeling of the solar panel.
Wind Energy
For practical implementation, the cell temperature is higher than the standard temperature (25◦C), and if the temperature effect is neglected, the simplified equation of (4.3) can be as follows:. 4.4) The average daily solar irradiance and clarity index for the first year of the project is shown in Figure 4.3. The wind speed for the first year of the project used in this study is depicted in Figure 4.4.
Diesel Generator
The detailed specifications of the wind turbine considered in this study are shown in Table 4.3.
Energy Storage System (ESS)
- Flywheel Storage System
- Battery Storage System
- Supercapacitor Storage System
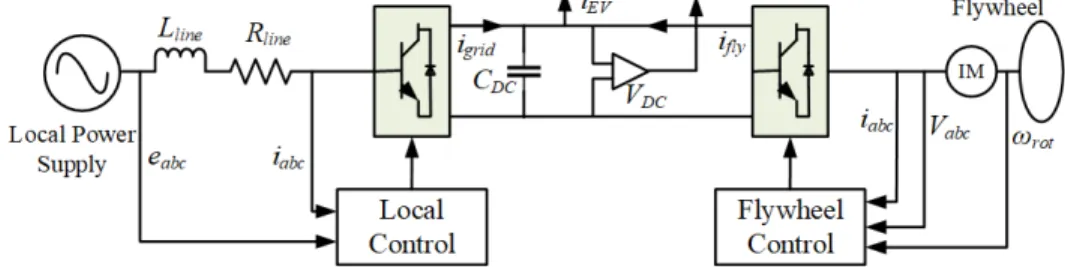
Figure 4.5 shows the configuration of the flywheel storage system for the fast charging station. A similar concept is also used in this research for fast charging of the energy storage system in a fast charging station.
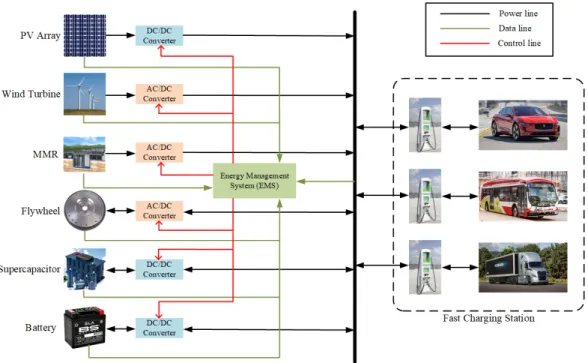
Fast Charging Station
The objective function required for making the control strategy is described in Section 5.3, while the constraints are presented in Section 5.4. The implementation of the proposed algorithm in the fast charging station is described in section 5.5.
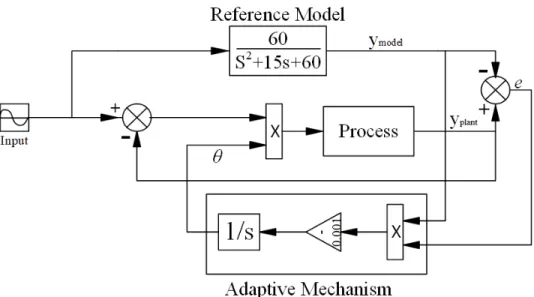
Control System Design
The results of the comparison between the reference model and the plant model are sent to the adaptive mechanism via the controller. Using this reference model's control parameter is one of the goals of the adaptive mechanism.
Stability Theory of the Control System
For optimal tracking performance, the adjustment gain is set to 0.001 due to the high tracking performance of the system. Here xp is the state of the installation and Γ is the adjustment gain matrix which is positive definite.
Objective Function
Wbuy(k)·Pbuy(k)−Wsell(k)·Psell(k))∆t (5.30) where the step horizon of the optimization is denoted by N, the cost of purchasing energy from the hybrid energy system at time ' k' is represented by Wbuy(k), while Wsell(k) is the selling price of the energy generated by the system. Psell(k) andPbuy(k) represent the forward and reverse flow of the system, respectively, and ∆t is the sampling time.
Constraints
If PESS is positive, the energy storage system is charged, and if negative, it is discharged. Last but not least, constraints are imposed on the stored power to represent the maximum power that can be charged/discharged by the storage system in a predetermined time period.
MRAC with Mixed-Integer Linear Programming
- Optimization Problem Formulation
- Optimization Problem Solution
- Control Set-Points Execution
- Shifting the Prediction Horizon
Based on the latest updates of system states and power electronics efficiency values and forecasts for future PV, WT and MMR output levels, load requirements. All this is done by re-evaluating the current state of the system, re-calculating the efficiency of the power electronics and then solving a new optimization problem.
Load-following Mechanism
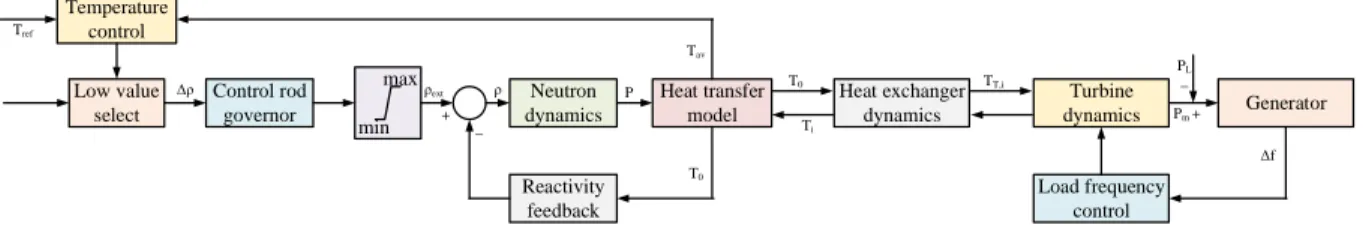
- Load Frequency Control
- Temperature Control
The input for the load-frequency control is the speed difference between the measured speed and the reference speed. Temperature control is used in the load following mechanism to limit the maximum predetermined temperature of the gas turbine output.
Comparison among the Proposed Hybrid Energy System
- Case I: Standalone Diesel Generator based System
- Case II: Renewable Energy based Diesel Generator System
- Case III: Nuclear Only System
- Case IV: Nuclear-Renewable Hybrid Energy System (N-R HES)HES)
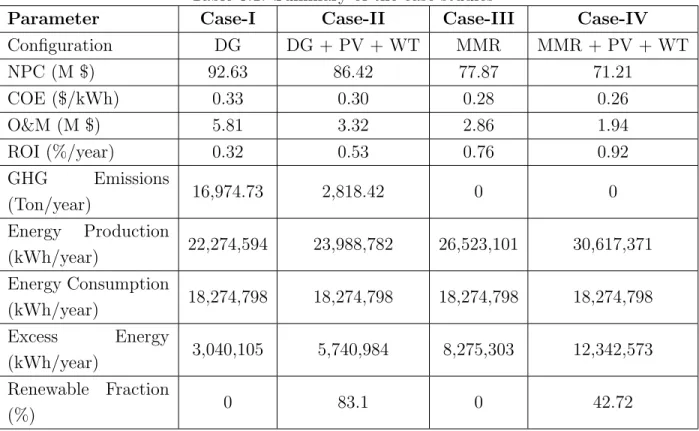
- Proposed N-R HES Performance Measures
As shown in Figure 6.6(a), DG operates year-round at full power between midnight and early morning when solar energy is insufficient to meet the load demand. A detailed time series of the system analysis is shown in Figure 6.11, where the generated power from the MMR, PV and wind turbine and the power consumed by the fast charging station for the first year of the project timeline are presented.
Sensitivity Analysis
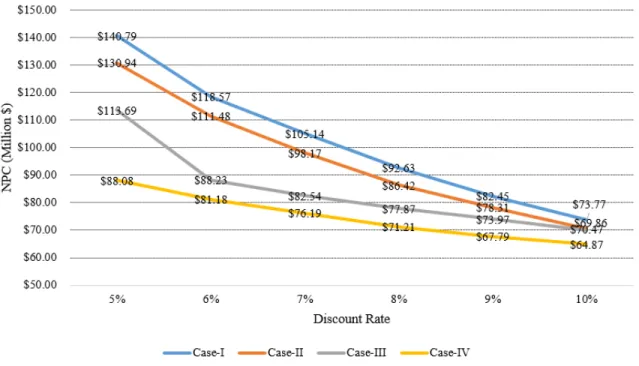
- Sensitivity Analysis of NPC based on Discount Rate
- Sensitivity Analysis of NPC based on Inflation Rate
- Sensitivity Analysis of NPC based on Change in Load De- mandmand
In the sensitivity study, the inflation rate is adjusted between 1% and 5% to determine the effect of inflation on the NPC of various energy systems. With respect to the inflation rate, Case-IV has the lowest NPC of all the energy systems.
Simulation of MRAC System
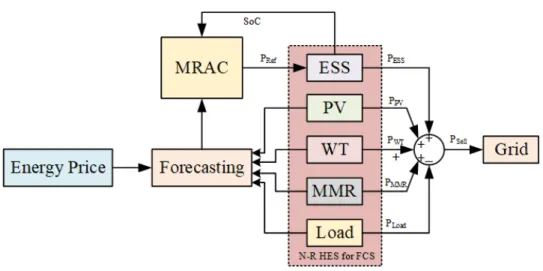
Simulation of Energy Management System with OptimizationOptimization
Figure 6.24 shows the performance of the proposed HES with the addition of a conventional energy management system (metaheuristic). From this figure, it can be seen that the proposed EMS system can efficiently predict the load demand using the forecast function, thus enabling the system to produce the required amount of energy to meet the load demand and ESS capacity.
Conclusion
According to the results of the sensitivity study, Case-IV always has the lowest NPC of all power systems regardless of parameter modification. Overall, the objective was to design a control approach that combines mixed integer linear programming (MILP) with a reference adaptive control (MRAC) model to effectively account for uncertainties and capture some of the nonlinear dynamics of system by updating the system model at each time step.
Contributions
It is then built in MATLAB software and optimized using mixed integer linear programming approach with reference adaptive control strategy model for system energy management. Comparison of energy cost, energy savings and storage utilization is used to evaluate the effectiveness of the suggested energy management with the optimization method.
Recommendations
The recommended power must be maintained during the selection of the system components to obtain the best results. The recommended configuration of the central processing unit must be considered to obtain efficient performance from the deployed system.
Limitations
An effective control system is necessary to maintain equipment switching and data transmission for improved interconnection and communication. Forecasting algorithm development for MMR, WT, PV output, FCS load demand and energy pricing is beyond the scope of this project.
Future Work
Ghosh, “Optimization of EV charging with energy storage in the electricity market,” IEEE Transactions on Smart Grid, vol. Geng, “Energy management of microgrids in grid-connected and stand-alone modes,” IEEE Transactions on Power Systems, vol.