I thank the Barrett-Henzi lab at the University of Lethbridge for their insight and criticism and the many hours they devoted to helping me with this learning process. Special thanks to Ken Lehman of the City of Red Deer and Todd Nivens of the Kerry Wood Nature Center for their input regarding the booth location and postage in the City of Red Deer.
Expanding the Five Dimensions
However, the author's participants were mostly visitors to the urban neighborhood, not city dwellers. 2018) acknowledge this as a limitation and stated that their research does not speak to continuous exposure to the sites.
The Path Forward
Using factor analysis and the aforementioned method, I validated a revised version of DENS and called it Dispositional Empathy with Nature revised (DENSr) (Tam, 2013a). Third, I examined the effectiveness of the recruitment method found in Chapter 4 as well as conducted a cross-city comparison of attitudes and behavior towards wild animals as captured by responses to the UWCAS Chapter 5).
Narrowing the Scope
Research Questions
Background Literature
Furthermore, interactions with nature can be altered when awareness is shaped by positive interactions (Hariohay et al., 2018; Mir et al., 2015). Similarly, negative attitudes due to the destruction of property by wild animals can exacerbate human behavior, sometimes leading to the destruction of natural resources (Hariohay et al., 2018;.
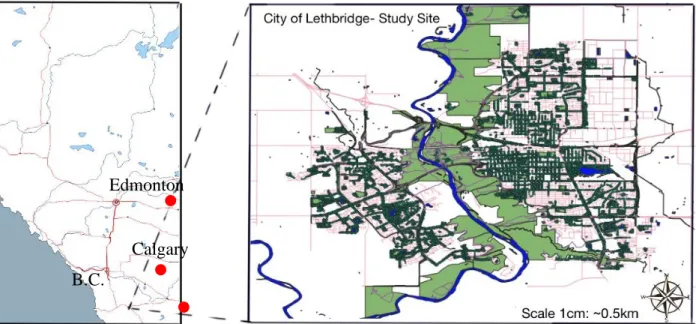
Study Site
SES is investigating the connectivity of wildlife habitats through corridors in the city and hopes to better inform policy related to habitat connectivity. Therefore, I am working with SES and the City of Lethbridge to improve infrastructure and ecosystem management in the city.
UWCAS Pilot Study
Introduction
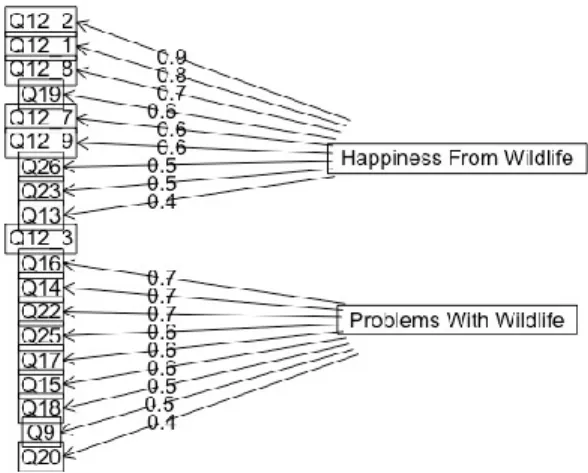
To understand these two conflicting explanations, I used a frequency measure to examine how often participants recall the frustrations and problems they have with wildlife and compare it to their level of tolerance for wildlife. If the UWCAS falls on one factor, then the items point to the overall construct of tolerant coexistence with wildlife, because the highest loadings will point to questions dealing with tolerance.
Methods
Both versions of the survey contained a measure of the Revised Dispositional Empathy with Nature (DENSr). Additionally, dispositional empathy with nature (DENS) “refers to the dispositional tendency to understand and share emotional experiences of the natural world” (Tam, 2013a).
Results
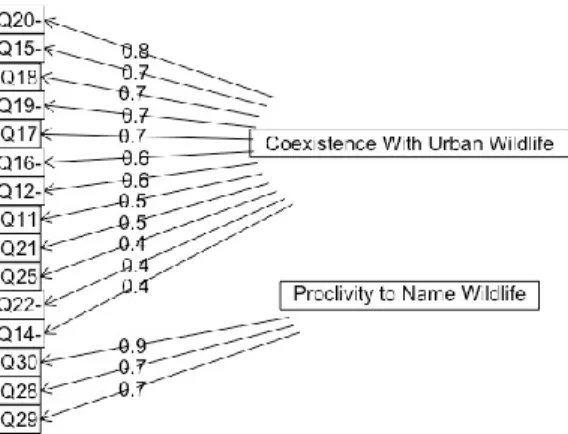
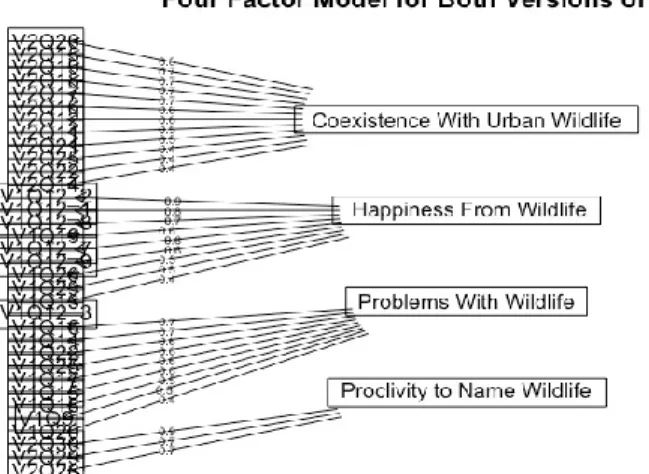
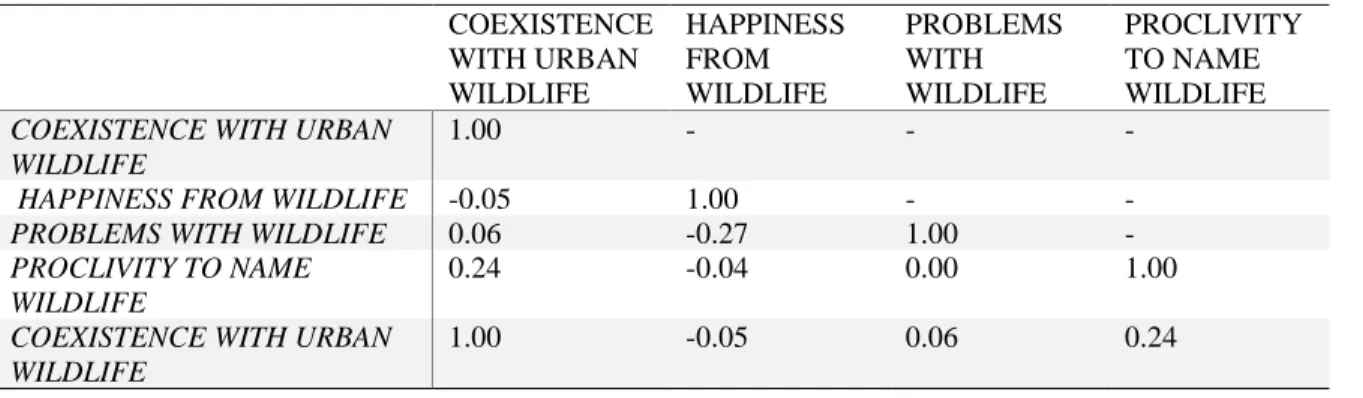
The UWCAS version 2 items were collapsed into two factors indicating the two constructs coexistence with wild animals and propensity to name wild animals (Figure 3.5). The best fit was a four-factor model (Figure 3.6), with 33% of the factor items explained by the UWCAS and 18% of the items explained by the happiness construct.

Discussion
In investigating the results of the factor analysis, the initial factor analysis of three of the measurement tools produced one-factor results for the use of DENS, DENSr, and NR6. Upon further investigation of the item loadings and communities, as well as looking at the structure of the items, I found that for Version 1, the items loaded on potential constructs of. Dispositional empathy reflects one's tendency to understand and share the emotional experience of the natural world (Tam, 2013a).
With the result of the factor analysis of the combined tools (DENS and DENSr), two different factors (animate and inanimate) emerged, contrary to my hypothesis. When we try to compare the metrics to determine which one is better than the other for understanding urban wildlife coexistence, the answer will only be found in the definition of the construct.
Implications
In fact, all means for the agreement anchors were negatively skewed, whereas only the four items with frequency anchors were negatively skewed. My goal was to understand people's general tolerance for wild animals; therefore, I used agreement anchors because agreement anchors target the heart of the respondent's tolerance by not only asking questions about tolerance, but also questions about problems, enjoyment, and frustrations. Using a multiple regression where UWCAS was the dependent variable, I found that attitude measures on the UWCAS were not significantly related to proximity to a park or green space for either version of the survey.
Further work using a more diverse population is needed to better assess the relationship between park proximity and wildlife tolerance. Similarly, further work in recruiting participants from different locations within the city will increase the variance and allow the correlation between respondent residence and wildlife tolerance to be evaluated.
Limitations
Another limitation of the study was the low variance in the study's two spatial measures: proximity to a park and city residence. Future studies (chapters 4 and 5) will expand to invite participants from different parts of the city. The nature of the individual Likert questions presented in this chapter could be ordinal rather than continuous, which would violate the assumptions of PPM.
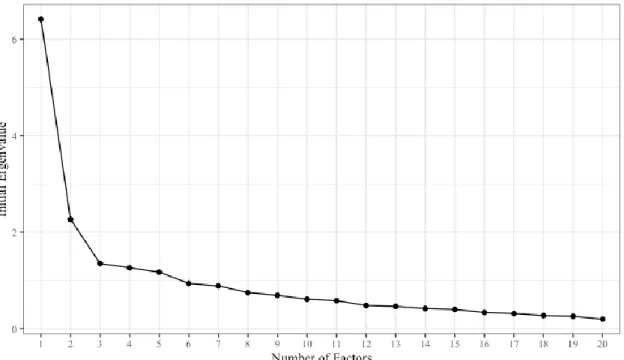
The result would mean that the EFA results would be underestimated because the PPM correlations cannot fully capture the ordinal relationship, either due to non-linearity or their regression to the federated factor (Bandalos, 2018). Because screes were used in the attempt to extract the number of factors, these types of graphs have been shown to overestimate the number of dimensions in the data (Baglin, 2014).
UWCAS Refined Scale, Different Demographic
Introduction
This increased variance can provide meaningful insight into the extent to which an individual is willing to support an idea, helping to distinguish those who disagree with the positively packaged scales. I examined the differences between ML and OLS assumptions with a post hoc evaluation of the exploratory factor analysis to see if there were significant changes in the simple structure of the data and the choice of which items to retain or discard. My overarching research question was the same as in the pilot study: to understand Lethbridge residents' perceptions, attitudes, and behaviors toward wildlife.
If every area of the city is treated the same way, the west side of the city will have the highest frequency of responses. If residents living on the west side of the coulee have a higher response rate, then they will also score higher on the UWCAS than residents living on the east side of the coulee.
Methods
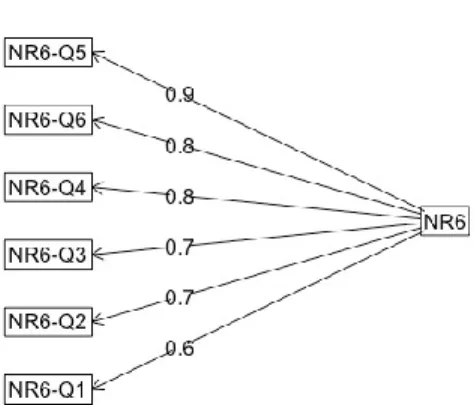
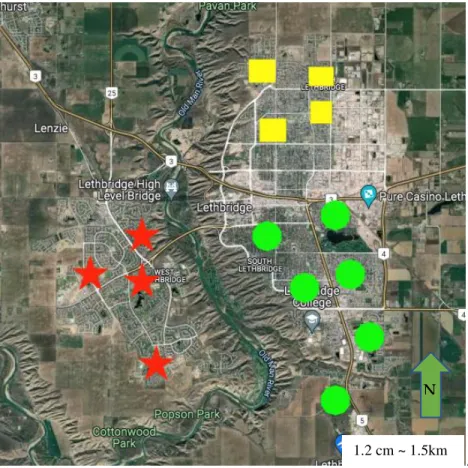
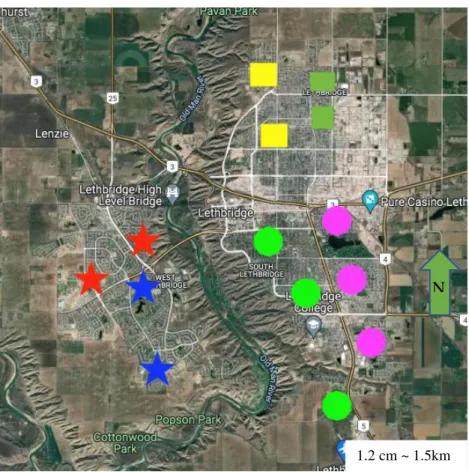
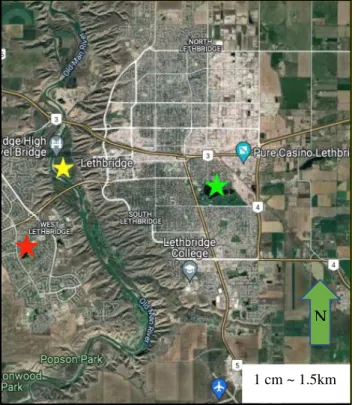
I did not change this for that survey because I combined the six areas into three for data analysis, making the path distinction irrelevant (Figures 4.1 and 4.2). Within each of the six regions (Figure 4.1), apartment complexes were selected according to location and number of residents. The measuring instruments used were a shortened and revised version of the UWCAS (scores on the UWCAS were a calculated mean minimum score of 0 and a maximum score of 5), together with the Nature Relatedness short form (NR6) by for validity testing (Nisbet) & Zelenski, 2013).
Before taking the survey, some participants were asked if they had been out of the country in the last 14 days or if they felt any illness. Exploratory factor analysis (EFA) was used to examine survey components for construct validity and internal consistency.
Results
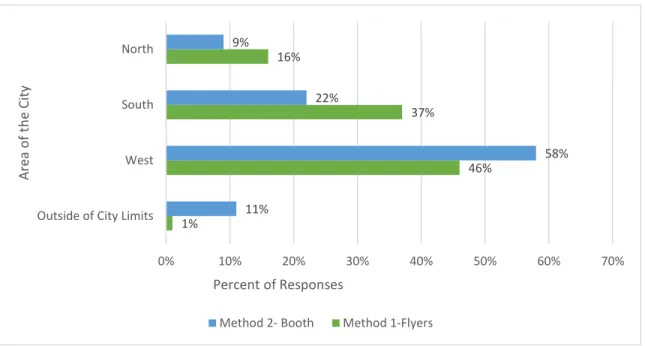
Respondents from the west side of Lethbridge had a large proportion of the response rate, with residents on the south side having the second highest rate and the north side having the lowest proportion of city residents. In trying to understand whether areas of the city were equally represented, I found that the most represented area of the city (ie, the area with the highest response rates) was the west side of Lethbridge (Figure 4.5). ART3 Since the pandemic started, would you say you see more wildlife in the city.
Multiple linear regression was used to test whether age, education, area of town, and religion would significantly predict responses to the UWCAS. The results show that residents on the west side of the coulee scored lower on the UWCAS than residents on the east side (tables 4.9).
Discussion
However, in method 1, I spent additional hours on the north side of the city to compensate for the low participation rates that I had obtained while collecting data using method 1. The residents of the north side of Lethbridge have traditionally been working class and have a lower socioeconomic status (SES) than the rest of the city. Age, education or area of the city had no effect on the response sets for the UWCAS.
Interestingly, the request for demographic information was also one of the most contested issues in the survey. UWCAS can also inform planners which animals are the most favored areas of the city.
Implications
The urban design of parks and green spaces with features would greatly benefit the settlement of residents in the city (Negami et al., 2018). Place attachment (i.e., individual experience and affective attachments), sense of place (i.e., the comprehensive relationship between people and spatial environments), empathy, and perspective taking have been found to significantly influence at least some pro-environmental intentions ( e.g., volunteering and cleaning up litter), and some claim that emotional attachment plays a role in protecting the natural environment (Jorgensen & Stedman, 2001; Jorgensen & Stedman, 2006; Von Wirth et al., 2016; Walker & Chapman, 2003). Pro-environmental behaviors can act as a positive feedback loop, where the more an individual helps sustainable environmental causes, the more they gain a sense of place and increase their connection to nature in urban environments.
As individuals increase their sense of place and place attachment, urban residents can see their happiness, well-being, and overall health increase (Larson et al., 2016b; Negami et al., 2018). Having places where people can engage outside the home and a placemaking setting is essential to the health and well-being of a community (Larson et al., 2016b; Umberson & Montez, 2010).
Limitations
Future research could also investigate response groups to the UWCAS in different cities and assess whether there is a difference between the residents of these cities and their willingness to coexist with urban wildlife.
Cross Population Studies
- Introduction
- Methods
- Results
- Discussion
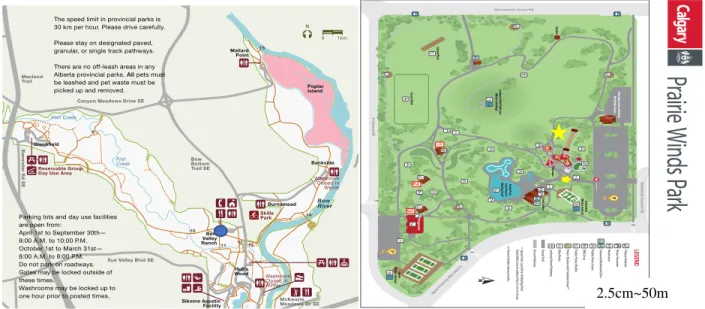
Finally, I conducted the Kruskal Wallis test to examine the mean differences between the residents of Lethbridge, Calgary and Red Deer. There was no significant difference in mean scores on the UWCAS between Calgary, Red Deer and Lethbridge. There was no significant difference in mean scores on the NR6 between Calgary, Red Deer and Lethbridge.
As predicted, there was no significant difference between residents of Lethbridge, Calgary and Red Deer on the UWCAS. Furthermore, the way residents in Lethbridge, Calgary and Red Deer relate to nature (NR6) was not significantly different.
Attitudes and Behavior Towards Wildlife-Going Forward
Ceiling effects are the condition where most of the data is close to the upper limit (Chyung et al., 2020). I also found that across all versions of the UWCAS the distribution of responses was negatively skewed. Engaging urban nature: improving our understanding of public perceptions of the role of biodiversity in cities.
If you think about wildlife in a city, which area of the city do you think should have the most wildlife? If you think about wildlife in a city, in which area of the city do you think most wild plants should live. I can easily place myself in the place of the suffering polluted beaches of Santa Monica, California.
I can easily put myself in the place of the banks of the polluted rivers in Lethbridge.