30 Table 4 Summary of each tested application regarding positive and negative SUS responses. Both photos and videos are difficult to view due to the small screen size (Rawassizadeh, Price, & Petre, 2015). Additionally, users who have a mobile app with smartwatch integration mostly choose to use the mobile version of the app as they find that there is too much redundancy in the smartwatch version (Fortmann, Heuten, & Boll, 2015).
Bench Tracker collects the g-force generated by 3-dimensional movements of the Apple Watch along the x, y, z axis using the Apple Watch's accelerometer. These values are used to determine the speed of vertical movement of the user's wrists during the exercise. The goal of the app is to create actionable insights for users by allowing them to better understand their lifts and giving them access to resources to analyze their bench press exercises and ultimately improve the effectiveness of their weight training.
Participants in this study were given an Apple iPhone and Apple Watch for the duration of the study. Bench Tracker monitors and tracks the user's bench press velocity using the accelerometer built into the Apple Watch. In addition, data points are summarized even in the paid version of the application so that the user cannot get a visualization of how the summary was formed.
Both interactions are completed on the same main screen of the Apple Watch application and require no additional gestures or in-app navigation. To start the application, users use the watch's crown to select what weight they are lifting, followed by pressing the Start button to follow the bench press exercise, as shown in Figure 4. They can then select the exercise they want to view, which loads a screen with a brief summary of the comparable metrics, including average g-forces generated and average bench press speed in m/s.
The y-axis, as shown in Figure 5, is the number of g-forces applied during the user's bench press, and the x-axis is the time the force was exerted. The Digital Communications Division of the US Department of Health and Human Services summarized the benefits of SUS based on more than 1,300 publications (Affairs, 2013). Based on these findings and the extensive research conducted to confirm the validity of the test.
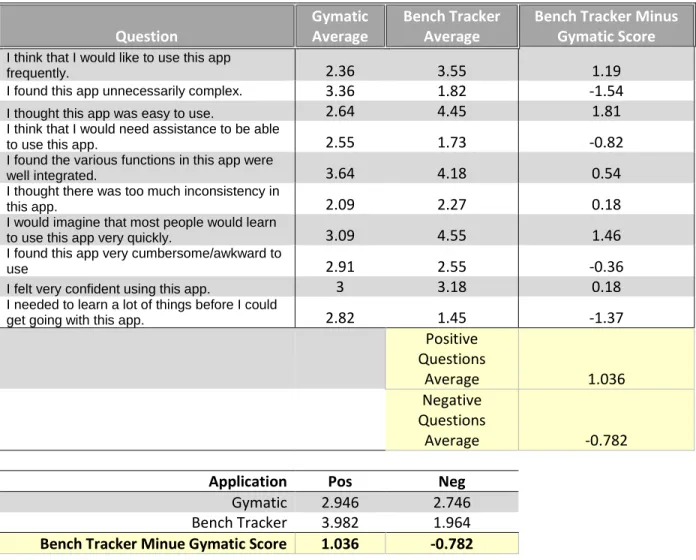
The actual participant responses can be determined using Table 4 Summary of each of the Applications tested regarding SUS positive and negative responses. Converting the data to this form enabled a better understanding of how much better or worse users found aspects of the app. To visually understand the SUS results, Figure 6 demonstrates that Bench Tracker preformed Gymatic on all the negative SUS questions except question 6.
For additional support and analysis of SUS data, the data in Table 1 Gymatic SUS Results and Table 2 Bench Tracker SUS Results are summarized in Figure 6 Bench Tracker and Gymatic Average SUS Visual Comparison.
Average SUS Question Results
This indicated that participants liked Bench Tracker better because it had better usability overall, and it also indicated that they would prefer to use the application more often. Agree” to positive questions regarding the SUS survey for the Bench Tracker application and. Furthermore, on average, participants responded to the negative questions with “Disagree” for the Bench Tracker application and “Undecided” for the Gymatic application.
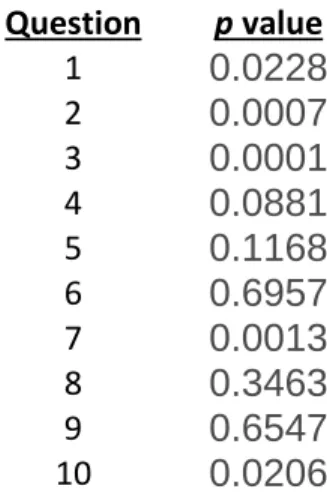
This further supports the claim that by simplifying applications, users will use the application more often. Table 3. This is especially important because question 1 states: “I think I would use this app more often”, question 2 states: “I think this application was unnecessarily complex” and question 3 states “I liked this application easy to use". This also showed that participants had difficulty using the application, which ties in positively with Gymatic's lower score on the SUS question that asked participants if they thought the application was easy to use.
It was also noted that the Bench Tracker application styling could be improved as it "didn't feel modern". Users, on the other hand, find these portable applications not as useful as their mobile desktop counterparts and often choose to use the mobile application over the portable one (Lyons, 2016). The smartwatch application created, Bench Tracker, gave users practical insight by allowing them to track their bench press exercises in a way that optimized usability.
This was supported by SUS surveys which showed participants scoring Bench Tracker a score of 75.2 and Gymatic a score of 52.5. Study participants also reported that they would use Bench Tracker more often than Gymatic. Additionally, there would be benefit from examining long-term user trends based on the Bench Tracker.
A long-term comparative study between Bench Tracker and Gymatic would be useful to gain more insight into how usability affects the long-term use of the app. For example, exploring the effects of additional health features such as heart rate monitoring while maintaining a simplified, easy-to-use design could provide useful insights. If you volunteer to participate in this study, you will receive an Apple Watch that must be synchronized with the iPhone you currently use on a daily basis.
The research findings that will be discovered in this study do not serve any purpose. If you voluntarily participate in this study, you can withdraw at any time without any consequences.