That the MVRD board receives for information the report dated 22 February 2021 entitled "Metro 2050 Phase 1 Engagement Report". That the MVRD board receives for information the report dated 19 February 2021 entitled "Social Equity and Regional Growth Study".
OTHER BUSINESS
MVRD Board Committee Information Items and Delegation Summaries It was MOVED and SECONDED
RESOLUTION TO CLOSE MEETING It was MOVED and SECONDED
RISE AND REPORT (Items Released from Closed Meeting) No items presented
ADJOURNMENT/CONCLUSION It was MOVED and SECONDED
Minutes of the special joint meeting of the MVRD, MVHC, GVWD and GVS&DD board held on Thursday 8 April 2021 Page 1 of 4 SPECIAL JOINT MEETING. Minutes of the special joint meeting of the Metro Vancouver Regional District (MVRD), Metro Vancouver Housing Corporation (MVHC), Greater Vancouver Water District (GVWD) and Greater Vancouver Sewerage and Drainage District (GVS&DD) Board of Directors held on 1:03 p.m.
Section B 2
ADOPTION OF THE AGENDA It was MOVED and SECONDED
- Board Budget Workshop
Dean Rear, Chief Financial Officer/General Manager, Financial Services, provided members with an overview of the financial planning environment and the budget deliverables, including the continuous improvements to the financial policies, financial reporting, project management and continuous improvements at departmental level. Minutes of the Special Joint Meeting of the MVRD, MVHC, GVWD and GVS&DD Board held on Thursday, 8 April 2021 Page 3 of 4.
ADJOURNMENT OR CONCLUSION
Section E 1.1
Delta Nature Reserve and Delta South Surrey Greenway – Public Engagement and Management Plan Regional Parks Committee Regular Meeting Date: 7 April 2021 Page 2 of 4. Delta Nature Reserve and Delta South Surrey Greenway – Public Engagement and Management Plan Regional Parks Committee Date of regular meeting: April 7, 2021 Page 4 of 4.
Delta Nature Reserve + Delta South Surrey Greenway
Background Report
EXECUTIVE SUMMARY
CONTENTS
INTRODUCTION
Metro Vancouver transferred fifty percent DNR ownership from the City of Delta in July 2020. Background of DNR and DSSG | 2 This background report provides an overview of DNR, DSSG and BBECA lands east of the 91 Freeway.
CULTURAL HERITAGE
PARK MANAGEMENT
Burns Bog Management Plan
Conservation Covenants
RAMSAR Designation
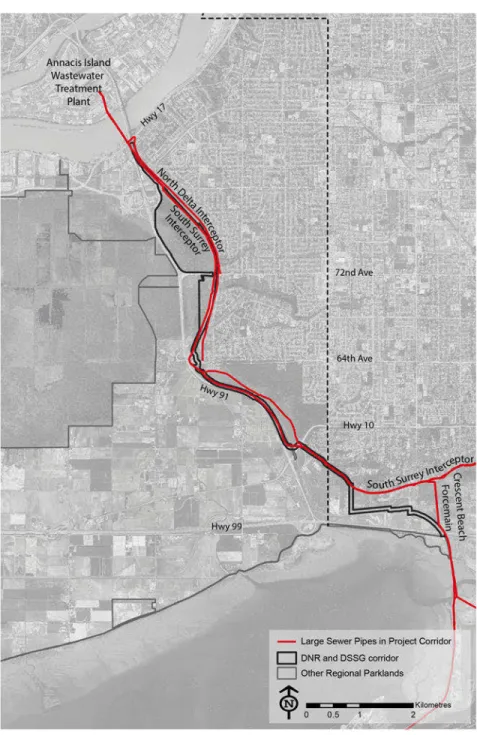
DSSG Coordination with Liquid Waste Services
Zoning
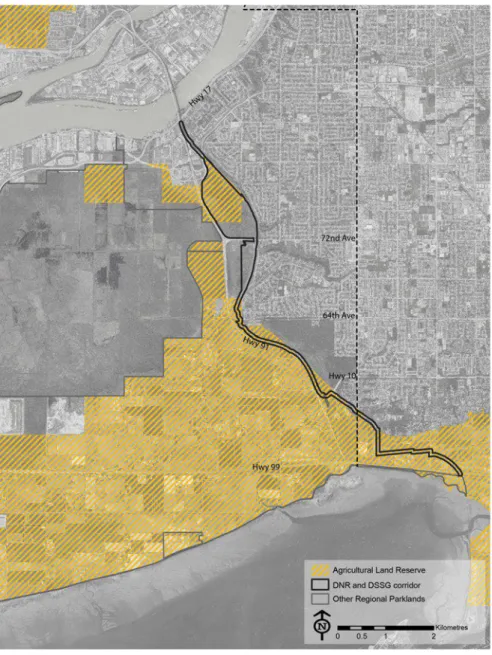
The DNR is within the Agricultural Land Reserve (ALR); portions of the DSSG are also within the ALR (see figure 3). As part of the planning process, the Agricultural Land Commission, which oversees the ALR, will be consulted regarding obtaining any permits or approvals.
BIOPHYSICAL SUMMARY
Topography
DNR and DSSG Background | 64th Avenue 8 varies from approximately 2m to 6m in height with gentle slopes and a peak of up to 11m. South of 64th Avenue, the DSSG elevation varies from approximately 1 to 9 meters with gentle slopes, except where it rises abruptly to an overpass at a height of approximately 12 meters to cross over a railway line.
Burns Bog Hydrology
The path descends to a height of about 1 meter in the southernmost part (City of Delta, n.d.) (City of Surrey, n.d.).
DNR and DSSG Hydrology
Northeast Interceptor Canal Flooding
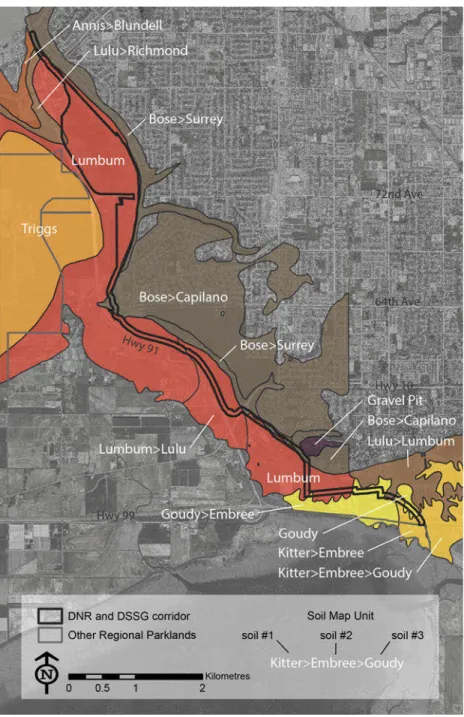
Soil name Soil material Drainage Organic soil GOUDY Up to 53 cm of organic material over silt. Poorly drained, moderately permeable KITTER Silt Loam soil; fluvial material Poorly drained SURREY Sandy Loam with up to 8cm top layer of.
Vegetation
CAPILANO A thin layer of up to 8 cm of organic soil, over 27 to 42 cm of coarse sand, over very gravelly sand; fluvial material; quickly permeable. Small young forest patches that do not meet the criteria for sensitive or altered ecosystems represent an additional 13% of the project area.
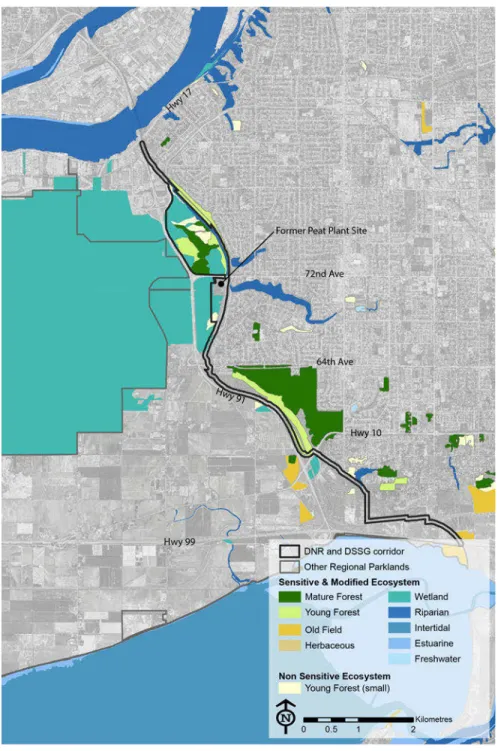
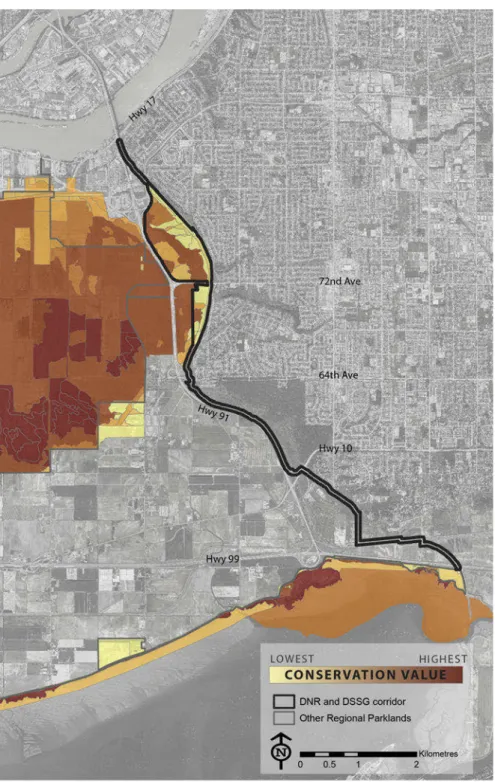
Conservation Value Mapping
These areas have a high potential for wildlife diversity and provide links between wetland and mountain habitats (Hebda, 2000). In the DNR alone, over 91 bird species have been documented in the past 10 years (Cornell Lab of Ornithology, n.d.).
Fish
The sheer size of Burns Bog and the diversity of habitats within the bog make it home to an abundance and diversity of wildlife, including 175 species of birds, 41 species of mammals, 11 species of amphibians, six species of reptiles and approximately 4,000 invertebrates. species (Metro Vancouver, 2007).
Ecosystems and Species at Risk
DNR and BBECA lands are also home to the red-legged frog, a provincial blue-listed species (Hebda, 2000).
Invasive Species
SITE ANALYSIS SUMMARY
Community Context The 2016 Census counted 2.46
As the region and surrounding communities continue to grow, so does park visitation and demand. The COVID-19 pandemic led to larger increases in park visitation than in any previous year since park visitation has been monitored.
Delta South Surrey Greenway Visitation
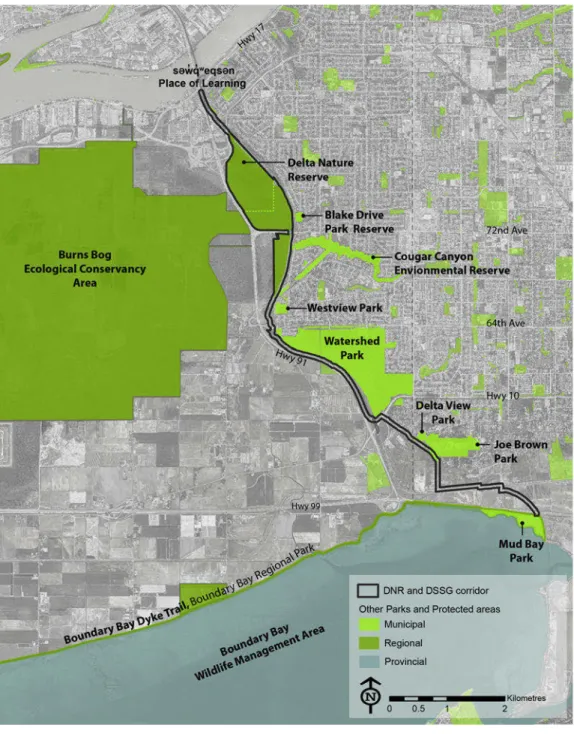
The planning process for DNR and DSSG should consider options to connect adjacent protected areas, parks, and greenways along the DSSG corridor. Adjacent conservation areas and parks adjacent to the DSSG include the səw̓q̓ʷeqsən Place of Learning and Recognition Area on the Fraser River; City of Delta Parks (Blake Drive Park Reserve, Cougar Canyon Environmental Reserve, Westview Park and Watershed Park); and City of Surrey Parks (Deltaview Park, Joe Brown Park and Mud Bay Park).
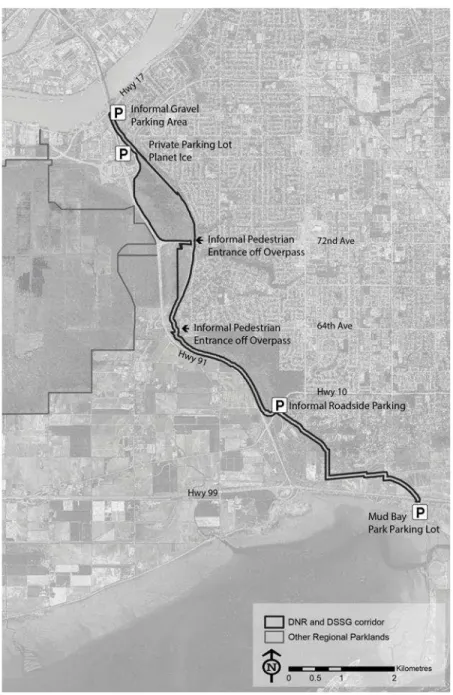
Access
Although there are no recorded archaeological sites in these areas, there is a possibility that archaeological sites may be found based on the past occupation of these areas and the presence of several archaeological sites nearby. Archaeological work will be required as part of park planning and site design and will be done in consultation with local First Nations.
Existing Amenities Boardwalk and Educational Signage
The proposed DSSG extension from 64th north to DNR is currently a service road with varying surfaces. There are also toilets upstream from DSSG in nearby municipal parks along the corridor.
DSSG Property Interests
Most of the operational part of the DSSG has a macadam surface, with a short asphalted green section along the shared road. There are few restrooms along the DSSG and the only washroom is the restroom at Mud Bay Park.
DSSG Corridor Landscapes
WORKS CITED
Extract from BC Invasive Alien Plant Program Map Display: https://maps.gov.bc.ca/ess/hm/iapp/.
Phase 1 Engagement Methods and Timing
Subject: Metro 2050 Draft Policy Language – Goal 3: Protect the Environment and Respond to Climate Change Impacts and Implementation Section. That the MVRD Board receives for information the report dated March 26, 2021 entitled "Metro 2050 Draft Policy Language - Objective 3: Protecting the Environment and Responding to Climate Change Impacts and the Implementation Section".
Section E 2.1
ATTACHMENT
Section D Regional Land Use Designations and Overlays (GOAL 3 CONTENT ONLY) (Metro 2040 p9/10)
Proposed Metro 2050 Text Rationale for Change
Goal: 3 Protect the Environment and Respond to Climate Change and Natural Hazards
PREAMBLE (p33)
ATTACHMENT 3
Goal: 3
SENSITIVE ECOSYSTEMS
New policy added in line with recommendation 6 of the Policy Review on Climate Change and Natural Hazards. New policy added in line with recommendation 5 of the Policy Review on Climate Change and Natural Hazards.
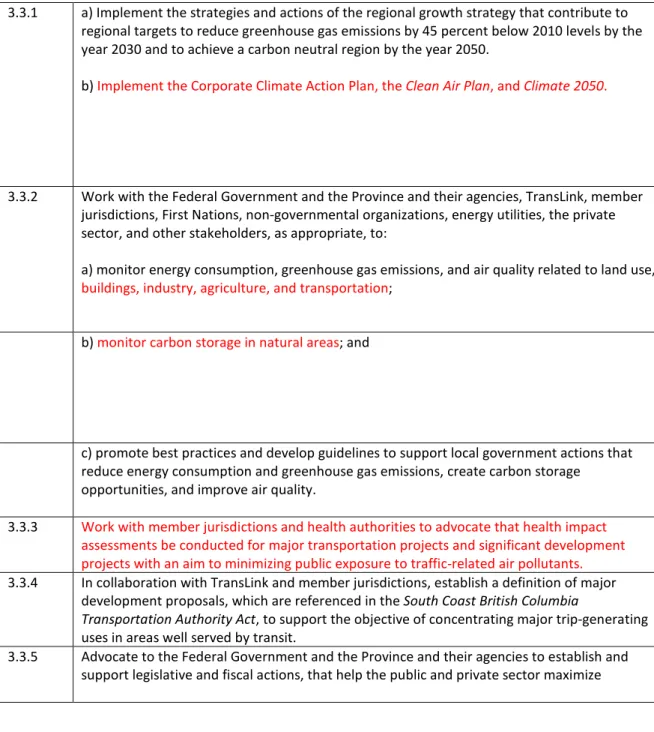
Implementation Section (p57-64)
- Regional Growth Strategy Implementation Framework .1 Metro Vancouver and affected local governments will
- Regional Context Statements
- Categories of Regional Growth Strategy Amendments
- Amendments to the Regional Growth Strategy (acceptance by all affected local governments required)
- Amendments to the Regional Growth Strategy (two-thirds weighted vote) 6.3.3 The following amendments require an affirmative two-
- Amendments to the Regional Growth Strategy (simple majority weighted vote) 6.3.4 The following amendments require an affirmative 50% +
- Procedures for Regional Growth Strategy Amendments Who Can Apply for an Amendment
- Coordination with First Nations
- Coordination with TransLink
- Coordination with Other Governments and Agencies
- Coordination with Metro Vancouver / Greater Vancouver Boards .1 All bylaws adopted and all works and services undertaken by
- Sewerage Area Extensions
- Special Study Areas
- Jurisdiction
- Regional Growth Strategy Maps
- Tables, Figures and Performance Measures
- Interpretation
- Implementation Guidelines
Changing a regional land use designation within a particular study area is considered a type 3 amendment under section 6.3.4 of the regional growth strategy. The maps included in the regional growth strategy are small-scale depictions of the official regional land use definition maps and are for convenience purposes only.
Section E 2.2
The Metro 2040 Projections Policy Review was intended to update the population, housing unit and employment projections for Metro Vancouver's member jurisdictions and consolidate them for inclusion in Metro 2050. Based on a five-month consultation and review process with staff of member jurisdictions, Metro Vancouver Staff has provided updated preliminary population, housing unit and employment projections.
ATTACHMENT
The Regional Industrial Land Inventory 2020 provides a comprehensive and current overview of the quantity and quality of industrial land in the region as of mid-2020. Provide the Regional Industrial Land Inventory 2020 for information to the Regional Planning Committee and the MVRD Board (Appendix ).
Section E 2.3
That the MVRD Board receive for information the report dated March 25, 2021 entitled "Metro Vancouver 2020 Regional Industrial Lands Inventory" and provide alternative guidance to staff. Metro Vancouver completed the 2020 Regional Industrial Lands Inventory as an update to the 2015 Inventory to document the current supply and use of industrial and associated lands in the region.
Metro Vancouver 2020 Regional Industrial
Technical Report
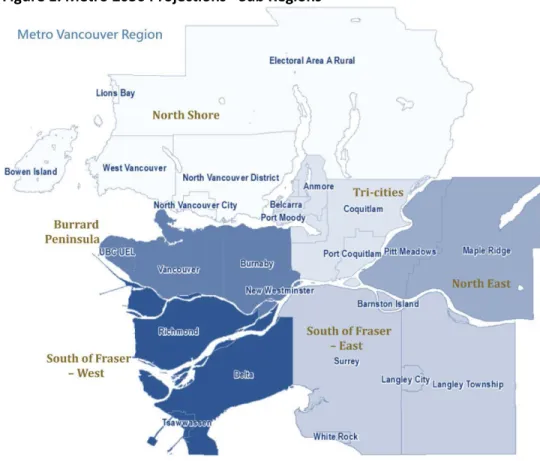
Geographic Sub-Regions
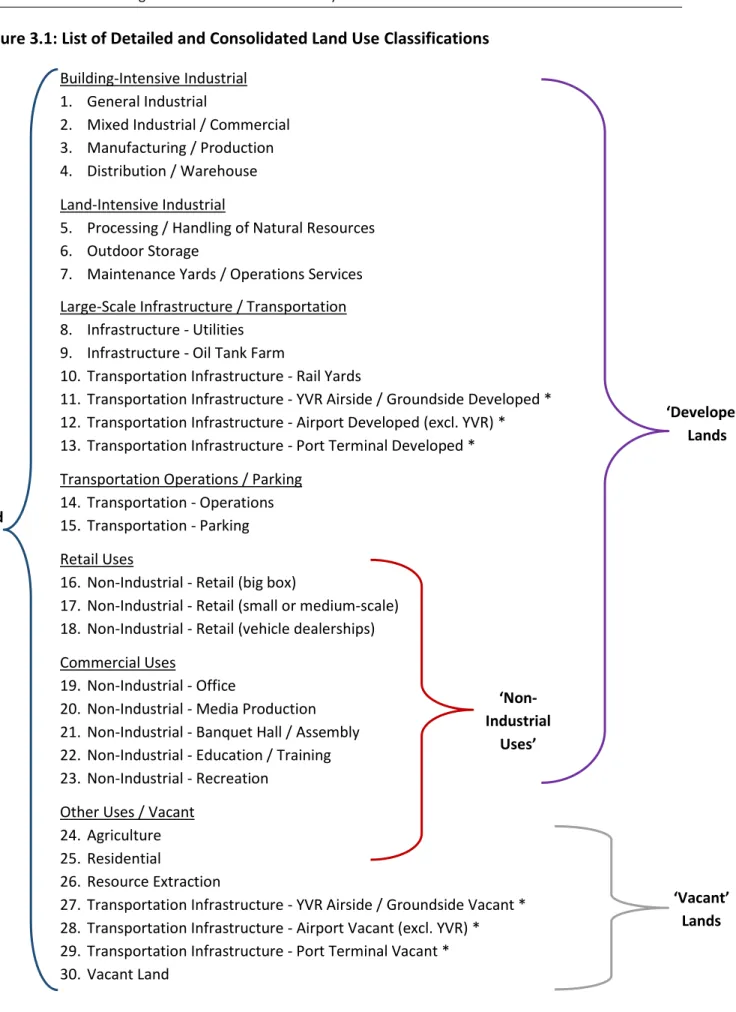
On the following page is the list of 30 land use classifications for the 2020 census (full definitions are in Appendix 9) which provide a detailed and nuanced understanding of the supply of industrial land. Water bodies have no land use classification and are not included in the inventory.
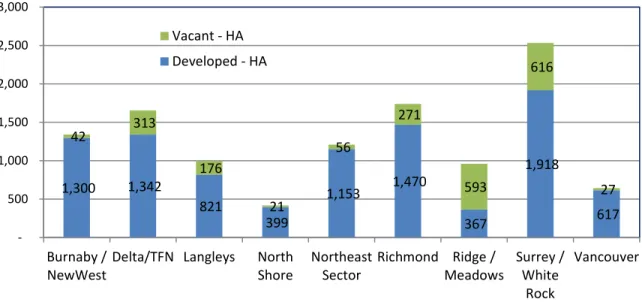
The following table shows the distribution of 'developed' and 'other/unoccupied' land by sub-region. The largest areas of 'Other/Vacant' land can be found in southeast Surrey (Campbell Heights), northeast Maple Ridge, and Tsawwassen First Nation lands (at Roberts Bank Terminal), as well as some large sites in the Delta.
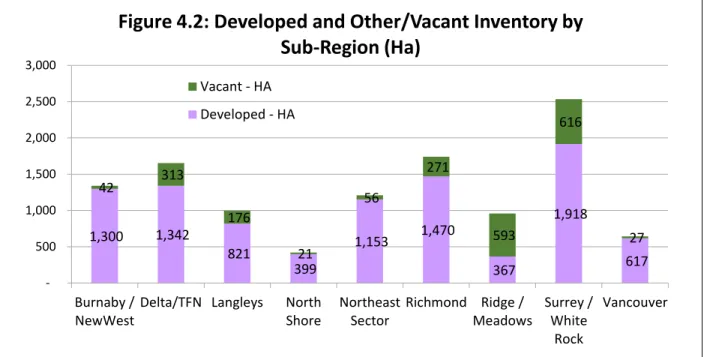
Inventory by Developed and Vacant Status
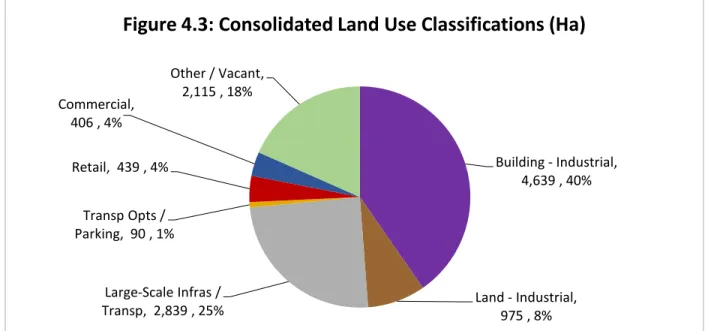
Inventory lands are classified into 7 land use categories as shown in the following figure and table by subregion. The following two maps show the detailed and consolidated land use classifications for the region respectively.
Inventory by Detailed Type of Land Use (30 Classifications)
Inventory by Consolidated Type of Land Use (7 Classifications)
Conversely, as shown in the following table, a higher proportion of retail, commercial and transport activities/parking were located in industrial areas in urban centres. A higher proportion of industrial sites in the City of Vancouver were located in urban centers (ie, the major metro core).
Inventory within Regional Urban Centres
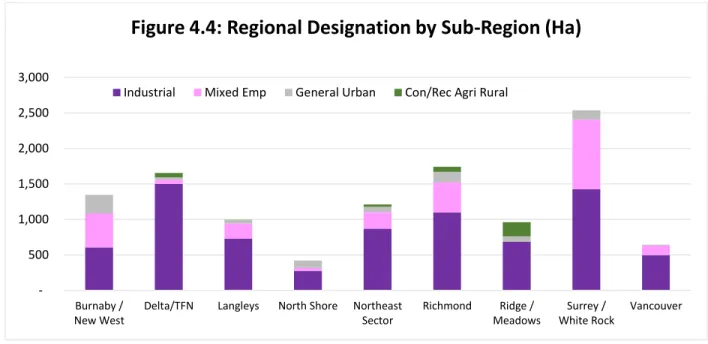
The countries with the greatest level of land designation policy are shown in dark purple, while the areas in pink and orange are earmarked for, or more likely to be converted to, other uses. RGS General Urban, OCP No RGS General Urban, OCP Yes RGS Mixed Emp, OCP No RGS Mixed Emp, OCP Yes RGS Industrial, OCP No RGS Industrial, OCP Yes.

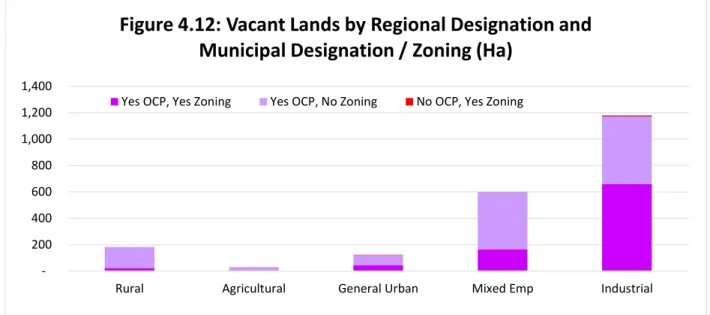
Inventory Level of Policy Protection
Specifically for the "Other/Vacant" component of the inventory (2,115 ha), 56% was regionally designated as "Industrial" and 28% as "Mixed Employment". 71% of the land in the Inventory was privately owned, with another 4% owned by railroads.
Inventory by Land Ownership Type
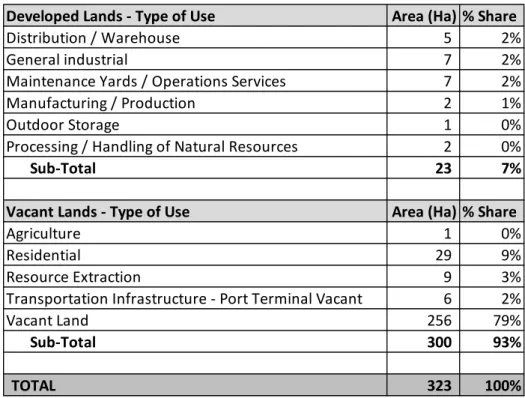
YVR and Port Lands by Consolidated Type of Land Use
Consolidated Land Use Classification (Ha)
Inventory by Tenure
The distribution of site size also varies by regional designation and land use classification, as shown in the figures below. Majority (28%) of Transport - Operations of the region in the Northeast sector (Coquitlam, Port Coquitlam, Port Moody) - 1,209 ha.

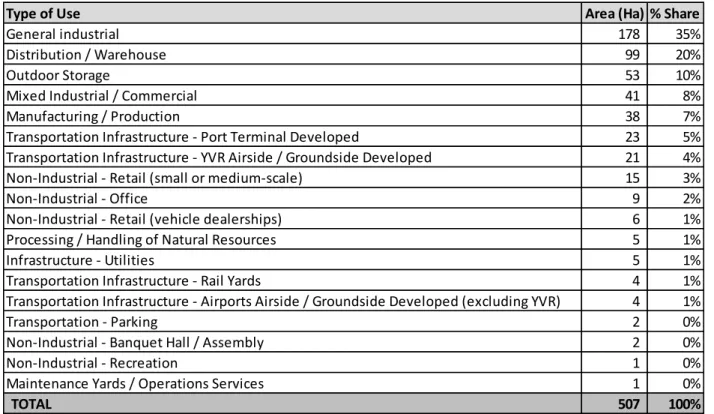
Developed Inventory by Detailed Type of Land Use (18 Classifications)
Inventory with Retail or Office Land Use
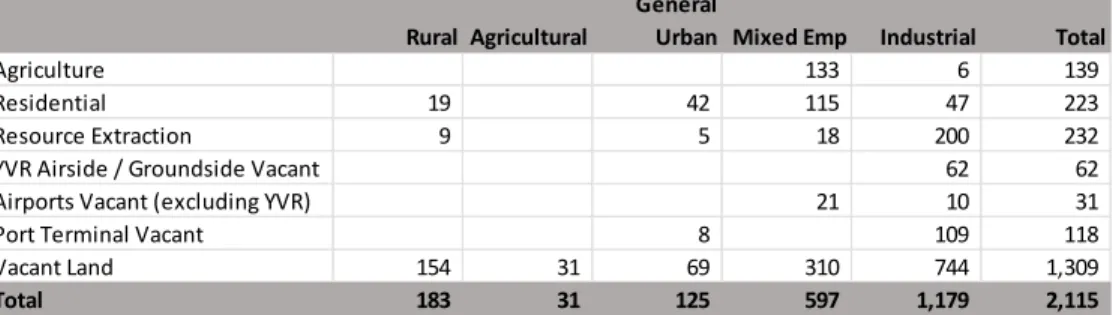
This section documents the 'Other/Detached' lands of the Inventory, which constitute 18% of the Inventory or 2,115 ha. Other/vacant lands included six land use categories: 62% were completely fallow, 11% 'resource extraction', 10% 'residential' and 7% 'agricultural', as shown in the figure.

Other/Vacant Inventory by Detailed Type of Land Use (6 Classifications)
For 'Other / Vacant' areas (2,115 ha) the following figure shows the size distribution according to regional designation. The following figure shows the distribution of 'Other / Vacant' lands by sub-region by area size.
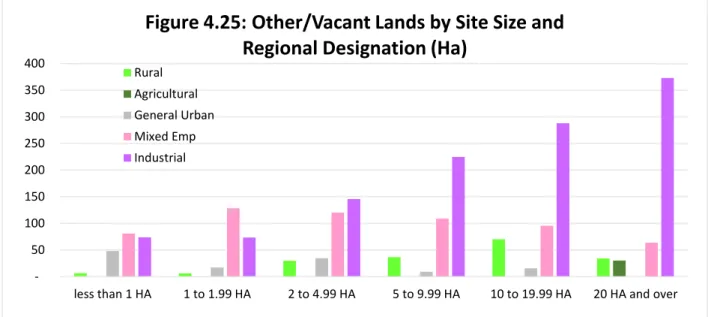
Other/Vacant Inventory by Site Size Range
Notable additions to the inventory occurred in parts of Burnaby (Still Creek), New Westminster (Queensborough), Surrey (Campbell Heights) and Langley Township (Willoughby). The following map shows the additions (in green) and removals (in red) to the inventory lands between 2015 and 2020.
Inventory Lands Added and Removed Between 2015 and 2020
Gross countries that changed from 'Developed' status to 'Other / Vacant' status over the same period. Land added to and removed from the Stock (both 'Other / Vacant' and 'Developed') over the same period.
Inventory Lands Absorption Between 2015 and 2020
Thus, not all industrial areas are usable or accessible to all types of industrial users. Redevelopment and intensification is also an important way to extend the life of the limited supply of industrial land in the region.
Sub-Regional Inventory Maps