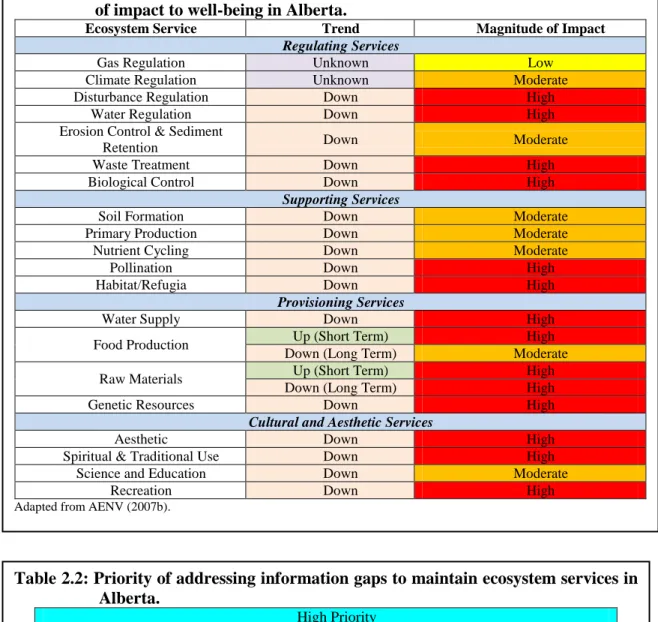
A renewal and Water for life: Action Plan Page 22 Table 3.1 Classification of ecosystem services in the Millennium Assessment Page 27 Table 3.2 Revealed and stated preference non-market ES. The decline in ecosystem health in Alberta and elsewhere stems from past management decisions that do not recognize the link between IFNs, ecosystem health and provision of ES benefits (AENV, 2007b; MA, 2005; Wenig et al., 2006).
Problem description
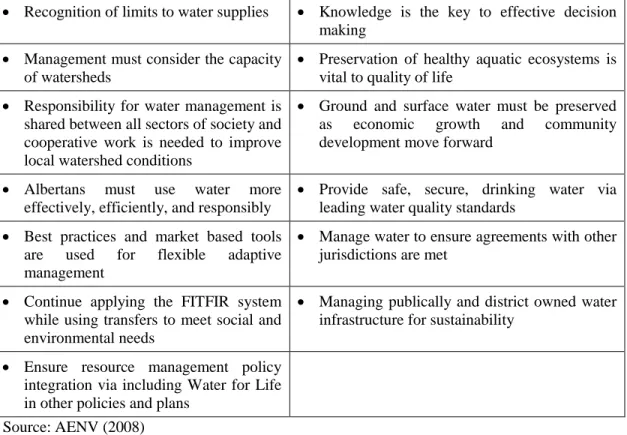
A key policy direction within both the WFL strategy and LUF is to use market-style mechanisms to reallocate water to higher value uses while maintaining IFNs (Alberta, 2008; AENV, 2008a, 2003; Kerr & Bjornlund, 2010). Market-style transfers have so far been sparse in Alberta and not for ES provision (Nicol et al., 2008).
Objectives and scope
The appreciation of other ES (waste assimilation, habitat provision, etc.) provided by the Reservoir is beyond the scope of this study. This study does not include the value of recreational ES benefits provided by the Reservoir to Town residents.
Thesis organization
Recreational benefits of activities that take place outside the reservoir, such as indoor recreation, are beyond the scope of this study. This chapter provides the broad contextual background on water management, irrigation, and ecosystem services (ES) in Alberta.
Water resources and ecosystem services in Alberta
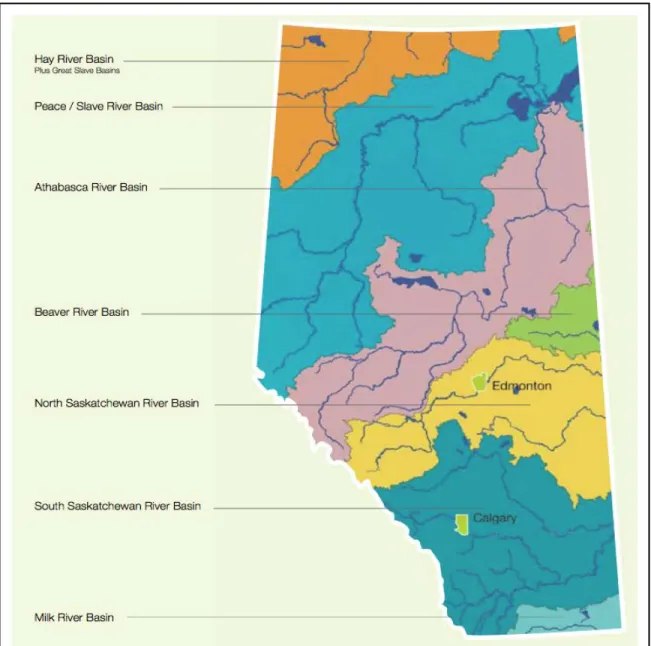
This study focuses on the Lake Chestermere reservoir located in the South Saskatchewan River Basin (SSRB). The SSRB Plan Study reported the status of aquatic ecosystems in rivers using the categories of unchanged/restored, moderately impaired, severely impaired, and degraded.
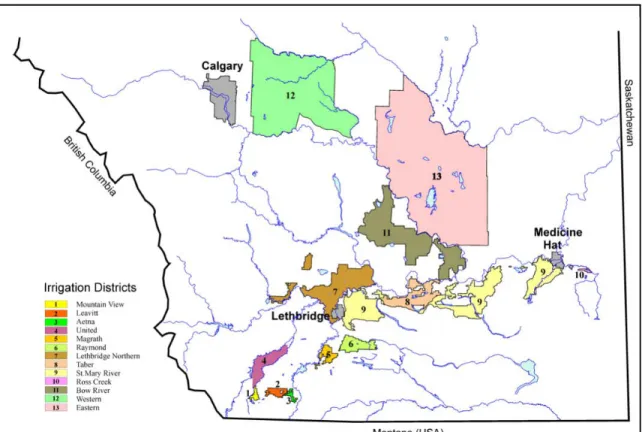
Irrigation in Alberta
The districts are farmer-run member-based cooperatives that have taken over administration and maintenance of irrigation infrastructure from the private corporations with the help of the federal and provincial governments (IWMSC, 2002). The Government of Alberta continued to work with the irrigation districts in maintaining and expanding irrigation infrastructure.
Conflict over water in southern Alberta
Inter-basin transfers, however, need the approval of the provincial environment ministry (Water Act, 2000, s. 81), which was not available due to considerable resistance from the inhabitants of the Rooihert sub-basin (Beveridge, 2008;. The WID membership has a plebiscite held as required by the Irrigation Districts Act (2000, s. 11), which narrowly passed despite the financial benefits for the WID and its members (FFWD, 2007; D'Aliesio, 2007b).
Water legislation in Alberta
Dennis spearheaded the change in the regulation of water in the prairies by reviewing the legislative options based on the experience of water legislation from the United States and Australia (Goodman, 2005; . IWMSC, 2002; Percy. Several changes to the Water Resources Act (1931) were undertaken over time in response to emerging water supply and environmental problems (Percy, 1996).
Water and land policy in Alberta
Transfer participants reported a lack of information on water prices for different uses as one of the barriers to participation (Nicol et al., 2008; Nicol, 2005). Other barriers included the length of time and cost associated with the transfer approval process, and the prospect of the government withholding 10% of the allocation (Nicol et al., 2008).
Summary and Conclusion
These trades were in the same irrigation region or district and none involved transfers for ES maintenance (Nicol et al., 2008; Nicol, 2005). Research shows limited support for the use of water trading and market-based instruments in the irrigation sector (Bjornlund et al., 2007).
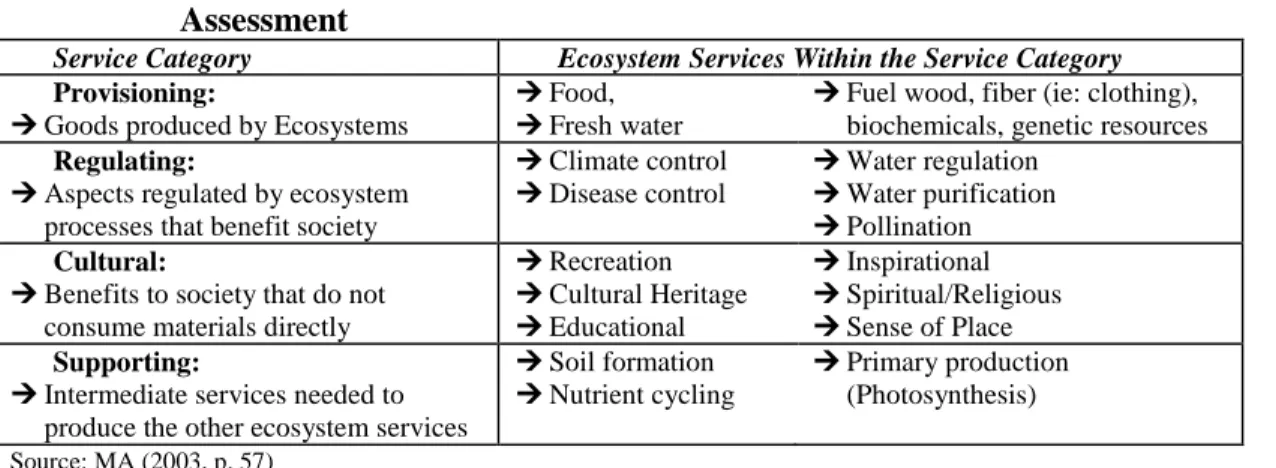
Conceptualization of ecosystem services
There has been a significant increase in literature over the past two decades regarding the economic valuation of ecosystem services (ES) benefits (Adamowicz, 2004; Fisher et al., 2008; Gomez-Baggethun et al., 2010; Vihervaara et al., 2010). The MA classifications have shown limitations when applied to problems with a more economic context, prompting calls for improvements in ES definitions and classifications (Boyd. & Banzhaf, 2007; Fisher et al., 2009; Wallace, 2007).
Economics of recreational ecosystem service benefits
The revealed preference (RP) methods use historical expenditure data (cost data) to “reveal” the individual's utility in dollar values by applying Eq. The Hedonic Price Method (HPM) is an RP method that estimates the utility of a place (place) by WTP for access to the place (Turner et al., 2008; Young, 2005).

Geography of ecosystem service benefits
The card asks for the date, number of people in the hiking group, start and end point of the hike and home address including postcode (Baerenklau et al., 2010). A DEM map of values was created showing that land parcels with higher elevations had a greater recreational value (Baerenklau et al., 2010). This approach allowed the value of ES benefits to be visible rather than just a number (Baerenklau et al., 2010).
Recreational ecosystem services benefits from reservoirs
Results from the formal interviews revealed that a low number of people expressed a WTP more for camping (Moeller et al., 1980). The informal interviews revealed that about half expressed a WTP more for camping (Moeller et al., 1980). Debate over the methods of Moeller et al.'s (1980) study emerged with differing opinions on the collection of information without informed consent (Christensen, 1980; LePage, 1981).
Summary and Conclusion
For the formal interview, researchers identified themselves as researchers (graduate students) and conducted the survey with the respondent aware that they were being interviewed for an academic study (Moeller et al., 1980). The authors conclude that using formal and informal interviews (surveys) together shows potential to improve data quality and accuracy (Moeller et al., 1980). The few studies of recreation value that apply the mixed method approach have found improved results compared to single approaches (McNaughton, 1993; Moeller et al., 1980).
Study site and case study organizations
Two case studies are included as part of the estimation of the value of recreational ES benefits provided by the Reservoir. The recreational benefits that the Reservoir provides to the Camp and KJK are expected to be significant. The camp and CYC are located in the town and have direct access to the reservoir.

Qualitative framework
The CYC was founded in 1933 and is the oldest established group on the Reservoir (CYC, 2011a). The CYC completed a new clubhouse in 2011 to increase the space available for social events as the CYC grows (CYC Staff). The CYC also plans to rent the clubhouse to outside groups as a way to increase revenue (CYC, 2012a; CYC Staff.
Quantitative framework 1. Assumptions
The trip is to the Reservoir only (single site) and not a multi-destination trip Day trip recreationalists face higher opportunity cost of time due to the shorter and fixed
Travel to and from Chestermere is by the fastest and shortest possible route Travelling between a day trip recreationalist’s home and the destination is generally a cost
Travel to and from Chestermere is done using private vehicles
People who use the Camp or CYC programs and services do not participate in recreation on the Reservoir as general public users
Camp users located east of the camp only use the day program and users located west of the camp only use the overnight program
All estimated CYC members originating from outside the Town of Chestermere are from Calgary
The availability of Calgary zip code data from daily use survey respondents (Appendix A) allows driving cost estimates to be made if all non-resident CYC users are assumed to originate in Calgary. 7) Rated non-resident CYC members make five trips during the period when the water level in Chestermere Reservoir is elevated.
Estimated non-resident CYC members take five trips during the period when the water level in the Chestermere Reservoir is raised
The estimated non-resident members of the CYC purchased a individual membership and not a family membership
Expected Outcomes
For example, Boxall et al., (1996) reported a negative relationship between income and recreational participation for multi-day camping trips, while Chizinski et al., (2005) found a positive relationship for day fishing. The recreational participation and travel frequency of non-resident recreational users of the reservoir are expected to be income dependent, following Chizinski et al. 2005), as the Reservoir is a day-use recreational area and offers a variety of recreational activities attractive to different income groups. Previous studies indicate a significant positive or negative relationship between recreational participation and employment status (Boxall et al., 1996; Mallett & McGuckin, 2000; McFarlane & Boxall, 1998).

Data Collection
An example is estimating missing water strokes for Sundays during the high water period. Similar observations were made for the John Peake Park section during the high versus low water period. During the low tide period, the non-resident weekday recreational share is 15% of the daily number of counter hits, and the weekend non-resident share is 30%.

Estimation models
TVDay = (Daily Total of Non-Resident Counters) • AVCi (4.3) The estimate of the value of recreational ES benefits for public non-residents (RVPublic) is found by adding the values for each day of the week. The average expected travel time to reach the reservoirs in southern Alberta (daily and multi-day use) is approximately 56 km (McNaughton, 1993). The time it takes to cover a one-way 56 km round trip is less than two hours. The opportunity cost of time is calculated by dividing the median of the reported income category from the survey by 52 to obtain the weekly income.
Case studies
The average annual income from the 2006 Census (StatsCan, 2010) is used instead of individual income information to calculate (µc) for users of the camp and CYC. Some of the zip codes located west of the camp are potentially close enough to use the day program. All zip codes west of the camp that are within the 15-minute travel time zone are included in the day camp group (East).
Summary and conclusion
The vehicle counting units recorded the number of vehicles passing through the tubes near recreational areas in the city every day for 12 months. Gaps in vehicle count data are resolved using linear trend regression or count ratios from other counters. The camp and CYC models used census and survey data in their calculations because no information was available.
Introduction
Qualitative findings
- Events hosted by the Town of Chestermere
- Camp Chestermere
- Calgary Yacht Club
The Canada Day attendance estimate is rough due to open access to the event (Town of Chestermere Staff. As noted in the previous chapter, the camp derives great value from its location with direct access to the reservoir (Camp Chestermere Staff. The camp benefits from a healthy demand for its facilities, demonstrating the value of the recreational ES benefits that the reservoir provides to the camp.
Quantitative findings
- Use of the public boat launch facility in the Town of Chestermere
A map of the service area of the spatial extent of recreational EC benefits provided by the reservoir is presented in Figure 5.6. This finding is reasonable as many of the recreational opportunities offered by the reservoir are dependent on the reservoir's water level rising, particularly summer activities that require boat launches. On-site observations showed that temperature on a given day and day of the week clearly affected the number of launches by non-resident boats.
Summary and conclusion
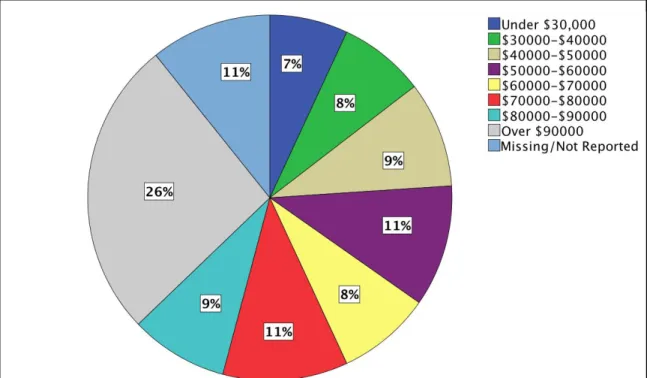
The average annual income of the estimated non-resident KJC members was $41,303 based on 2006 Census income data. The finding for the average annual income for non-resident KJK members is likely an underestimate of the true average income. A more realistic average annual income for a non-resident KJK member is likely to be closer to that of the public survey in the range.
Study summary
The portions were aggregated with average travel cost data from the survey to arrive at the estimated annual value of recreational ES benefits provided by the Reservoir to non-resident public visitors. The additional qualitative information shows that the quantitative finding for the value of recreational ES benefits provided by the Reservoir is a lower bound estimate. The estimated value of recreational ES benefits provided to the camp by the Reservoir was found to vary from year to year depending on the vehicle operating costs used in calculations.
Discussion of findings
The finding for the dependence of the number of trips per year on income met expectations. The finding for the dependence of the number of trips per year and participation in recreational activities on employment status was not met. The finding for the dependence on the number of trips per year and the level of education is met.

Study implications
- Methodological implications
- Practical and policy implications
The finding for the total annual value of recreational ES services provided by the Reservoir is generally in line with previous studies (Table 6.1). Obtaining information about the value of ES benefits has been identified as a key policy action in the WFL strategy and LUF (AENV, 2008a, 2003; Alberta, 2008). The results of this study can inform water transfer participants about the potential value of recreational ES benefits from reservoirs, or guide the development of their own studies to obtain information to negotiate prices.
Limitations and recommended future research
URL: http://www.ffwdweekly.com/article/news-views/news/balzac-mega-mall-high-and-dry/.