However, it is not common for robots to be able to detect the direction of incoming radiation and locate local radiation sources from a single survey point. However, current robots are unable to locate radiation sources over a wide field of view from a single survey point.
Theoretical Background
Radiation Sources
Alternatively, in some isotopes a proton can be converted into a neutron and a positron is ejected from the nucleus (beta plus radiation: β+) [18]. Indeed, both gamma and x-ray photons are ubiquitous in spent nuclear fuel, nuclear reactor core material, and other components that may be present in a nuclear accident[19].
Gamma Ray Interaction with Matter
I(x) describes the intensity of the gamma ray beam as a function of the distance traveled through the material, x. So the instantaneous attenuation of the ray dI as it travels a distance dx is given by:.
Gamma Ray Energy Spectra
Thus, heavier elements with a high atomic number and large mass density will attenuate gamma radiation more than lighter elements. The wavy arrows represent the gamma rays that are emitted as the nucleus is de-excited from an excited energy state to a lower energy state.
Gamma Ray Detectors
- Overview of Gamma Ray Detectors
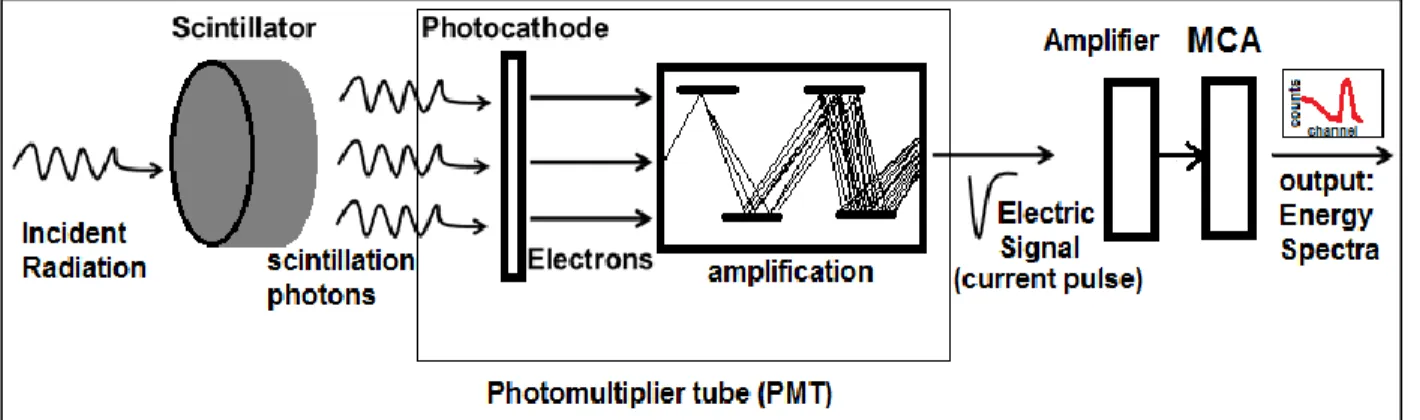
- Scintillation Detectors
The radiation interacts and transfers energy to the electrons of the scintillating material inside the detector. Characteristic x-rays from the material can reach the detector and be measured as an "x-ray peak" shown in the spectra.
Lanthanum Bromide Scintillation Detector
This intrinsic natural radiation, measured with LaBr3 detectors, contributes significantly to background radiation measurements [1]. This spectrum shows the peaks you will measure with the LaBr3 detector, even if no gamma sources are present.
![Figure 4: 60,000 second background spectra with LaBr 3 detector [1]. This spectrum shows peaks that you will measure with a LaBr 3 detector, even if no gamma sources are present](https://thumb-us.123doks.com/thumbv2/9docorg/12452896.0/28.918.109.846.576.969/figure-background-spectra-detector-spectrum-measure-detector-sources.webp)
Directional Sensitivity of Cylindrical Scintillation Detectors
The point source is confined to a position in the x,y plane outside the detector as shown in Figure 5. The program was used to measure the total counting efficiency of the detector while a point source was measured 2 m away from the center of .
![Figure 5 : Three dimensional configuration of detector and point gamma source model [23]](https://thumb-us.123doks.com/thumbv2/9docorg/12452896.0/30.918.221.685.106.435/figure-dimensional-configuration-detector-point-gamma-source-model.webp)
Point Source Triangulation
The angle of the source direction relative to the robot is shown in Figure 8 as θs1. The best approximate solution for the position of the point source can be obtained using the ordinary least squares method.

Methodology
Directional Gamma Ray Measurement Method
The internal efficiency of the detector will decrease for each path that passes the xlead distance through the lead sheath. Where xlead(φ,θ) is the path length through the guide collimator of the gamma rays going towards the detector at horizontal angle θ and azimuthal angle φ.
Description of the Prototype Design
Sweep Scan Mode with count rate measurements: This is used to scan an aircraft with the robot's detector to measure the direction of local gamma ray sources as well as record a visual panorama of the area (see section 2.4). Autonomous source search mode: This is used to search the local area for gamma ray sources in the area around the robot (see section 2.7). The robot is directly maneuvered by a human operator from a wireless controller pad shown in Figure 14.
The secondary directional joystick on the controller makes it possible to rotate the robot's radiation detector and change the direction of the gamma ray measurement or the direction of view of the mounted camera. Pressing the cross button instructs the robot to take a panoramic measurement in 180o forward direction (sweep scan mode). Pressing the select button on the controller instructs the robot to start the autonomous source search mode.

Gamma Ray Detection System
- LaBr 3 Scintillator Detector
- Digital Gamma Ray Measurement: Count Rate Measurements
- Energy Spectra Measurements
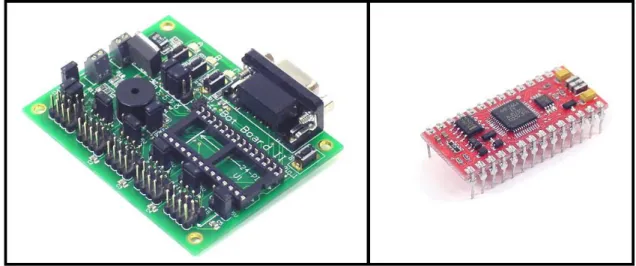
The analog output signal from the photomultiplier tube is fed directly to the analog input Pin AX0 of Botboard 2 (shown in Figure 13). The value is stored on the atomic processor as a 16-bit integer that can be accessed by the robot's software. This is a measurement of the total current produced in the detector's PMT during the measurement interval, so it only counts the total number of incoming gamma rays.
When the robot performs a sweep scan, the detector is set in a specific direction and a measurement is taken. The signal from the LaBr3 detector is recorded as a 16 bit word and the angle is stored as a 10 bit integer. The LaBr3 detector on our prototype mobile robot is connected to one of the four input channels of the DAQ and a laptop computer with the IgorPro software package is used to record energy spectra.
Sweep Scan Measurements: Count Rate Mode
The software program includes a graphical user interface (GUI) for controlling and adjusting the energy spectra acquisition parameters. The detector and camera are rotated to the left side of the robot in an adjustable number of steps. After the scan is complete, the detector and camera will turn to the gamma ray point source.
Radiation Data Visual Overlay
Sweep Scan Measurements with MCA for Energy Spectra
- Directional Profiles with Energy Spectra
- Rapid Scan Directional Profiles with Energy Spectra
This provides accurate scanning resolution in all directions close to the point source and eliminates the need to perform many measurements in directions far away from the source. In the example shown in Figure 16, the area of interest will be at 90o, as the source is closest to that direction.
Autonomous Source Seek Mode Operation
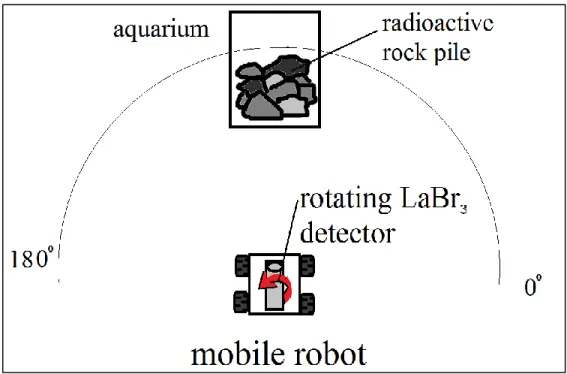
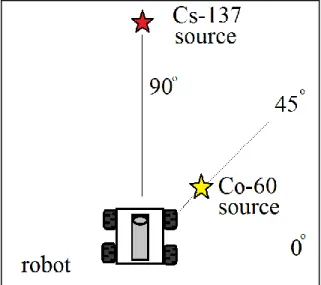
A photo of the robot performing a sweeping scan in one of these experiments is shown in Figure 22. The source staff was placed vertically at the (50 cm, 50 cm) position of the coordinate system. At each position, the direction of the gamma source was determined by the robot using the sweep scan mode described in Section 2.4.
A video of the source search mode was recorded from the detector-mounted camera on the robot. At each position, the direction of the gamma source was determined by the robot as described in section 2.4. The steps in the source search mode sequence are indicated on each of the images.

Experimental Setup
- Equipment and Gamma Ray Sources
- Directional Profile and Visual Panorama – Sweep Scan Mode with Count Rate
- Directional profile and Visual Panorama – Sweep Scan Mode with Energy Spectra
- Rapid Scan Directional Profile and Visual Panorama with Energy Spectra
- Point Source Triangulation Experiments
- Autonomous Source Seek Mode
Experimental Results and Discussion
Directional Profile and Visual Panorama Results: Sweep Scan Mode with Count Rate
- Gamma Ray Directional Profile Results
- Visual Overlay Results
- Point Source Directional Localization Results
- Multiple Point Source Results
- Directional Profile Results with Natural Distributed Mixed Alpha, Beta and Gamma Source . 82
In each case, the peak of the gamma ray profile data clearly indicates where the radioactive source was located. At the end of each scan, the robot aimed the camera to indicate the approximate direction of the gamma source. This is because the absolute maximum of the directional profile peak was used as the estimated source direction in the robot's software.
These directions correspond very well to the boundaries of the rock pile as seen from the robot's perspective. At the end of the sweep scan, the robot turned the detector to the center of the direction of the highest measured gamma-ray intensity in the camera's field of view. The direction profile data for the energies corresponding to 137Cs and 60Co were extracted from Figure 50 and superimposed on top of the visual panorama obtained by the robot camera and the result is shown in Figure 52.

Rapid Scan Directional Profile Results with Energy Spectra
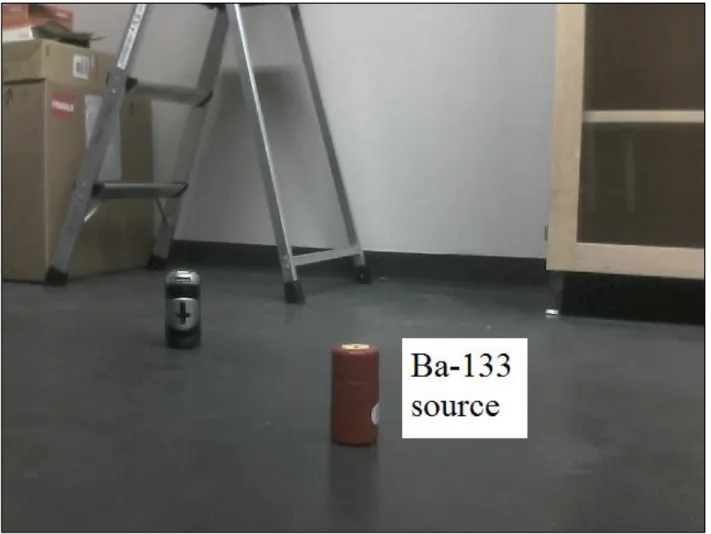
- Rapid Scan Directional Profile Results with 133 Ba
- Rapid Scan Directional Profile Results with 60 Co
The gamma-ray direction profile from the 356 keV energy channel was extracted from the data in Figure 55 and overlaid on top of the visual panorama captured by the camera. From the top of the directional profile, the location of the source was estimated to be 75o. The robot's camera position closest to the estimated direction from the top is shown in Figure 57.
The camera position in Figure 57 corresponds to 76.5o and the figure shows that the center of the source corresponds very well to this position. The large number of counts in energies from 200 keV to 1.0 MeV is a result of Compton scattering of the 60Co gamma rays (see Figure 3). The 2D frequency data from this scan is shown in Appendix C (Figure A6) and the smoothed data is shown in Figure 59.

Point Source Triangulation
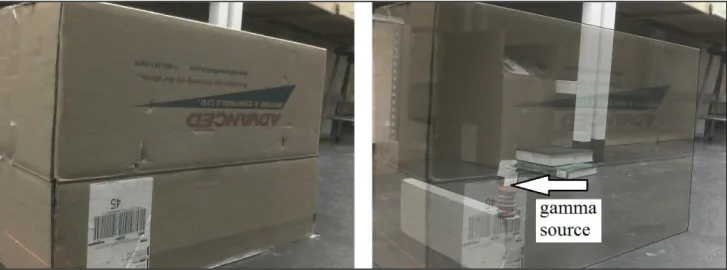
The perimeter of the box is marked on the floor and the position of the source is marked with a red "star". Compared to the size of the box, the position of the source was estimated with a high degree of accuracy. The region containing 500 of the 1000 estimated source position measurements provided an estimate of the 50% confidence interval and the region containing 900 of the 1000 source position measurements provided an estimate of the 90%.
The 50% confidence interval estimate of the source position is indicated by a smaller oval shape around the estimated source position, and the larger oval indicates the 90% confidence interval. The true source position is close to the 50% confidence interval and within the 90% confidence interval. See Section 3.6.3 for an analytical estimate of the uncertainty in the estimated point source location.

Autonomous Source Seek Mode Results
- Source Seek Mode Results
- Source Seek Mode Results with Hidden Source
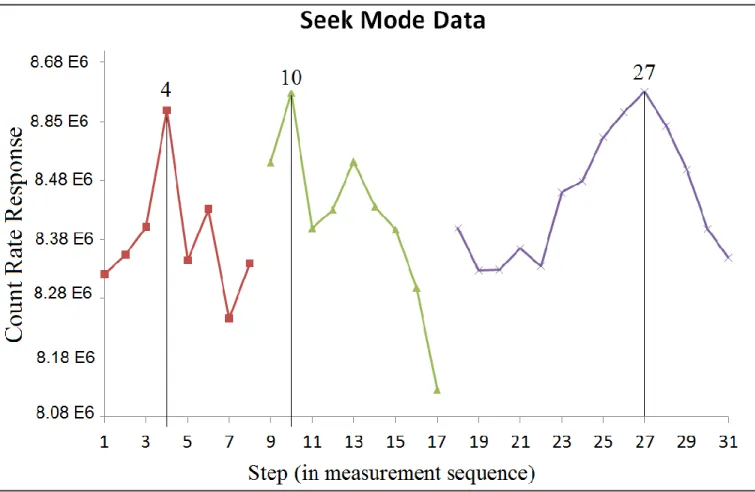
The smaller oval is the area where the source is estimated to be located with a measurement confidence of 50%. The first 8 data points represent the detector signal measurements in the 360° rotation phase of the source search mode (see Figure 17). The data from the last sweep scan in Figure 67 produces a peak similar to the peaks discussed in Section 3.1.1, with the maximum corresponding to the location of the source.
When the scan was completed, the robot turned its detector in the direction of the source measured in step 27. The robot was placed in a random position and orientation at a distance of about 1.5 m away from the source, and the source search mode was activated. This means that the source has been found to be near the edge of the box in the corner of the room.
Discussion of Uncertainty and Measurement Error
- Uncertainty in Sweep Scan Mode with Count Rate Measurements
- Uncertainty in Sweep Scan Mode with Energy Spectra
- Uncertainty in Point Source Triangulation
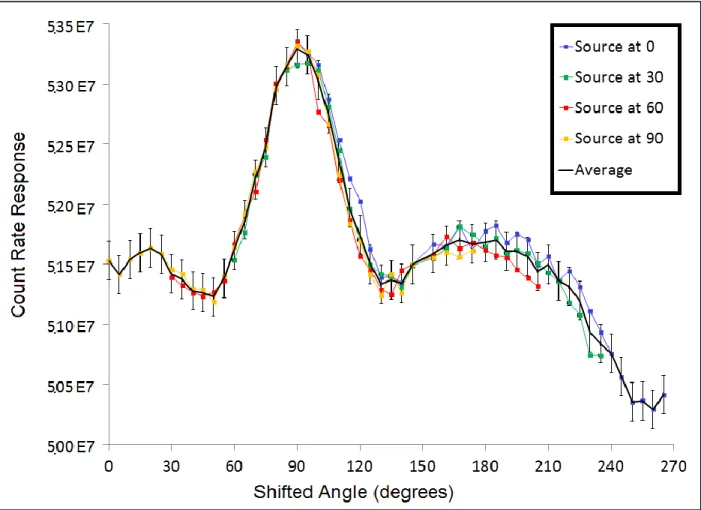
A statistical standard deviation of the count rate measurements was calculated and added to the graph as error bars (vertical lines). Equation (21) was used to estimate the uncertainty of the slopes calculated in the point source triangulation experiment (from sections 2.8.5 and 3.4) based on the measured source angles, θs. Performing a 180o sweep scan with the prototype produced a gamma ray directional profile where a point radiation source was indicated by a measurable count rate peak recorded by the detection system.
The 180o rotation limit of the detector in the prototype also limited the gamma ray direction profiles and visual data overlaps in the forward direction of the robot. The second most limiting aspect of the prototype was the inability to construct gamma-ray direction profiles and real-time panoramic visual overlays due to the limited capabilities of the control system. This would allow immediate identification of the direction and isotope of the multiple gamma-ray sources around the robot.