This procedure consists of replacing the defective articular cartilage surface and its subchondral bone with inert materials of similar biomechanical properties. The use of cell therapies to repair joint function represents a more elegant solution to articular cartilage damage.
Cartilage Tissue Engineering
Disadvantages associated with these techniques often lead to the need for secondary procedures, which increases the cost and time required for therapeutic treatment, opening the need for a more innovative solution. By studying the cell cycle, the process by which cells reproduce, we could elucidate some of the mechanisms by which this growth enhancement occurs.
Cell Cycle Synchronization
Research Objectives
Literature Review
Articular Cartilage Tissue
- Anatomy and Physiology
- Extracellular Matrix
- Chondrocytes
- Growth Factors
It is characterized by the presence of large collagen fibers and contains most of the proteoglycan content found in the tissue [29]. Catabolic pathways of chondrocyte metabolism are common in the regular function of the tissue as remodeling occurs in the ECM [61].
![Figure 2-1: A) Schematic of zonal arrangement of chondrocytes within articular cartilage tissue B) Schematic diagram of zonal arrangement of collagen within articular cartilage tissue [1]](https://thumb-us.123doks.com/thumbv2/9docorg/12436040.0/17.918.121.816.643.923/schematic-arrangement-chondrocytes-articular-cartilage-schematic-arrangement-articular.webp)
Articular Cartilage Damage
Cartilage Tissue Engineering
- Cells
- Scaffolds
- Signals
In the case of cartilage tissue engineering, hydrogel scaffolds are used due to their ability to immobilize the cells while providing appropriate mechanical properties to allow continued expansion of the cells in vitro prior to implantation [98]. Polymerization of alginate beads in the presence of calcium ions in solution allows cell populations embedded in the alginate mixture to be grown in vitro in three-dimensional scaffolds without the presence of any toxicity-causing chemicals [111].
Cell Cycle
- G 0 Phase
- G 1 Phase
- S Phase
- G 2 Phase
- M Phase
- Synchronization
- Characterization
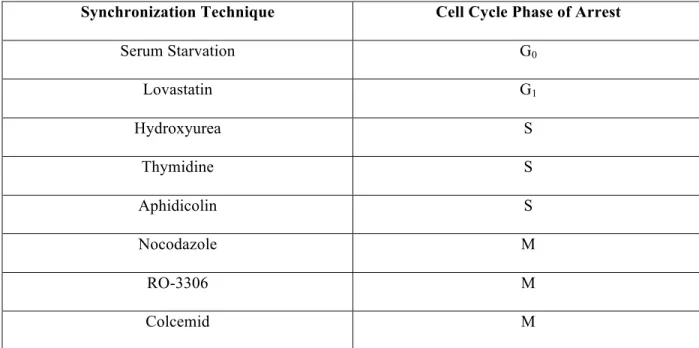
Replication of the deoxyribonucleic acid (DNA) that forms the chromosomes is restricted to a distinct part of interphase, leading to a classification of four different cell cycle division phases (M, G1, S and G2,) [126] . Serum starvation is a less efficient method to arrest cells in the G0 phase of the cell cycle [195, 196].
![Figure 2-2: Schematic diagram of cell cycle phases and respective cyclin expression in each phase [126]](https://thumb-us.123doks.com/thumbv2/9docorg/12436040.0/30.918.167.749.139.648/figure-schematic-diagram-cycle-phases-respective-cyclin-expression.webp)
Methods
- Culturing Populations of Synchronized Primary Articular Chondrocytes
- Articular Cartilage Tissue Harvest
- Synchronization of Tissue In Situ
- Hydrogel Immobilization
- Agarose Cylinders
- Alginate Cylinders
- Alginate Beads
- Recovery
- Three-Dimensional Construct Culture
- Analysis of Constructs at 2 and 4 Weeks
- Characterization of Cell Cycle using Flow Cytometry
- Histological Evaluation
- Safranin Oxide Staining
- Sirius Red Staining
- Immunohistochemical Evaluation
- Collagen I and II staining
- Biochemical Evaluation
- Water content
- DNA content
- Hydroxyproline Assay for Collagen Content
- DMMB Assay for Sulfated GAG Content
By tracking DNA content of individual cells in the population at short interval time points (12 hours) after the synchronization protocol, the cell cycle characteristics of the population could be analyzed and used to determine the optimal method of synchronization. This method of synchronization involves first digesting the cells in a 0.5% w/v protease in Ham's F12 solution, followed by a wash with Ham's F12 media and a subsequent incubation of the explants in the absence of fetal bovine serum for a period of 12 hours (coupled with the enzymatic digestion of tissue with 0.15% w/v collagenase A in Ham's F12). The double thymidine block was chosen as the synchronization method, for which time points were selectively changed for optimization of the cell cycle synchronization process.
This first block of thymidine treatment was followed by aspiration of the thymidine medium and a wash in Ham's F12 media and finally an 8 hour release in F12 media. In a polypropylene FACS tube protected from light, 10 µL of the dye was added to cells suspended in 1X PBS to a final concentration of 5 µM. Staining was performed by first permeabilizing the cells using 100 µL of a 10% Triton-x100 solution to allow permeation of the staining solution.
Two rinses in 1% acetic acid were performed on the sections followed by a short wash (1 minute) under tap water and dehydration of the slides in successive washes of 95% ethanol, 100% ethanol, and xylene. Taking into account dilution factors and volumes of digested sample allowed an accurate estimation of the mass of DNA in each sample.
Results
Effect of Cell Cycle Synchronization Treatments on Primary Articular Chondrocytes
- Viability of Synchronization in Primary Articular Chondrocytes
- Viability of Encapsulation in Primary Articular Chondrocytes
- Tracking Cell Cycle Progression of Chondrocytes
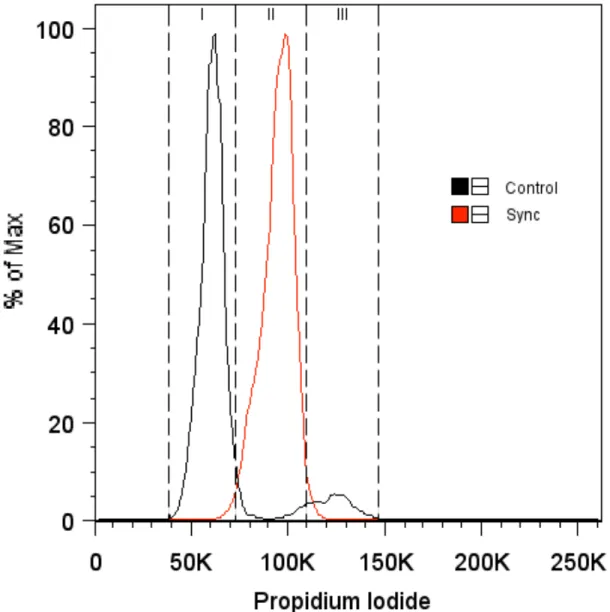
Cell cycle phase analysis of populations from which constructs were seeded was performed in FlowJo software by sample fixation and propidium iodide staining. Through standard principles of flow cytometry, the cell cycle phase of the control and synchronized populations is shown in Figure 4-1. Expression of diploid nuclei in G0/G1 phase was confined around a normally distributed control peak centered at 62,500, with a width of 30,000 on the emitted light intensity scale in propidium iodide emission spectra (653-675).
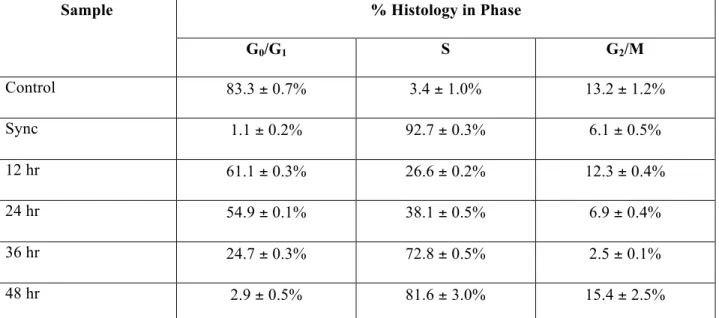
The range of the synthesis phase gate was drawn between the two, and included cells containing between one and two complete sets of DNA. There was a demonstrable shift of most of the population towards the occluded region for S phase in terms of DNA content when subjected to the modified double thymidine block protocol. To assess the quality and longevity of the synchronization process, cell populations were assessed at 12-hour intervals for 48 hours after treatment.
Cells were obtained by encapsulation via calcium chelation of alginate constructs and subjected to the same propidium iodide staining protocol. Cell cycle phase tracking was determined in Table 4-4, which gives the percentage of cells found in each cell cycle phase.
Effects of Optimized Synchronization on Chondrogenesis
- Effect of Optimized Synchronization on DNA Content
- Effect of Optimized Synchronization on Proteoglycan Content
- Effect of Optimized Synchronization on Collagen Content
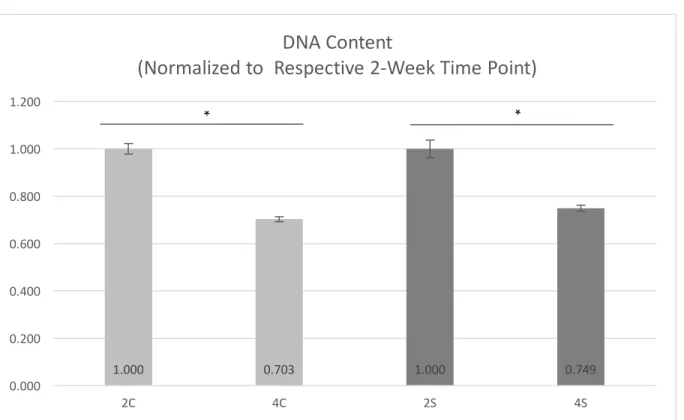
For both control and synchronized populations, 4-week samples that were normalized to their respective 2-week time point exhibited a significant decrease in DNA. In terms of sulfated glycosaminoglycan content, the synchronized group showed no significant increase compared to controls at the 2-week time point. At the 4-week time point, the synchronized sample had accumulated significantly more sulfated glycosaminoglycan molecules compared to the control group (P < 0.05).
A measure of the change in this ratio over time was shown by normalizing the 4-week synchronized and control groups to their respective 2-week time points, as shown in Figure 4-8. At the 4-week time point, when normalized to 4-week controls, the synchronized group exhibited a. A comparison of the collagen/DNA ratio in the 4-week synchronized and control groups compared to their respective 2-week time points is shown above in Figure 4-13.
A measure of the change in this ratio over time was shown by normalizing the 4-week synchronized and control groups to their respective 2-week time points, as shown in Figure 4-15. A comparison of the collagen/GAG ratio in the 4-week synchronized and control groups compared to their 2-week time points is shown above in Figure 4-15.
Discussion
General Discussion
- Overview of Research
- Optimizing Synchronization in Primary Articular Chondrocytes
- Encapsulation for Three-Dimensional Culture and Maintaining Phenotype
- Effects of Synchronization on Growth of Articular Cartilage Tissue
The presence of glycosaminoglycans in the territorial and interterritorial matrix of tissue sections was evident from safranin oxide staining, as shown in Figure 4-9. Intense collagen staining in the territorial and interterritorial matrix was observed in tissue sections stained with Sirius Red dye, as shown in Figure 4-16. Under the stimulus of cell cycle synchronization via an optimized double thymidine block, constructs populated with primary articular chondrocytes had significantly higher DNA content (21%) compared to controls, indicating an increase in the number of cells in the synchronized constructs compared to controls.
Thus, the population doublings that would occur during each synchronous cell cycle progression would generate more chondrocytes in synchronized constructs compared to controls. However, no significant difference in the ratio of GAG mass to DNA mass was found for synchronized constructs compared to controls at two weeks in culture and four weeks in culture. Unlike DNA mass in the constructs, GAG mass was found to increase between the 2-week and 4-week time points for the same groups (43% for synchronized constructs and 29% for controls).
At the four-week time point, a 33% increase in the collagen/DNA ratio was found, suggesting that increased collagen synthesis is not simply the result of an increased number of cells in the synchronized constructs. These data are consistent with the sections photographed with Sirius Red, which demonstrated a marked increase in the amount of collagen found in the territorial matrix of the chondrocytes.
Synchronization Mechanisms and Improved Growth .1 Proliferative Effects of a Cell Cycle Synchronized
- Growth Factor Signaling in a Synchronized Population
Synchronization of in vitro cultures has been shown to alter the duration of certain phases of the cell cycle and consequently the total length of time required for division [227]. This paracrine signaling of cells already progressing through the cell cycle would be responsible for some of the proliferative and anabolic enhancements detected in the synchronized group compared to controls, which were generally quiescent during the first 48 h in culture. This supports the idea that transient, cell cycle-dependent expression of this growth factor plays a role in regulating chondrocyte entry into the cell cycle and promoting matrix synthesis.
The resulting degradation of the cell cycle progression inhibitor p27 likely enhances the sustained progression of synchronized cells through the cell cycle, leading to increased cell number and enhanced anabolic activity. In addition to the continued progression of the synchronous population through the cell cycle, enhanced proteoglycan synthesis can also be attributed to IGF-I stimulation in the culture system. Studies of the effects of TGF-β on subsequent cyclin and cyclin-dependent kinase expression would elucidate the transient effects of this growth factor on the cell cycle.
By presence in serum administered in media at each feeding cycle in addition to endogenous expression of these synthesized growth factors by chondrocytes in culture, it is postulated that TGF-B played a key role in the continued proliferation and matrix synthesis of the synchronized group being compared. Differential expression of the growth factors throughout the cell cycle has been demonstrated, and the subsequent local concentration increases of endogenously expressed growth factors represent the most likely cause of the accelerated synthesis in synchronized groups.
Conclusions and Recommendations 6.1 Conclusions
Encapsulation of Primary Articular Chondrocytes
While the encapsulation of cells in cylindrical constructs allowed for mechanical testing of the synthesized cartilage, there were drawbacks to this approach. Conversely, the agarose hydrogel constructs retained their shape well, but did not allow for a high yield of encapsulate recovery. Even with the use of enzymatic digestion of agarose, the temperatures required to dissolve these constructs in a reasonable time frame damaged the DNA of the cells, thus affecting the flow cytometric analysis of cell cycle phase needed to determine how long populations would remain synchronized in that cultural model.
Optimizing Synchronization in Primary Articular Chondrocytes
Effects of Synchronization on Matrix Synthesis in Long- Term Culture
Recommendations
- Culture System for Articular Chondrocytes
- Utilizing Synchronization to Promote Growth in Human Chondrocytes
- Mechanisms that Promote Growth in Synchronized Chondrocytes
Regulation of G1 cell cycle progression: distinguishing the restriction point from a nutrient-sensing cell growth checkpoint. Regulation of tubulin synthesis during the cell cycle in the synchronous plasmodia of physarum polycephalum. Serum starvation and full confluence for cell cycle synchronization of domestic cat (felis catus) fetal fibroblasts.
Effects of cell cycle regulators on cell cycle synchronization of porcine induced pluripotent stem cells. Synchronization of the circadian clock of the cell cycle in zebrafish occurs through an entrainment mechanism rather than a period phase-locking process. Stromal-Derived Connective Tissue Growth Factor Maintains Cell Cycle Progression and Repopulating Activity of Hematopoietic Stem Cells In Vitro.
Connective tissue growth factor and regulation of the mesangial cell cycle: role in cellular hypertrophy. Insulin-like growth factor-1 promotes cell cycle progression through upregulation of cyclin D1 expression through the phosphatidylinositol 3-kinase/nuclear κB signaling pathway in FRTL thyroid cells.
![Figure 2-3: Characterization of the phases of mitosis in a eukaryotic cell [139].](https://thumb-us.123doks.com/thumbv2/9docorg/12436040.0/34.918.110.830.111.778/figure-2-characterization-phases-mitosis-eukaryotic-cell-139.webp)