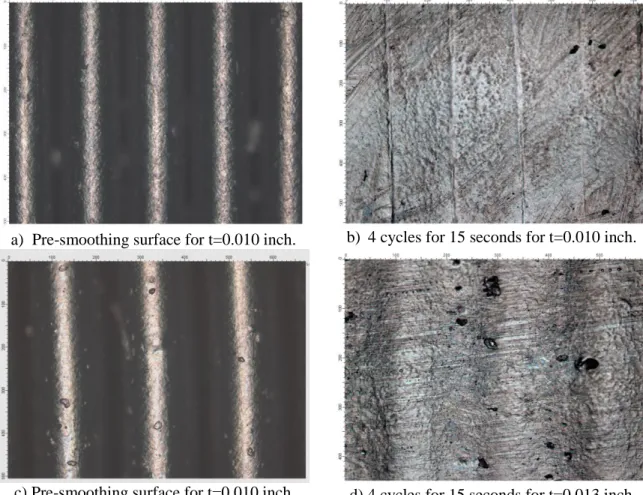
58 Figure 3-4 The results of the surface 3D digitizer and the surface mounted on the points from a sample with 60 degrees. 79 Figure 4-6 3D roughness evaluation of the finished surfaces before and after finishing with 4 cycles of 15 seconds each and 0.013 inch layer thickness.
INTRODUCTION
Motivation: poor surface integrity of AM parts
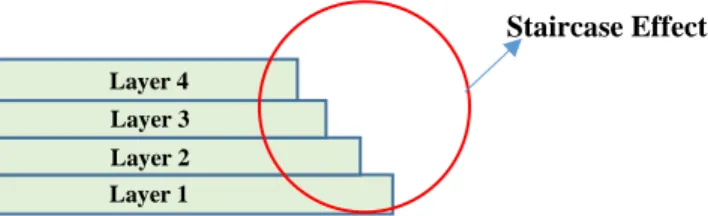
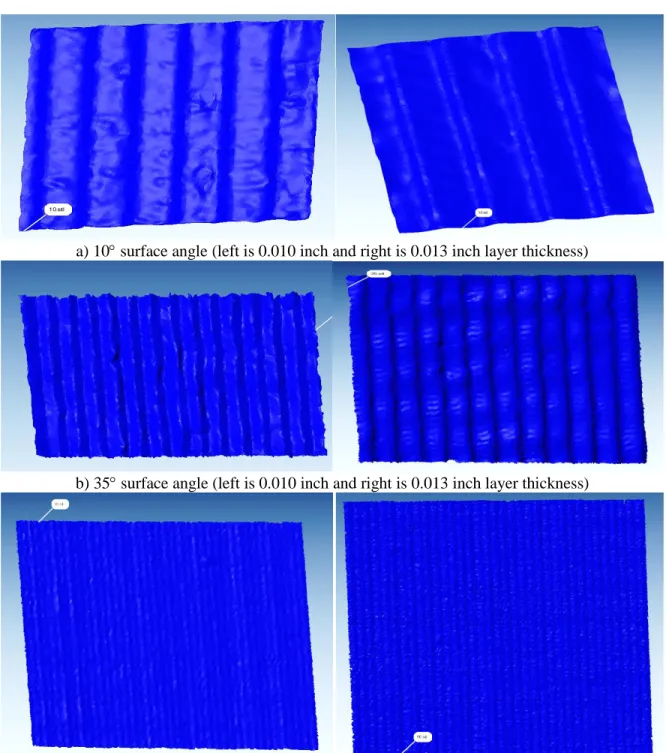
The poor surface roughness is primarily a result of layer by layer deposition of material, which creates the staircase effect for all inclined surfaces. The process parameters, such as layer thickness, define the ridges that cause the surface roughness.
Objective: improving the surface integrity of AM parts
- Analytical modeling of the surface profile
- Inspection of the surfaces manufactured by AM methods
- Post processing of the parts
After post-machining, a mechanical roughness device was used to measure the surface roughness after post-machining. Post-machining is the only option to further increase the surface roughness of FDM parts.
LITERATURE REVIEW AND BACKGROUND
Introduction
Analytical Modeling of surface roughness
The two main process parameters that affect surface roughness are layer thickness and build orientation. 13] proposed a semi-empirical model to predict the surface roughness of a layer-based manufactured part by FDM.
Surface topography
- Surface texture parameters
- Surface roughness measurement instruments
- Literature review on surface roughness measurement of AM parts
Some of the more common surface texture parameters are explained in the following paragraphs according to ISO and 25]. Sds Surface Peak Density Used to estimate the density of peaks and troughs on a surface.
![Figure 2-8 The ideal and actual cycle of manufacturing a part [24].](https://thumb-us.123doks.com/thumbv2/9docorg/12455236.0/32.918.258.729.779.1002/figure-2-8-ideal-actual-cycle-manufacturing-24.webp)
Literature review on post-processing of layer-based manufacturing parts . 35
- Post processing for non-metallic AM products
However, if there is a need for support structure, such as FDM, it becomes one of the main factors that impair the surface roughness. The research works to improve the surface roughness of metallic AM parts are presented in the next section. The post-processing for non-metallic AM products is one of the main categories for improving the surface roughness.
Electroplating can be used to build up thickness on undersized parts, so it can be used to improve the surface roughness of the parts. 13] attempted to improve the surface roughness of FDM parts by Hot Cutter Machining (HCM) of the surface and reported 0.3µm surface finish with 87% confidence level. Another mechanical approach used to improve the surface roughness of AM parts is Abrasive Flow Machining (AFM).
75] have used Abrasive Jet Deburring (AJD) method to improve the surface roughness of SLA parts. A non-clamping mechanical process used to improve the surface roughness of FDM parts is Barrel Finishing (BF) [18 and 76]. 81] investigated the effect of part orientation on the surface roughness and dimensional accuracy treated with acetone vapor.
![Figure 2-20 the difference between the raw surface and CNC finished part [60].](https://thumb-us.123doks.com/thumbv2/9docorg/12455236.0/55.918.341.626.683.920/figure-20-difference-raw-surface-cnc-finished-60.webp)
METHODOLOGY
- Introduction
- Developing the arithmetical surface roughness formula
- Total Least Square (TLS) Method
- Inspection procedures
- Design of experiments
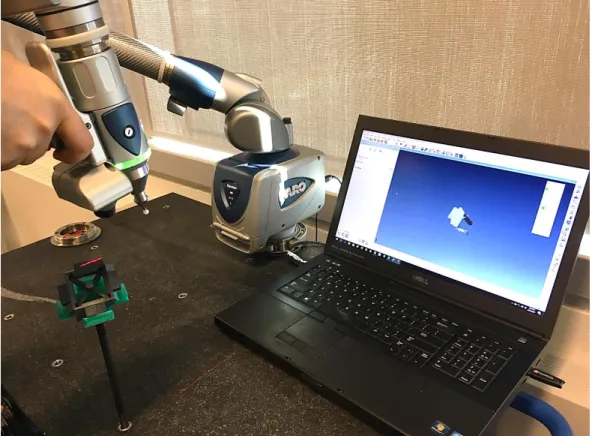
Inspection of layer-based production parts for surface roughness purposes required a sufficient measuring range to cover the patterns on the surface. In this study, an area of 4 mm x 4 mm is measured to obtain sufficient details of the surface. In this thesis, a new methodology is developed that uses the Total Least Square (TLS) method to calculate surface roughness.
To obtain the surface roughness value of each surface, a plane is fitted to the data points whose total sum of the arithmetic distances of all points is minimum. In this context, a computer program has been developed that, by obtaining the point cloud data of the surface, calculates the TLS plane and the deviations from this plane are used to find the surface roughness. The measuring range of the laser scanner was sufficient to examine the surface texture of the FDM parts with a layer thickness of 0.010 and 0.013 inches before performing the post-processing phase.
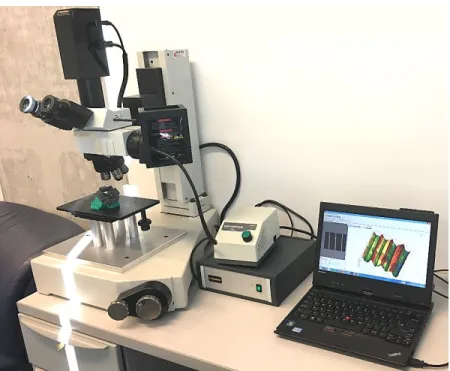
In the next step, the distance from the TLS level is calculated and the surface roughness is found using Equation 3-23. The surface topography and surface profile of this sample is shown in Figure measuring the surface roughness using the optical methods is the transparency of the surfaces and also calibration of these devices. The full factorial method is chosen as there is not enough data on the behavior of the surface roughness at each surface slope.
RESULTS AND DISCUSSIONS
Introduction
Analytical solution results
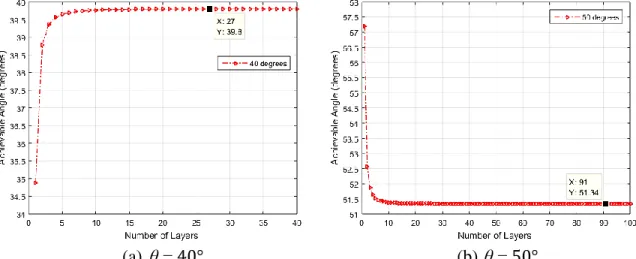
However, in other cases it may converge to a larger angle, so the best choice can be found with a smaller number of layers before convergence. To solve this problem, it is suggested to reduce the layer thickness to increase the number of layers and achieve a better result. The layer thicknesses available on the machine are very important when choosing the number of layers for the achievable angle closest to the desired one.
Therefore, taking into account the available space and the desired angle, the designer can check the required number of layers based on the curves obtained in this work. This will lead to the layer thickness needed to have that number of layers in the available space. If it is equal to one of the options, the surface can be easily manufactured, but if it is larger, the number of layers will have to be increased, which can lead to errors in the surface angle.
An increase in the number of layers causes an increase in surface roughness and based on the application that a higher or lower surface roughness is desirable, the number of layers can be chosen. In fact, if the angle is not the main factor and an angle of 14.480 is acceptable leading to a lower surface roughness, the number of layers can be changed to 4 layers instead of 10. In addition, if the surface roughness is important, number layers can be changed to get the preferred surface roughness, but it should be noted that this may introduce an error in the desired angle.
Validation of analytical solution with Experimental results
In the next step, the results of the analytical formulation and the actual surface roughness values are calculated using the point cloud data of the manufactured surfaces. In the theoretical solution, the surface is considered completely smooth and has no undulations. The only thing that is taken into account is the square shape of the steps of the layers on top of each other.
However, the surface created by the FDM process has undulations on it due to machine vibration, acceleration, deceleration of the head during printing, etc., which are not considered in analytical resolution. The other effect not taken into account is the fill below surfaces which is visible at 5 and 10. The filler material can be seen on the surface, making it too different from the ideal surface.
At higher surface slopes such as 80 and 85 the waviness dominates and after a certain degree (70) the tendency is locally changed to increasing by increasing the angle. In addition, the surface in the theoretical model is considered as stairs with square edges, which is another reason for getting different results. a) The surface roughness results of the sample with a layer thickness of 0.010 inches.
Results of post-processing stage
Compared to the original roughness values, the smoothing process has significantly affected the surface roughness, especially for angles above 40 degrees. The surface roughness decreases by increasing the surface angle, which shows more important effect of the surface slope. It can be concluded that 4 cycles of 15 seconds give the smoothest surface; however, there should be a relationship between the number of cycles and cycle time, and which has the most significant effect on surface roughness.
As is clear, in almost all cases 2 cycles of 15 seconds lead to a smoother surface than 3 cycles with 10 seconds, showing that duration has more effect on the surface roughness. To decide which factor has the most influence on the surface roughness, time is increased at each cycle number and represents reduction in surface roughness with respect to original roughness and in the other case the time duration is kept constant and number of cycles is increased for 0.010 inch layer thickness (Figure 4-12 (a-f)). In the case of constant number of cycles, increasing the duration from 8 to 10 seconds results in a reduction of surface roughness as reduction percentage increases.
This result shows that increasing the dwell time leads to smoother surfaces and has more effect on surface roughness. On the other hand, when the duration is constant and the number of polishing cycles is increasing, from 2 to 3 cycles, the surface roughness decreases, but compared to the case of the constant cycle, from 3 to 4 cycles, it decreases. Increasing the time from 8 to 10 seconds has the smallest effect and the surface roughness does not change significantly, but from 10 to 15 seconds there is a significant increase in RRP.
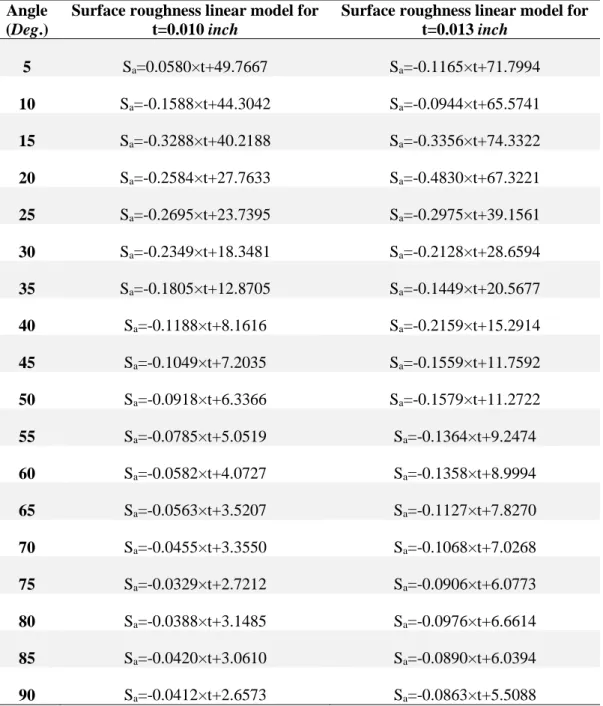
Statistical analysis and model development
To make a quantitative comparison between the linear and quadratic models, the sum of squared errors (SSE) and root mean square error (RMSE) for the two models are compared (Table 4-5 and Table 4-6). For both indicators, the quadratic model has a smaller mean than the linear model in both indicators. Therefore, the quadratic model is found to be the best model to explain the surface roughness trend based on TET.
As shown in Figure 4.15, for angles below 30 degrees, the two models are unable to display the results efficiently. This can be explained by considering the larger step effect at these corners as the initial value of the surface roughness.
Design models
As the surface becomes smoother by increasing the angle towards 90, the effect of process parameters becomes. This leads to an increase in roughness up to 85, but at 90 the roughness becomes minimal compared to all other angles. In this research, acetone vapor bath smoothing was used to improve the surface roughness of FDM parts made of ABS.
If the surface angles are inclined more than 40 from the horizontal axis, the surface roughness values become less sensitive to the surface slope. Layer thickness is the most important design factor affecting surface roughness and reducing it results in reduced surface roughness. A computer program was developed to process the point cloud data and find the surface roughness.
Evaluation of Analytical Modeling for Surface Roughness Improvement of FDM Test Part Using Measurement Results”. Effect of process parameter settings and thickness on surface roughness of produced Ti‐6Al‐EBM. Experimental Analysis of Surface Roughness and Surface Texture of Molded Deposition Machined and Melted Parts”.
![Figure 2-4 Proposed profile shape in [10]](https://thumb-us.123doks.com/thumbv2/9docorg/12455236.0/27.918.179.799.115.321/figure-2-4-proposed-profile-shape-in-10.webp)
![Figure 2-6 Elliptical representation of surface profile manufactured by layer-based methods [15]](https://thumb-us.123doks.com/thumbv2/9docorg/12455236.0/30.918.279.690.110.525/figure-elliptical-representation-surface-profile-manufactured-layer-methods.webp)
![Figure 2-10 Schematic of a surface roughness device based on magnifying the surface topographies [24]](https://thumb-us.123doks.com/thumbv2/9docorg/12455236.0/33.918.302.698.565.835/figure-schematic-surface-roughness-device-magnifying-surface-topographies.webp)
![Figure 2-14 skew parameter distinguishes between two profiles with differing shapes [24]](https://thumb-us.123doks.com/thumbv2/9docorg/12455236.0/39.918.259.711.219.525/figure-14-skew-parameter-distinguishes-profiles-differing-shapes.webp)
![Figure 2-15 The components of a stylus type surface texture measuring instrument [24]](https://thumb-us.123doks.com/thumbv2/9docorg/12455236.0/42.918.198.779.358.652/figure-components-stylus-type-surface-texture-measuring-instrument.webp)
![Figure 2-18 Schematic representation of non-contact surface texture measuring systems [24]](https://thumb-us.123doks.com/thumbv2/9docorg/12455236.0/46.918.181.796.114.923/figure-schematic-representation-contact-surface-texture-measuring-systems.webp)
![Figure 2-21 Left: the as received SLA surface, right: the laser polished surface [67]](https://thumb-us.123doks.com/thumbv2/9docorg/12455236.0/58.918.181.810.299.449/figure-left-received-surface-right-laser-polished-surface.webp)