CHAPTER 6
SUMMARY, CONCLUSIONS AND FUTURE WORK
6.1 SUMMARY AND CONCLUSIONS
Within the “Backfill and Plug Test Project” a material, which might be used as a sealing material in an engineered barrier for nuclear waste, was experimentally investigated. Thus, the objective of this thesis was to determine if this soil, obtained by mixing up two different soils, might be a good sealing material for the accessing galleries in a future barrier. There are three important requirements for such materials: low hydraulic conductivity and diffusion, high enough swelling capacity and low cost.
The mixture contains 30% of MX-80 sodium bentonite and 70% of crushed granite rock with a maximum grain size of 20 mm. This mixture was chosen after an initial experimental campaign performed by Clay Technology AB with different sodium bentonite contents (10, 20 and 30%). From the results of these tests, 30% of sodium bentonite was considered as a candidate for this purpose by assuring low permeability and required swelling capacity. Moreover, an important part of granite produced during the excavation of a future vault could be reused and recycled. Therefore, the three main requirements for this material can be fulfilled.
The study of this mixture (30/70 by weight) was focused on its hydraulic conductivity. As the compacted backfill can be in contact with saline environment, special attention was paid to the influence of salt water on backfill hydro-mechanical behaviour. Hydraulic conductivity can significantly change when pore fluid chemistry is altered in active soils. The bentonite content of this mixture is large enough if compared, for instance, with natural clayey soils mainly made up by kaolinites or illites. Therefore, backfill hydro-mechanical behaviour may be affected by changes in chemistry of pore fluid. It must be pointed out that studying and investigating the hydro-chemo-mechanical behaviour of this mixture is extremely complicated due to the big size of the granite particles and the high enough content of bentonite which makes very slow any hydraulic-diffusive test performed in such material. Influence of pore fluid chemistry on hydro-mechanical behaviour was investigated by means of oedometer tests in Rowe cell, water uptake tests, compaction tests and determination of water potential in the soil structure (retention curve). Backfill hydraulic conductivity showed to be sensitive to changes in salinity of water used to saturate the specimens, however, backfill compressibility was not dependent on water salinity. Estimated backfill hydraulic conductivity from the oedometer tests showed variations larger than six times for specimens compacted at a dry specific weight of 16.7 kN/m3 comparing the results of specimens saturated with distilled water and specimens saturated with salt water, and larger than one order of magnitude for specimens compacted at a dry specific weight of 13.7 kN/m3. Backfill hydraulic conductivity ranged from 2·10-12 m/s to 4.5·10-12 m/s at a void ratio of 0.58 (dry
Swelling pressure of the specimens compacted at the higher dry specific weight (16.6 kN/m3) was not significantly sensitive to hydration with water containing salts in the investigated range of salt concentrations. However, those specimens compacted at a lower dry specific weight (13.7 kN/m3) showed small swelling pressure (23 kPa) when hydrated with distilled water and no swelling pressure was measured in those specimens hydrated with water containing any salt concentration. Measured backfill swelling pressure at the largest dry specific weight was higher than 186 kPa for three different concentrations of salts in water used to saturate the samples. As backfill presented no swelling capacity at the lowest dry specific weight, it would be important to place bentonite blocks in those areas where compaction problems can appear in an accessing gallery (roof and ground). These bentonite blocks would assure the swelling capacity of the barrier.
If backfill is hydrated with salt water and compacted at simple energy, the maximum dry specific weight is higher than dry specific weight obtained when backfill is hydrated with distilled water. Water content at the maximum dry specific weight when backfill is permeated with salt water is smaller than water content obtained when backfill is hydrated with distilled water. However, at double energy, the chemical influence on compaction results is not very important. At this level of compaction, similar compaction curves were determined when backfill was hydrated with salt water or distilled water. Therefore, compaction response depended on chemical composition of pore water.
Backfill retention properties were studied by means of transistor psychrometer, filter paper technique and vapour transfer technique. The results showed the enormous difficulties to study the retention properties of this soil due to the big size of the granite particles. Measured total suction of backfill at 11% of water content (water content at which backfill was compacted in situ) is around 3 MPa. At this low range of total suction, osmotic suction plays an important role as a component of total suction in the project.
The osmotic component of total suction is usually neglected and assumed constant, which is not correct in wetting or drying paths in clayey soils. From vapour transfer tests in bentonite-sand mixtures (10, 30 and 70% of bentonite content) hydrated with distilled water and salt water (16 g/L) in drying conditions was clear that osmotic suction was not constant and the concept should be reviewed. Therefore, backfill osmotic suction was inferred from a mixture of a 30/70 bentonite-sand mixture. After the granite substitution by sand, osmotic suction was determined to be 1.7 MPa as a maximum value. The role of osmotic suction as a driving force in coupled flow transport is not clear yet and further experiments are necessary to clarify its importance within the framework of the project.
For these reasons, it is believed that this material is suitable to be used as sealing material in a future repository, however, further investigations, detailed in the next section, are still necessary to improve the current knowledge of the backfill behaviour.
A new minipiezometer, called dynamic pore pressure system (DPPS), was developed in order to perform pulse tests and constant head tests in compacted clayey soils. Thirteen DPPS were installed in section A4 at the ZEDEX gallery at the Äspö Hard Rock Laboratory. By performing such tests, backfill local hydraulic conductivity can be determined in situ. With this new mini-piezometer a map of local hydraulic conductivity and soil compressibility can be estimated. This information will be very important when analysing the global flow pulse tests to be performed throughout 2003 and 2004 in the ZEDEX gallery. In this thesis, development, calibration and mathematical interpretation of the results were carried out. That allowed the understanding of the pulse test and the development of the necessary tools to analyse them. The appropriate tools to carry out and analyse the pulse tests in situ were also developed.
Darcy’s law was validated when constant head tests were performed at different hydraulic gradients (4 – 100) in the cylindrical cell designed to carry out the calibration of the mini-piezometer. The average backfill hydraulic conductivity was 6.5·10-12 m/s when its dry specific weight was 15.9 kN/m3 and the specimen had been saturated with distilled water. Estimated and calculated values of backfill permeability are considered small enough to guarantee the effectiveness of the barrier in reducing the flow of water, chemical species and radionuclides, even when salinity of water increases in the range investigated.
Pulse tests performed in laboratory provided with good results when hydraulic conductivity was estimated by means of finite element method. Four pulse tests were carried out in laboratory and the backfill hydraulic conductivity estimated from these tests was 8·10-12 m/s at a dry specific weight of 15.9 kN/m3. The estimated value is in agreement with hydraulic permeability estimated from the six constant head tests performed in the same specimen at different hydraulic gradients.
Influence of studying the pore water pressure dissipation by means of Biot’s and Terzaghi’s approach was investigated. From the calculations by using Biot’s approach, it was clear that total mean stress changed when water was suddenly injected in the porous medium. Nonetheless, the calculated mean stress changes were not significant (8 kPa when water pressure increased up to 206 kPa). To overcome the variation of total stresses, it would be convenient to analyse the last part of a pulse test performed in situ in order to estimate the hydraulic conductivity and the soil compressibility (beyond t50).
Eighteen pulse tests were performed in different mini-piezometers placed at section A4 in the ZEDEX gallery. Some of them were analysed by using the finite element code and the Gibson’s model. After the numerical analysis, a map of backfill local hydraulic conductivity and compressibility was established. Variations up to two orders of magnitude of hydraulic conductivity were estimated after those tests in situ. This large variation is mainly due to the variation of dry specific weight after the compaction of the backfill. It was confirmed that backfill compacted close to the walls, roof and ground of the gallery is more pervious than backfill compacted close to the centre of the section. The layout designed and built to carry out pulse tests in situ proved to be sturdy and reliable when performing those tests.
Finally, an analysis of flow of water and solutes in the ZEDEX gallery was performed by solving the hydro-chemical problem in a fully coupled way when intrinsic permeability was updated by changes in concentration of salts in backfill pore fluid. Moreover, the ion exchange reaction between sodium and calcium was considered. This geochemical model was very simple, and a more complicated backfill geochemical model was beyond the scope of this thesis. By doing so, the saturation process of the ZEDEX gallery was simulated and successfully reproduced by a THMC finite element code. Osmotic suction was computed by using the concentrations of ions in the pore fluid assuming the validity of Van’t Hoff equation. Constant osmotic suction is not a valid hypothesis in this problem for different reasons, low range of total suction (below 3.5 MPa) or liquid mass transfer of salt water into the soil structure. Therefore, total suction was computed and compared with the measurements obtained by psychrometers placed at the ZEDEX gallery. Moreover, global flow tests, after the backfill saturation phase, were numerically simulated in order to check the influence of a non-homogeneous distribution of intrinsic permeability in the ZEDEX gallery. The influence of the non-homogeneous distribution of intrinsic permeability due to the injection of salt water on the saturation process and on global saturated flow tests was not very important in those computations performed.
Some effects can alter the evolution of the saturation process and global flow tests in the ZEDEX gallery. These factors are: 3D effects, backfill anysotropic behaviour, host rock should be studied as jointed medium, osmotic flow of water or variability of backfill dry specific weight after compaction. Some are more important than others, but all of them are difficult to study at this stage of the project and it would be really interesting to consider a plan to dismantle the field test in order to investigate the possible existence of these factors.
6.2 FUTURE RESEARCH WORK
After this thesis and the experimental work performed in this backfill some important uncertainties remain mainly related to pore fluid chemistry and their interaction with the macroscopic behaviour of active soils. Future work directly related to the Project it is also detailed.
Hydraulic fracture could occur if water pressure is suddenly increased in the backfill. There are not many works dealing with this subject in the literature. Because of its influence on assuring the stability of the barrier, it is important to study the maximum hydraulic gradient that does not produce cracking of backfill at different stress states.
Because of the requirements for a candidate material for sealing of a vault in a future repository for nuclear waste, more interest should be focused on diffusivity of ions and gas, and influence of water chemistry of the surrounding environment. Backfill hydraulic conductivity, as well as swelling pressure and compressibility, have been characterised taking into account the effect of salinity of incoming water from the surrounding environment. Backfill macroscopic behaviour (mainly hydraulic conductivity) is importantly affected by alterations of pore fluid chemistry. However, it is important to determine and establish a complete geochemical model able to account for the most important chemical reactions and the geochemical initial conditions since this knowledge is necessary if backfill long-term behaviour and stability is investigated. In this context, determination of diffusion of gas and ions is also important when solving the reactive transport problem. Owing to the low backfill hydraulic conductivity, the main mechanism of transport may be diffusion. Therefore, backfill non-advective flow of ions should be characterised.
Osmotic suction (or chemical potential) is usually disregarded or assumed constant. This is not correct as it was shown throughout this thesis. Role of osmotic suction as a driving force in moving water and ions (osmotic flow) or its mechanical influence on soil structure in wetting and drying cycles (suction as a valid stress state variable), has to be characterised. Further experimental characterisation of osmotic suction is necessary in soils where drying paths and hydration with mass liquid transfer containing chemical species occur. Moreover, influence of pore fluid chemistry on micro and macrostructure of active soils introduces a coupling between the pore fluid chemistry and matric suction because of the changes in soil structure.
CHAPTER 5
AN ANALYSIS OF FLOW AT THE ZEDEX GALLERY BY
USING A COUPLED HYDRO-CHEMICAL APPROACH
5.1 INTRODUCTION
Unsaturated and saturated flow has been numerically investigated in the ZEDEX gallery. When analysing the behaviour of a deep repository, the unsaturated state of the clayey components of the engineered barrier represents a short transient period if compared with the long life of the nuclear waste. However, unsaturated flow became critical within the schedule of the Backfill and Plug Test Project, as backfill hydration was slower than expected a priori from the results in laboratory. Therefore, the study of the backfill unsaturated flow was a key issue in the simulations carried out throughout the project.
Several models were proposed in order to study the flow in this project: different geometries, different boundary conditions, different backfill parameters, different formulations, etc. The aim of this study was to establish a proper model able to reproduce the flow conditions at the barrier. After all the calculations performed, a model which took into account the reactive transport of salts was the most suitable to reproduce the measurements from different devices located in the backfill. The key point of the conceptual model presented is the variation of osmotic suction with time due to the transport of solutes. The range of total suction measured in the BPTP is low if compared with pure bentonites in other projects dealing with engineered barriers. Therefore, the variation of osmotic suction may become significant under these conditions. Moreover, the increase of backfill hydraulic conductivity due to its hydration with salt water had to be taken into account to correctly reproduce the measurements. This increase, though not very important, was proved from different experimental results in chapter 3.
the finite element code and used to compute the variation of intrinsic permeability depending on pore fluid chemistry.
5.2 HYDRAULIC CONDUCTIVITY AND ITS MATHEMATICAL STUDY
Hydraulic conductivity is one of the most important parameters in soil mechanics and above all, one of the most complex to estimate with accuracy due to its enormous variation depending on changes in fabric, void ratio, water content, temperature and pore fluid chemistry. One of the very first models of hydraulic conductivity was the well-known Kozeny-Carman equation obtained by assuming laminar flow of a fluid in a net of channels when the hydraulic radius concept is applied. The grain size distribution was also used in the past to obtain expressions of the hydraulic conductivity and the water retention curve (Kovács, 1981; Fredlund et al. 1997). Kozeny-Carman law and grain size distribution models have been widely and successfully used in uniformly graded sands but, as it was stated by Olsen (1962), they were not suitable for compacted clayey soils due to the heterogeneity of the pore size distribution of such soils. Olsen indicated that flow is limited only to the inter-cluster pores (macropores) and fluid filling the intra-cluster pores (micropores) should be less mobile or immobile. Therefore, hydraulic permeability models based only on volumetric or grain size parameters cannot accurately reflect the complexity of compacted finer soil fabric.
Some works related the pore size distribution to hydraulic conductivity, soil retention curve and relative liquid permeability (Marshall, 1958; Garcia-Bengochea & Lovell, 1981; Elzeftawy & Cartwright, 1981; Kosugi, 1996; Arya et al. 1999; Romero et al. 1999; Watabe et al. 2000; Tuli et al. 2001). These models represented an important improvement respect to those related to grain size distribution or void ratio. However, such models are only applicable to inert soils but not to soils containing expanding clay minerals as bentonites, where pore fabric changes as a result of clay-fluid interactions. Lapierre et al. (1990) showed that there is not a one-to-one relationship between pore size distribution of a soil and hydraulic conductivity after flow tests, scanning electron microscopy (SEM) tests and mercury intrusion porosimetry (MIP) tests in grey marine plastic clay from Quebec. They finally concluded that direct measurements of this parameter are necessary.
Nowadays, some techniques are available to determine directly the volumetric pore size as MIP tests, capillary condensation method, or removal of water by suction or air pressure (Mitchell, 1993). MIP is, doubtless, the most common among soil scientists but its use still presents important uncertainties and limitations and its results have to be carefully considered. Despite of these limitations, MIP has become an important and useful tool to study the fabric (micro and macrostructure of soils).
by weight) at different dry specific weights. When soil specimens were hydrated with salt water, intruded volume of mercury in the first mode of pores (macrostructure) in the specimens hydrated with salt water was bigger than volume of mercury intruded in the first mode of pores (macropores) when specimens were hydrated with distilled water. Similar results were obtained after tests in specimens compacted at two dry specific weights. However, Hueckel et al. (1997) developed a theoretical model of hydraulic conductivity, from an idealisation of the fine fraction as a two-dimensional organised periodic structure of solid particles, which is mainly controlled by the size of the smaller channels connected in series with the larger channels. They correlated the measured intrinsic permeability in flow tests, performed in specimens permeated with organic fluids as ethanol and dioxane, to measured changes in pore size distributions. Finally, concluded that the increase of intrinsic permeability observed after permeation with those organic fluids could not be explained by changes in the pore size distribution and intrinsic permeability was mainly controlled by the size of micropores connecting macropores.
As it can be observed, factors that control permeability of clays are not clear yet and important and big discussions arise from the interpretation of different experimental data available in the literature. Consequently, in the past two decades, several mathematical models of the hydraulic conductivity were proposed taking into account the pore fluid chemistry and the interactions in the soil-fluid system as a next step. The variety, origin, hypotheses and mechanisms are indeed wide and only few of them will be revised here. Experimental investigation of hydraulic conductivity variation with pore fluid chemistry is more advanced than conceptual understanding of all the phenomena involved in such a problem. Nevertheless, conceptual understanding of all the phenomena occurring at the micro and macrostructural levels is difficult due to the obvious “deficiencies” of the traditional experimental work performed in soil mechanics. Sophisticated techniques as MIP, scanning electron microscope (SEM) are necessary to overcome the problem of scale when studying the micro and macrostructural behaviour of active clays. Nevertheless, once more, deducing macroscopic patterns from microstructure behaviour is also complicated.
Russo & Bresler (1977)
They modelled the effect of electrolyte concentration and Na/Ca ratio on the unsaturated hydraulic conductivity of a mixed sodium-calcium soil system. When an active clay (mostly smectites) swells due to hydration, a decrease in the pore diameter is measured and therefore, a subsequent reduction in hydraulic conductivity is observed. Their model estimates the unsaturated hydraulic conductivity by calculating the effective porosity in a homogeneous and isotropic porous medium with uniform porosity by means of the diffuse double layer theory. Each elementary volume of the soil (V) is subdivided into l equal subvolumes (vi). The number of platelets in a mixed Na-Ca system at the same fluid pressure is calculated as a function of the exchangeable sodium percentage (ESP) as
1
1 2
2 0
Ca i
Ca
i i i
Na i
N for ESP ESP
N N N for ESP ESP ESP
N for ESP ESP
≤ <
= − ∆ ≤ <
≥
(1)
where Ca i
particle decreases, ESP2 is the value at which there is only a single platelet in a particle, ∆Ni is the number of clay platelets which are broken off the Ca-montmorillonite particle and NiNa is the number of platelets per particle of Na-saturated montmorillonite. The volume of water retained in the clay fraction by unit of soil, ui, can be estimated by means of the diffuse double layer theory as
(
)
(
)
(
)
(
)
0 0 2 1 22 1 2
2
Ca
i i b
Ca i i
i i i i b
Ca i
S
b b N N
u
S
b b N b N
N ρ ρ + − = + − − ∆ (2)
where S is the specific surface of the soil, b0 is the thickness of the water film between two adjacent clay platelets within a clay particle, bi is the half distance between two adjacent clay particles and ρb is the bulk density of the soil. In a confined volume (V) using equation (2), the pore space (Hi) in which water flow takes place is computed and from this value, the effective porosity (ni) is calculated. Finally, hydraulic conductivity is estimated depending on the volumetric water content, θ, concentration of the solution, C, and composition of the equilibrium soil solution
(
R=[ ][ ]
Na Ca −0.5 in meq/L(
)
0.5)
by means of Marshall’s equation (Marshall, 1958).(
)
2(
)
21 1
, , 2 1
1 8
l i
i i i
i
n g
k C R i a a a
l i ρ θ η + =
= ⋅ ⋅ − >
− +
∑
(3)Where ai is the mean equivalent radius of the pores depending on the i subvolume, effective
porosity of the subvolume, soil porosity and surface tension of the soil solution and η is the dynamic viscosity of the fluid. The model so defined is little sensitive to the pore size distribution or specific surface of the soil, however, it was checked out that the model was strongly sensitive to the relationship between the number of platelets per clay particle and ESP, which, finally, is depending on soil water pressure, soil solution concentration and composition.
Mehnert & Jennings (1985).
They presented one of the very first works where intrinsic permeability was updated depending on total salt concentration in the liquid phase following a mathematical expression while studying salt intrusion episodes in saturated coastal aquifers. Three different intrinsic permeability functions were implemented and compared in a finite element code that solves the solute mass balance on salt concentration in the mobile and immobile fluid phase. In this study, they pointed out the importance of the intrinsic permeability, k0, variation due to
change in pore fluid chemistry, Cm. The three laws implemented were
(
)
(
)
1 * *
0 0 0
* 0 2
0 * *
0 0 * 3 0 0 ( ) ( ) ( ) m m s s m t
m m t
s m t
s t
m t
m
s m t
C k C k k k
C
k C C
k C C C
k k k C C
C C
k C C
k C
k C C
= + −
<
= + − − >
− < = > (4)
where Cs is the source strength concentration of salt on the seaward domain boundary, Ct is
the threshold concentration at which permeability changes may be detected, ks is the domain
permeability measured for Cs, and
* 0
k is the intrinsic permeability measured when Cm = 0.
Figure 5.1 shows the shape of these three intrinsic permeability functions and the meaning of the symbols. Nevertheless, it was not the intention of the authors to present proper permeability functions, but only to compare and study the variation of the solution when variations of hydraulic conductivity depending on pore fluid chemistry were considered. This formulation is, as a main advantage, very easy to implement and experimental information can be provided to simulate the soil behaviour. However, the model is not able to distinguish among the effects that different reactions can have on the hydraulic conductivity. Effects on hydraulic conductivity due to ion exchange reactions can be different from the effects due to dissolution/precipitation of minerals, for example, depending on the soil mineralogical composition, concentration, charge of exchanging cations, temperature, etc. It also predicts a reversible behaviour of the hydraulic conductivity when pore fluid concentration changes.
Suarez & Šimůnek (1997)
They studied the water movement and the ion chemistry in soils that contain CaCO3 in arid and semiarid regions by means of a new finite element code to study the chemo-hydraulic behaviour of porous media. The main reactions considered in the original model were carbonate-solution and ion exchange. They considered that soil hydraulic conductivity decreased because of pore fluid chemistry changes and proposed a model to take into account the effect of pH and presence of considerable amount of exchangeable sodium as, for example, in sodium bentonites. Therefore, they presented a phenomenological model to take into account both effects on the variation of the hydraulic conductivity. It was proposed an expression of the unsaturated hydraulic conductivity as
where ks is the saturated hydraulic conductivity, krA is the liquid phase relative permeability
law and r is the reduction function, calculated as r = r1·r2, where r1 is the reduction due to low
salinity and high exchangeable sodium fractions in the clay and r2 is the reduction due to the
effect of pH. The r1 term is given by
1 1 1 n n cx r cx = −
+ (6)
where c and n are empirical factors and x depends on the mass fraction of montmorillonite in the soil, the interlayer spacing and the exchangeable sodium percentage in the soil. Finally, the reduction factor r2 is calculated from experimental results as
2
1 6.83
3.46 0.36 6.83 9.3
0.1 9.3
pH
r pH pH
pH < = − ⋅ ≤ ≤ > (7)
The model is simple to implement in a finite element code and all the variables can be easily computed during the calculations of the reactive transport problem. The main problem of this model is, doubtless, its lack of generality since it is extremely difficult to introduce the effects of different chemical reactions in a complex geochemical problem on hydraulic conductivity.
Hueckel et al. (1997)
In this work, the authors presented different geometrical models using a two-dimensional organised periodic structure of solid particles. One of the mechanisms presented to explain the evolution of permeability due to interaction between liquid organic chemicals and clays was flocculation. This mechanism was observed in clay suspensions (van Olphen, 1963). They considered that this mechanism is found in all kind of clays that exhibit a variation of permeability when permeated with organic chemicals. The model is able to reproduce the increase of permeability in clayey soils in such conditions without changing the pore size distribution. In compacted soils it is assumed that the attraction forces (such as Van der Waals and Coulomb forces) affect the particles and clusters only in its vicinity, resulting in a slight body rotation as shown in figure 5.2a. This body rotation creates diverging and converging pores. Flow in this new channel network was studied by means of an approximated solution for a perfectly radial, incompressible and at a low ratio of inertial to viscous stresses flow (figure 5.2b). After several hypothesis and calculations and assuming that the angle of rotation between clusters is smaller than 18º, an expression of the intrinsic permeability was provided as
( )
2 3( )
2 30 2 2 2
(1988, 1991). The authors of the model believe that permeability is mainly controlled by change in the size and shape of some of the micropores. Some experimental works did not corroborate this hypothesis, but, at this moment, fully understanding of all the factors affecting the evolution of hydraulic conductivity and its interaction with the soil-fluid system is not available. In any case, the model predicted the increase of permeability without changes in pore size distribution. Finally, as the authors pointed it out, more experimental information provided by indirect methods is needed to support this mechanism. A numerical application of this permeability model was presented by Kaczmarek et al. (1997). They introduced an exponential law between the size of the small channels and the total salts concentration in pore fluid to study in a numerical way the conservative transport. They also introduced the fluid viscosity dependency on total salt concentration in pore fluid.
5.3 FORMULATION OF THE REACTIVE TRANSPORT PROBLEM
A new formulation was used to study backfill hydro-chemical behaviour. This formulation is a fully coupled combination of a pre-existing code (CODE_BRIGHT) to solve non-isothermal multi-phase flow of brine and gas through deformable and unsaturated geological media problems (Olivella et al. 1994 and Olivella et al. 1996) and the reactive transport equations. CODE_BRIGHT is mainly applied to study the behaviour of engineered barriers for nuclear waste in THM problems (Gens et al. 1998; Gens & Olivella, 2000). At this moment, the main application of this new fully THMC formulation is also in this matter (Guimarães et al. 1999; Guimarães et al. 2002), although the code can be used in environmental engineering or petroleum engineering as well (Guimarães, 2002). The formulation considers that geochemical variables, as osmotic suction and concentration of chemical species in the liquid phase and solid phase, can affect the hydro-mechanical behaviour of clayey soils.
Only the hydro-chemical problem was solved during the simulation of the hydration process at the BPTP. Temperature was assumed constant, gas phase was not taken into account and osmotic gradient due to different saltwater concentrations in mixing and hydrating water was not considered in these analyses. The processes considered were:
Advective flow of water and solutes (Darcy’s law). Molecular diffusion of solutes (Fick’s law).
Mechanical dispersion of solutes (Fick’s law). Ion exchange of Na+ and Ca2+.
The basis of this formulation can be found in (Guimarães, 2002). A brief summary of the chemical fully coupled formulation is described here. In the reactive transport formulation proposed, several dissolved solutes in the liquid phase are transported through a porous medium and react chemically among themselves in the liquid phase (homogeneous reactions) or with other species in the solid phase (heterogeneous reactions). Chemical reactions considered in this formulation include:
are obtained using the restrictions arising from the various reversible chemical reactions (local equilibrium hypothesis). Let us consider the reactive transport of N chemical species in a deformable unsaturated porous medium. If Nx is the number of reversible independent
reactions in a system containing N species, the number of independent chemical components is Nc = N - Nx. It is now possible to classify the system in Nc primary species and Nx
secondary species. Reversible reactions between the two types of species can be expressed as
1
( 1,..., )
c N
i ij j x
j
A ν A i N
=
=
∑
= (9)where Aj and Ai are the chemical formulas of the primary and secondary species respectively
and νij the number of moles of the primary species j in a mol of the secondary species i. The
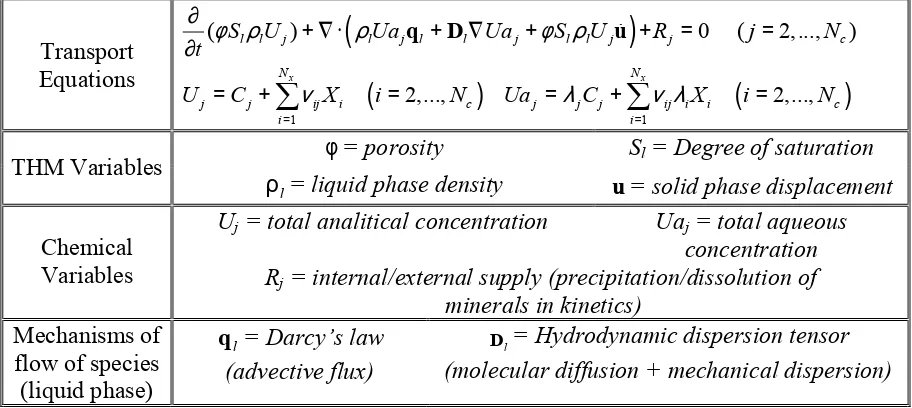
resultant transport equations and the variables used are briefly listed in table 5.1.
In that table, Uj is the total analytical concentration and Uaj is the total aqueous concentration
of the primary species j. Cj and Xi are the concentrations of the primary and secondary species
respectively. λj and λi are the mobilities of the primary and secondary species respectively (1
if the chemical species are in the liquid phase and 0 if the chemical species are in the solid phase). Total analytical concentrations Uj are the unknowns of the transport equations, and
Uaj and Rj are considered non-linear functions of Uj. The link between the unknowns Uj and
the dependent variables Uaj and Rj is the geochemical model described in next section.
This type of unknown exhibits the interesting property of being independent of chemical equilibrium. Regarding the chemical equilibrium, an approach based on the direct minimization of Gibbs free energy to solve the chemical equilibrium is used instead of the mass action law in this new formulation. This approach has a wider application range and it was extended to non-ideal brine systems (Harvie et al. 1987). To compute the concentrations of the species in equilibrium, a Newton-Raphson algorithm is applied to the minimization of Gibbs free energy. Lagrange multipliers are used to incorporate the restrictions of the problem. Transport Equations
(
)
(
)
(
)
1 1( ) 0 ( 2,..., )
2,..., 2,...,
x x
l l j l j l l j l l j j c
N N
j j ij i c j j j ij i i c
i i
S U Ua Ua S U R j N
t
U C X i N Ua C X i N
φ ρ ρ φ ρ ν λ ν λ = = ∂ + ∇ ⋅ + ∇ + + = = ∂ = +
∑
= = +∑
=q D u
φ= porosity Sl = Degree of saturation
THM Variables
l
ρ = liquid phase density u= solid phase displacement Uj = total analitical concentration Uaj = total aqueous
concentration
Chemical
Variables Rj = internal/external supply (precipitation/dissolution of
minerals in kinetics)
Mechanisms of flow of species (liquid phase)
l
q = Darcy’s law (advective flux)
l
D = Hydrodynamic dispersion tensor
[image:13.595.70.526.483.687.2]5.4 GEOCHEMICAL MODEL SOLVED IN THESE CALCULATIONS
To speed up the backfill saturation, the salinity of the Äspö water was increased adding NaCl and CaCl2 up to 16 g/L of salt concentration (50/50 by mass). Main chemical species in injected water to saturate the backfill are shown in table 5.2. The number of species in a real geochemical problem should be bigger and the necessary geochemical model would be more complex because of all the chemical reactions in the bentonite-fluid system as, for example, dissolution-precipitation of carbonates, chlorides, chalcedony and sulphates, ion exchange reactions among others. As available backfill geochemical information was limited, the geochemical model was simplified to its maximum and only the exchange reaction of Na+/Ca2+ was considered. Table 5.3 shows the assumed geochemical model.
Cl− (mols/L)
2
Ca + (mols/L)
Na+ (mols/L)
pH 0.2807 0.0720 0.1367 7.3
Table 5.2: Chemical analysis of the injected hydration water in the BPTP (Clay Technology, 1999).
Primary aqueous species H2O, Ca2+
, Na+ and Cl− Species in the solid phase NaX and CaX2
Ion exchange reaction 2NaX + Ca2+ = CaX2 + 2Na+
Table 5.3: Scheme of the solved geochemical model during the simulation of backfill hydration.
5.4.1 Geochemical initial conditions
There is not information on the geochemical initial conditions of this material. Therefore, some assumptions and hypothesis were assumed before performing the calculations. The correct determination of the geochemical initial conditions of an active clay-fluid system is very important, although usually very difficult. Initial exchangeable cation contents and solutes in the bentonite are necessary to simulate such geochemical problems. The available experimental techniques to study these conditions are the squeezing technique and aqueous extract tests (Iyer, 1990). Initial backfill pore fluid concentrations were obtained by interpolating experimental data obtained in compacted MX-80 specimens (Muurinen & Lehikoinen, 1998a and 1998b). The authors compacted different MX-80 specimens at different dry specific weights and put them in contact with different volumes of two external solutions, which ionic strengths were also different. After an interaction of about 300 days, some pore fluid of the specimens was squeezed out and chemistry of the external solution was analysed. They defined the bentonite-water ratio (B/W) as the total mass of bentonite divided by the volume of water connected to the specimen. The bentonite-water ratio in the case of the ZEDEX gallery should be zero as backfill is connected to an open system (the Baltic Sea). However, if data with B/W = 0 is used, concentrations in the open system remain constant. This might be the direction to which the process is going. However, in the repository, the surrounding system can be more closed and time dependent while full saturation and chemical equilibrium is reached (Muurinen, 2002).
Lehikoinen was already in equilibrium. Figure 5.3 shows the evolution of concentration of [NaX] and [CaX2] in meq/100g when the compacted MX-80 specimens were connected to two different salt solutions (0.19 g/L and 23.5 g/L of total dissolved salts). A linear variation of [NaX] and [CaX2] with the concentration of dissolved total salts in the connected solutions was assumed. The evolution of these two species were reduced to take into account the 30% of mass of bentonite in the backfill, and finally the values at 6 g/L of salts were used as the initial [NaX] and [CaX2]. Table 5.4 shows the concentrations of the two exchangeable cations (10 and 9 meq/100g respectively). Equation (10) shows the mass action law of the exchange reaction written by following the Gaines-Thomas convention. KNa Ca/ is the equilibrium constant of the exchange reaction, KNa Ca/ =0.4 (Appelo & Postma, 1993).
2
0.5 / 0.5
· Ca Na Na Ca
Na Ca
a x K
a x
+
+ =
⋅ (10)
Where xNa and xCaare the equivalent fractions of the exchangeable cations NaX and CaX2,
and aNa+ and aCa2+ are the chemical activities of the cations in the solution. The equivalent
fraction of the exchangeable cation i can be calculated using (11) and they are subjected to the following restriction (12). CEC is the cation exchange capacity of the soil.
concentration of exchangeable cation (meq/100g of solid) CEC (meq/100g of solid)
i
x = (11)
1 0 1
i i
x = ≤ ≤x
∑
(12)Chemical activities of the aqueous species were computed by the Harvie & Weare (1980) model, which belongs to the Pitzer family, valid for concentrated saline solutions. The concentrations of the aqueous primary species were calculated by using the amount of exchangeable cations shown in table 5.4 and the initial concentration of chloride was estimated considering the added water during the backfill mixing process with water containing 6 g/L of salt taking into account the bentonite initial water content prior to the mixing (10%). The so-calculated concentration of chloride was 0.0789 mol/kg of liquid phase. The distribution of calcium and sodium was calculated with the code by assuming that the two species were in chemical equilibrium with the calculated chloride concentration.
Exchangeable cations (meq/100g)
Aqueous primary species (mol/kg liquid phase) NaX CaX2 Na+ Ca2+ Cl
-10.0 0.55
Na
x =
9.0 0.45
Ca
x =
0.075 0.002 0.079
Table 5.4: Geochemical initial conditions of backfill used in the computations.
was obtained by means of filter paper technique and its osmotic suction, due to salt water, was indirectly studied measuring drying and wetting retention curves in a mixture of bentonite and sand, using the vapour transfer technique.
5.5.1 Intrinsic permeability variation with pore fluid chemistry
During the saturation phase of backfill specimens in the Rowe’s cell compacted at a dry specific weight of 16.6 kN/m3, some outgoing water was collected and chemically analysed. The results of the chemical analyses are shown in tables 3.11 and 3.12 (chapter 3). From the chemical tests, it was observed that chloride transport was approximately conservative and how important the exchange process between Na+/Ca2+ was. Therefore, sodium bentonite was transforming into a calcium bentonite. After the experimental works by Lehikoinen et al. (1997), Muurinen & Lehikoinen (1998a) and Muurinen & Lehikoinen (1998b) studying the geochemical behaviour of compacted MX-80 sodium bentonite, the measured chemical concentrations in the collected water from the oedometer tests were higher than the real pore fluid ones obtained by squeezing, for instance.
Three values of backfill intrinsic permeability were estimated after oedometer tests at a void ratio of 0.4, 0.54 and 0.6 when salinity of water used to saturate the specimens was changed (tap water, 6 g/L and 16 g/L). Due to low content of bentonite of this mixture, range of salt concentration and scarce geochemical information available, it was assumed that the predominant chemical components in the pore fluid of the mixture came from the injected water. Nowadays, further studies of backfill geochemical initial conditions are being carried out to improve this hypothesis, but in this work, salt concentration in the injected water was used to update the intrinsic permeability due to low bentonite content and range of salt concentrations. Figure 5.4 shows the so-obtained expression that relates the pore fluid chemistry and the hydraulic conductivity. An empirical model of the intrinsic permeability (13) was proposed by introducing a linear dependency of natural logarithm of hydraulic conductivity on void ratio and concentration of chemical species in pore fluid.
(
)
(
)
0
1 0 2 0 3
* 0
ln = - i i
i
k
e e C C
k α α α
+ − +
∑
(13)Where α1, α2 and α3 are the coefficients of the model. They can be calculated from fitting
flow tests by means of back-analysis. k0 is the current intrinsic permeability depending on
void ratio and salt concentration in pore fluid, e is the void ratio, e0 is the initial void ratio, k0*
is the intrinsic permeability at the initial chemical and mechanical conditions, i
(
)
(
)
* 2( 0)(
)
0 0
C C
r r
k k
p ρ k γ p ρ k eα γ p ρ
µ − µ
= − − = − A A − = − A A −
A A A A A A A A
A A
q K ∇ g I ∇ g ∇ g (14)
Where qA is the advective flow of liquid phase, KA the hydraulic conductivity tensor, I the identity tensor. pA the liquid pressure, g the gravity vector, krA is the liquid phase relative
permeability law depending on the effective degree of saturation (Se), µA is the viscosity of the
liquid phase, γA is the specific weight of the liquid phase, ρA is the density of the liquid phase,
C is the total molar concentration of salts in the liquid phase, * 0
k is the intrinsic permeability when C = C0 2
0 0 0
Na+ Ca + Cl−
= + + from table 5.4, and α2 is the chemical parameter
obtained from the empirical model of intrinsic permeability. As it was previously said the other parameters, α1 and α3, were assumed as zero and no mechanical influence was
considered on backfill hydraulic conductivity.
The model used to compute the liquid phase relative permeability was proposed after Nielsen et al. (1986) depending on the effective degree of saturation. This model has an experimental parameter, m.
2 1
1 1
m m
r e e
k S S
= ⋅ − −
A (15)
Where Se is the effective degree of saturation.
5.5.2 Osmotic suction.
Osmotic suction was studied by analysing bentonite-sand mixtures, because of the grain size of the backfill. Total suction of specimens of MX-80/sand mixture (30/70 by mass) mixed with water containing 6 g/L of salt and saturated with water containing 16 g/L of salt and compacted at a dry specific weight of 16.6 kN/m3 was measured by means of psychrometers. Total suction measured at the saturated state was 1.7 MPa (figure 3.43, chapter 3). Since the specimens were already saturated, total suction measured in such conditions was assessed as the osmotic suction of the sodium bentonite – sand mixture and, as an extension, as backfill osmotic suction. The main hypothesis assumed is that osmotic suction was independent of soil structure. However, measured osmotic suction close to saturation in some psychrometers is around 1 MPa (Goudarzi et al. 2002). This value could be unrealistic and low, but also it could be only a measurement of total suction before chemical equilibrium would have been reached.
1 1 0 1 g r e s r p p S S S
S S p
λ λ − − − − = = + − A A A A A (16)
SA is the degree of saturation of the liquid phase, SrA is the residual degree of saturation and SAs is the maximum of the degree of saturation, pg is the gas pressure, pA is the liquid pressure,
and p0 and λ are the parameters of this model. The objective function was defined by using
the Van Genuchten model and the measured data following the same procedure as detailed in chapter 4 in order to back-analyse the parameters of this mathematical model. The minimum of the objective function was determined and the parameters (p0 and λ) obtained. The best fit of the experimental results was obtained by using the following parameters: p0 = 0.105 MPa,
λ = 0.205. Residual water content was 2% and therefore, the value of the residual degree of saturation, SrA, was 0.10 and SAs = 1. Figure 5.6 shows the objective function and its minimum. The main assumed hypothesis was that backfill void ratio was constant during the experimental determination of the wetting retention curve. This is not true because of the experimental procedure is under free swelling conditions. Figure 5.7 shows the best fit of backfill matric suction by means of the van Genuchten model.
5.5.4 Non-advective transport.
Dispersive and diffusive fluxes were calculated using Fick’s law. The non-advective flow of solute i in the liquid phase, ji, is expressed as
ji = −DA∇Ci = −
(
φρ τA AS DmI+ρADA')
∇Ci (17)where τ is the soil tortuosity, φ is the soil porosity, Dmis the molecular diffusion and DA'is the mechanical dispersivity tensor defined by (18) depending on the longitudinal and transverse dispersivities of solutes, dl and dt, in the liquid phase respectively.
'
(
)
t
t l t
d d d
= + − A A
A A
A q q
D q I
q (18)
Due to the importance of the non-advective transport of chemical species (controlled by the soil diffusion), some attention was paid to this parameter and its influence on the calculations. Backfill diffusion of ions has not been experimentally determined and it is a challenging task. It is expected that effect of granite is not important at this bentonite content as concluded by Mingarro et al. (1991) in mixtures of an illitic clay and crushed granite and montmorillonite and crushed granite rock.
wetting process with water and because pores were then filled with water and not air as in the dry state. Bentonite or clay content is an important parameter to take into account when studying diffusion, however, from the results by Miehe et al. (2000) when bentonite content was higher than 25%, gas diffusivity was more or less constant. It could be concluded that diffusive behaviour is not dependent on the bentonite content when it is higher than 25 or 30% of the mixture (by weight). This result is supported by the clogging properties of bentonite in mixtures as observed in 20/80 Kunigel sodium bentonite-sand mixtures after MIP tests performed in dry compacted soil specimens and MIP tests in the same specimens after wetting (Romero et al. 2002).
Herein, diffusion of pure MX-80 bentonite was used in the simulations. Two different values of diffusion were used. The first one was obtained by Kim et al. (1993) after NaCl diffusion tests in compacted and saturated specimens of pure MX-80 sodium bentonite. Backfill molecular diffusion chosen after the diffusion tests performed by the authors was of 2·10-10 m2/s corresponding to diffusion of Cl−at a bulk density of 11.4 kN/m3. Figure 5.9 shows the evolution of the chloride diffusion at different bulk densities after Kim et al. (1993). It is clear that the higher the density, the lower the diffusion. The other value was chosen one order of magnitude higher than the measured by Kim et al. (1993) in order to study its influence on the results. This higher value is justified because of measured Na+ molecular diffusion in compacted specimens of pure MX-80 at a dry specific weight of 17.6 kN/m3 (Pusch et al. 1989) was 2·10-10 m2/s, therefore, it is expected that Na+ diffusion could be higher at lower dry densities.
5.6 NUMERICAL SIMULATION OF A SERIES OF WATER UPTAKE TESTS.
Clay Technology (1999) performed some series of water uptake tests (WUT) at different salt concentrations to study the backfill hydration process and the influence of saltwater content on unsaturated hydraulic conductivity. Dynamically compacted backfill specimens (5 layers) of 10 cm at initial water content from 10% to 13% were saturated at atmospheric pressure with different waters. The initial dry specific weight of these specimens was 17.1 kN/m3 (void ratio of 0.54). Tests hydrated with 16 g/L saltwater were simulated by UPC in order to estimate the potential coefficient of the liquid phase relative permeability (m, equation 15) and the intrinsic permeability (k0*, equation 13).
estimated hydraulic conductivity from the oedometer tests was 2.5 times bigger than the estimated one fitting the results of the WUT.
As it was expected, the effect of diffusion on the evolution of hydraulic conductivity has proven to be important in this problem, since the evolution of intrinsic permeability was dependent on the non-advective flow of solutes. In this respect, the correct determination of backfill ion diffusion and longitudinal dispersivity would be important when reactive transport is considered. Figure 5.11 shows the evolution of computed total concentration and figure 5.12 shows the evolution of the intrinsic permeability. Intrinsic permeability reached a maximum close to the water inlet after 3000 hours, decreasing when solutes were transported due chemical gradient in the soil. Calculated time for full specimen saturation was 5000 hours, however, chemical equilibrium was reached after 9000 hours. Figures 5.13 and 5.14 show the calculated time evolution of intrinsic permeability and degree of saturation in different points of the backfill.
When backfill diffusion was increased up to 2·10-9 m2/s, the results were significantly different. The fit was even much better than the previous results when backfill diffusion of 2·10-10 m2/s was used. Figure 5.15 shows the evolution of water content. Figures 5.16 and 5.17 show the evolution of intrinsic permeability, which is different from the evolution calculated by using the lower diffusion. When lower diffusion is used, no peak of intrinsic permeability is observed. Figure 5.18 shows the evolution of the degree of saturation. Time of saturation is approximately 6000 hours and chemical equilibrium is reached after 5500 hours. The saturation process is a little bit longer than the one simulated by using the lowest diffusion. Additionally, for the analysis using the lower diffusion, backfill intrinsic permeability showed a peak on its evolution close to the water inlet and then the saturation process was faster (figures 5.13 and 5.14). The peak in the evolution of intrinsic permeability is not observed in figure 5.17 (higher backfill diffusion).
To prevent numerical oscillations in the finite element solution, the local Peclet number should be less than or equal to two (Huyakorn & Pinder, 1983). This number is defined by (19) for the numerical scheme that approaches the problem in a one-dimensional geometry and by using equations (17) and (18).
2 2 2 2
m t
e
h
S D d k
q x D D x
P x h h D q k k x x φρ τ ρ + ∂ ∆ ∂ = ≤ → ∆ ≤ = = ∂ ∂ ∂ ∂
A A A
A A A
A A
(19)
Where DA is the effective diffusion in a one-dimensional problem, k is the hydraulic conductivity and h is the total water head. Therefore, the length of the elements was chosen in agreement with this condition. The time-step size was chosen by imposing that the local Courant number is less than or equal to one (Huyakorn & Pinder, 1983). This number is defined by (20) for the numerical scheme.
Co q t 1 t S R x S R x h
S R x q
k x φ φ φ ∆ ∆ ∆ = ≤ → ∆ ≤ = ∂ ∆ ∂
A A A
A A
Where ∆t is the size of time step, SA is the degree of saturation, φ is the soil porosity and R is a
factor that depends on the transport problem and mainly of the chemical reactions considered in the problem (R = 1 if conservative transport is solved and R is bigger than one when reactive transport is solved).
5.7 NUMERICAL SIMULATION OF THE BACKFILL SATURATION PROCESS AT ÄHRL
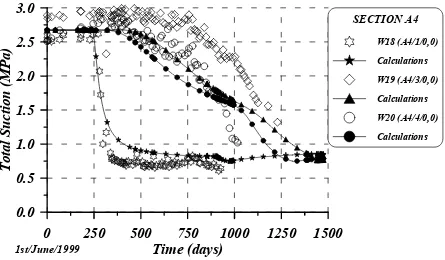
Wescor PST-55 psychrometers are being used to monitor the evolution of backfill total suction in the ZEDEX gallery. Evolution of total suction measured by 6 psychrometers in sections A3 and A4 was simulated. The mats surrounding these two sections are D3, D4 and D5. The history of the evolution of the injected water pressure of all mats is shown in figure 5.19. Injected water pressure at mats was at the beginning of the saturation process lower than 0.1 MPa to prevent backfill hydraulic fracture. Due to headwater loses and different problems related to such an in-situ test, important variations of water pressure at mats were monitored (Goudarzi et al. 2002). Owing to the slow saturation process, water pressure at mats was increased up to 0.5 MPa after some leakages that appeared in the concrete plug were solved. Figure 5.20 shows the geometry of the two-dimensional problem solved. Only backfill was considered in these two-dimensional calculations. Granite rock and altered granite rock were not considered because of their little influence on the saturation process as it was also checked in the inner part of the backfill. It is necessary to point out that dry specific weight at specimens used to perform the water uptake tests was 17.1 kN/m3, however, the compaction of backfill in the ZEDEX gallery provided smaller dry specific weights close to 16.6 kN/m3 or lower (chapter 2, figure 2.12). Thus, it is expected a higher backfill intrinsic permeability to simulate the saturation process than intrinsic permeability back-analysed from the water uptake tests (3.5·10-19 m2, figures 5.10 and 5.15). Evolution of measured total suction in 6 psychrometers in sections A3 and A4 is shown in figures 5.21 and 5.22. The initial total suction of the backfill is around 2.7 – 3.0 MPa. Close to saturation, total suction provided by Wescor psychrometers could be not realistic if free water has come into the device.
Backfill initial matric suction was assumed as 2.3 MPa corresponding to an initial degree of saturation of 50.5% (w = 11%), which is in agreement with values measured by Clay Technology when studying backfill matric suction. Temperature at the ZEDEX gallery is more or less constant to 15ºC (Clay Technology, 2002). This value was used to compute the osmotic suction. Initial osmotic suction is 0.37 MPa computed by using the geochemical initial conditions and temperature in the gallery. Assumed geochemical initial conditions for the two-dimensional simulation were the same as the one-dimensional simulations (table 5.4). Backfill parameters were the same as those obtained after the one-dimensional calibration although mechanical dispersivity was changed for the two-dimensional simulations because of its dependence on the geometry. However, backfill hydraulic conductivity was slightly increased in the two-dimensional simulations in order to account for the lower backfill dry specific weight in situ if compared with dry specific weight measured in the specimens prepared for the water uptake tests. Backfill diffusion was set to 2·10-10 m2/s and 2·10-9 m2/s to compare the effects of molecular diffusion on the results. Backfill parameters are summarised in table 5.5. Evolution of injected water pressure at mats D3, D4 and D5 was previously shown in figure 5.19. Water injected contained 16 g/L of salt (table 5.2).
Ion exchange reaction
/ Na Ca
k = 0.4
CEC (meq/100g)
20.94
* 0
k (m2) 7⋅10-19
α2 3.5
Advective flow
m 0.6
τ 1.0
Dm (m2/s) 2·10-10 2·10-9
Non-advective flow
l t
d =d (m) 0.12
0
p (MPa) 0.105
λ 0.205
Srl 0.10
Retention curve
Sls 1.00
Table 5.5: Backfill parameters used in the two-dimensional simulations. Backfill parameters used in the 2D simulations were the same as those used in the simulation of the water uptake test with 16 g/L, excepting backfill mechanical dispersivity, due to its dependency on the geometry, and k0* because of the reduction of average dry specific weight at the backfill compacted in situ at the ZEDEX gallery.
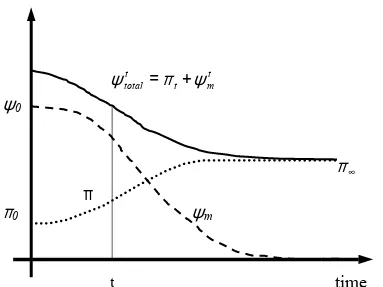
Matric suction was calculated by the code and osmotic suction was calculated by means of Van’t Hoff equation (21) by using total concentrations of salts in the nodes computed by the code.
(
_)
(
_)
i t i m
i i
RT C RT C CODE BRIGHT CODE BRIGHT
π =
∑
→ψ =∑
+ψ (21)Nevertheless, when backfill diffusion was higher the comparison showed better results. Only backfill molecular diffusion was different in both cases.
Both sections are fully saturated after 1530 days from the beginning of the saturation process for the low molecular diffusion and after 1570 days when using the high backfill molecular diffusion. Initial equivalent fractions of NaX and CaX2 are 0.55 and 0.45 as it was shown in table 5.4. Figures 5.28 and 5.29 show the evolution of the equivalent fraction of the exchangeable cation NaX defined as equation (11) for both diffusions and figures 5.30 and 5.31 the evolution of the equivalent fraction of the exchangeable cation CaX2 for both diffusions after 1450 days of the beginning of the saturation process. It can be observed an increase in the adsorbed Ca2+ concentration in the solid phase and a reduction of Na+ in the solid phase (bentonite losses sodium). The sodium bentonite is being transformed into a calcium bentonite due to the exchange of sodium/calcium. This transformation may change the backfill behaviour if a long-term perspective is studied. Figures 5.32 and 5.33 show the molar concentration of Na+ in the liquid phase for both diffusions. Figures 5.34 and 5.35 show the molar concentration of Ca2+ in the liquid phase for both backfill diffusions used in the calculations as well.
Figure 5.36 shows the intrinsic permeability calculated after 1450 days of saturation for the low backfill molecular diffusion and figure 5.37 for the high backfill diffusion. Evolution of this intrinsic permeability presented important variations, pointing out the molecular diffusion influence on reactive transport problem. Figure 5.38 shows the backfill osmotic suction calculated by means of Van’t Hoff equation for the low molecular diffusion and figure 5.39 for the high molecular diffusion. The final osmotic suction is a little bit far from the measured values (1.7 MPa, in MX-80/sand mixtures) and far from the value provided by sensor W18 (A4/1/0,0). However, the total suction measured before the psychrometer broke down, around 1.0 MPa, could be not realistic because values provided by this kind of psychrometer are not reliable when free water gets into the sensor and chemical equilibrium might have not been reached at that moment.
These calculations show clearly that non-advective flow is the main mechanism controlling the transport of the chemical species. Two different values of molecular diffusion were used in the calculations to check out its importance. It was proved that if backfill diffusion is low it could happen that backfill is fully saturated, but chemical equilibrium may be still far from being reached. This could introduce a non-homogeneous backfill intrinsic permeability distribution. The non-homogeneous distribution may affect the saturated flow tests that will be performed in 2003 and 2004.
In order to take into account the effects of the host rock, some simulations were performed with granite. Figure 5.40 shows the geometry when host rock was considered. Granite was always saturated and there were two areas: a part where granite was non-altered and another area where granite was fractured and damaged after the blasting (Excavation Disturbed Zone - EDZ). The same backfill parameters were used in these calculations and parameters of granite are shown in table 5.6. Granite was assumed inert in these calculations.
effectiveness of the calculations was improved, and lower convergence problems appeared. Moreover, a smaller mesh could be used and CPU time required for the calculations was optimised.
GRANITE ALTERED GRANITE
BACKFILL
Ion exchange reaction
/ Na Ca
k = 0.4
CEC (meq/100g)
0.0 0.0 20.94
* 0
k (m2) 1⋅10-17 1⋅10-16 7⋅10-19
α2 0.0 0.0 3.5
Advective flow
m 0.6 0.6 0.6
τ 1.0 1.0 1.0
Dm (m2/s) 2.5⋅10-10 2.5⋅10-9 2·10-9
Non-advective flow
l t
d =d (m) 0.120 0.120 0.120
0
p (MPa) 100.0 100.0 0.105
λ 0.195 0.195 0.205
Srl 0.100 0.100 0.101
Retention curve
Sls 1.000 1.000 1.000
Table 5.6: Material properties used in the two-dimensional simulations when host rock was considered. Granite intrinsic permeability was obtained after Stenberg & Gunnarsson (1998).
5.8 SATURATED FLOW TESTS AT THE ZEDEX GALLERY
In order to check the effects of a non-homogeneous distribution of the intrinsic permeability, owing to its variation with total salt concentration in pore fluid a saturated flow test was simulated in agreement with the expected protocol of flow tests that will be carried out in the ZEDEX gallery throughout 2003 and 2004.
Clay Technology AB is planning to decrease the salinity of the injected water up to 12 g/L after full saturation of the backfill at the ZEDEX gallery. This value is supposed to be the salinity of the surrounding aquifer at Äspö, however, water salinity depends on the fracture water is collected from and the time water has been stored in that fracture.
Evolution of osmotic suction, calculated by means of Van’t Hoff equation, is shown in figure 5.45. Equivalent fraction of the exchangeable cation NaX is depicted in figure 5.46 and equivalent fraction of exchangeable cation CaX2 evolution is shown in figure 5.47. From these figures, it can be seen that the model predicts the transformation of the sodium bentonite into a calcium bentonite. The transformation process is very slow and strongly dependent on molecular diffusion. It was also checked out that salinity in injected water controls the pore fluid chemistry at long term. Figures 5.48, 5.49 and 5.50 show the evolution of ions Na+, Ca2+ and Cl- in pore fluid.
It is possible to calculate an equivalent global intrinsic permeability from the total flow rate of water collected at mat D4 (figure 5.43) at, for instance, 333 years after the beginning of the saturation process for both molecular diffusions. If gravity is disregarded in those calculations and two-dimensional effects are not considered, the flow of rate divided by two will be the approximate flow rate of water coming from one of the sections.
3 9
18 2
0 4 0 4 2 6 1 1
4
3 9
18 2
0 4 0 4 2 6 1 1
4
2.96·10
· · 1.39·10
2 7.8 ·8.23·10 ·33.2
2.93·10
· · 1.37·10
2 7.8 ·8.23·10 ·33.2
low diff lowdiff eq eq A A A high diff high diff eq eq A A A m Q s
S k h k m
m m s
m
Q s
S k h k m
m m s
γ µ γ µ − − − − − − − − ∇ → = = ∇ → = = A A A A (22)
Where S is the total surface of the mats (7.8 m2), µA is the liquid dynamic viscosity, γA is the liquid specific weight and ∇h is the total head gradient (33.2). The ratio between the specific weight and the viscosity was assumed as 8.23·106 m-1s-1 corresponding to viscosity of pure water at 15ºC and liquid density of an aqueous solution 2% of mass of NaCl (Lide & Frederikse, 1997). Both equivalent permeabilities are similar as it was expected from the evolution of the collected flow of rate at mat D4 for both backfill molecular diffusions.
It is possible to estimate an equivalent intrinsic permeability if water perpendicularly flows in 1D conditions across N layers of soil (equation 23). Each layer of soil has its own intrinsic permeability, k0i, and its thickness, li.
1 0 1 0 N i eq i N i i i l k l k = = =