c
World Scientific Publishing Company DOI:10.1142/S0219477511000661
DIFFERENCES IN THE STABILITY OF THE HEART INTERBEAT RATE DURING
WAKE AND SLEEP PERIODS
R. HERN ´ANDEZ-P ´EREZ∗
SATMEX. Av. de las Telecomunicaciones S/N CONTEL Edif. SGA-II. M´exico, D.F. 09310, M´exico
L. GUZM ´AN-VARGAS†and I. REYES-RAM´IREZ‡
Unidad Profesional Interdisciplinaria en Ingenier´ıa y Tecnolog´ıas Avanzadas, Instituto Polit´ecnico Nacional Av. IPN No. 2580, Col. Ticom´an, M´exico D.F. 07340, M´exico
†[email protected] ‡[email protected]
F. ANGULO-BROWN
Departamento de F´ısica, Escuela Superior de F´ısica y Matem´aticas, Instituto Polit´ecnico Nacional Edif. No. 9 U.P. Zacatenco, M´exico D. F. 07738, M´exico
Received 3 June 2011 Accepted 29 August 2011
Communicated by Jordi Garcia-Ojalvo
The Allan (ADEV) and Hadamard (HDEV) deviations are mathematical tools devel-oped in the field of time and frequency metrology to define quantitatively the frequency instabilities of an oscillator; which consist of any unwanted departure from its nominal frequency value over a specified time interval. We use both deviations to analyze the stability of the heart interbeat rate for healthy subjects and patients with congestive heart failure (CHF) during wake and sleep periods. We find that the ADEV and HDEV profiles for the subjects in the CHF group exhibit remarkably different trends between wake and sleep periods, namely, larger dispersion between the results for each member of the group while the results for the healthy subjects show some uniformity across the members of the group. Moreover, we observe that the stability for both groups degrades for low scales during the sleep phase, being more significant for the CHF group. Both ADEV and HDEV statistics reveal that healthy data can be described by more uniform
∗Associated to Complex Systems Lab., UPIITA-IPN.
deviation values along several scales, particularly for the wake period, whereas CHF data shows important variations.
Keywords: Cardiac dynamics; heart rate stability; Allan variance.
1. Introduction
Analysis of heart rate variability shows that heart rate is influenced by different frequency components derived from different parts of the autonomous nervous sys-tem [1]. Recent evidence of studies of heart rate variability indicates that healthy systems display highly irregular dynamics with multifractal character even at rest, and that subjects with congestive heart failure exhibit changes in this multifrac-tality [2]. Different studies have been conducted on heart interbeat, which have revealed multifractality [3] and have showed quantitative differences in the statis-tical and correlations properties, as well as spectral analysis, between healthy and diseased subjects [4–6].
The Allan variance (AVAR) was introduced in the field of time and frequency metrology to quantitatively characterize the frequency fluctuations observed in pre-cise frequency standards, which exhibit nonstationarities that are not satisfactorily treated with conventional statistical tools, such as the classical standard devia-tion [7]. And it has become a standard to define quantitatively the frequency instabilities of an oscillator, which consists of any unwanted departure from its nominal frequency valueν0. That is, frequency stability is the degree to which an oscillator produces a constant frequency over a specified time interval [8]. More-over, the Hadamard variance (HVAR) was introduced as a generalization of the AVAR to perform high resolution spectral analysis of the frequency deviations of an oscillator [9].
Some previous studies have approached heart interbeat by using a measure based on the Allan variance: the so-called Allan factor (AF) calculated over the number of beats counted in boxes of lengthT, considering the heart beat dynamics as a point process [10,11]. However, this approach does not use the property of the AVAR to quantify the frequency stability of a precise oscillator. In previous studies, our group has introduced the use of the AVAR to analyze the stability of heart interbeat, by performing an analysis of scaling differences in excursions between wake and sleep periods [12] and the dynamic analysis to study the evolution of stability in time and scales [13], using the dynamic AVAR [14].
2. Methods
2.1. Allan variance
The normalized frequency deviationy(t) of an oscillator is defined in terms of the nominal oscillator frequency ν0 and the instantaneous frequency ν(t) as: y(t) = (ν(t)−ν0)/ν0 [7]. The AVARa is given by the expression [7]:
σ2y(τ) =
1
2(¯yt+τ−y¯t)
2, (1)
where τ is the observation interval, the operator · denotes time averaging and the average frequency deviation. ¯yt is defined as ¯yt = 1τtt+τy(t)dt. In discrete time, the AVAR is computed with the following estimator [7]:
ˆ
σy2[k] =
1 2(M −2k+ 1)
M−2k+1
i=1
(¯yk[i+k]−y¯k[i])2, (2)
where M is the total number of data points,τ0 is the minimum observation time interval, and the integerk=τ /τ0 represents the discrete-time observation interval typically taking valuesk= 1,2, . . . , kmax, withkmax=N/3b (where· denotes integer part), and the averaged frequency values are given by ¯yk[i]≡ 1kji+=ki−1y[j]. For signals with a power spectral density of the formSy(f) ∼fβ, the AVAR exhibits a power-law behavior: σ2
y(τ) ∼ τη, where the exponents are related by η = −β−1 for −2 ≤ β ≤ 0 [7]. The Allan deviation (ADEV) is defined as the square root of the AVAR, and the scaling relation can be written also as:
σy(τ)∼τη/2∼τµ, (3)
with −0.5 ≤µ ≤0.5, whereµ = −0.5 corresponds to white noise, µ= 0 to 1/f noise and µ = 0.5 to Brownian motion.c This property allows the identification
of certain stochastic components in the signal, through the determination of the scaling exponents [7,15]. For instance, the ADEV for a 1/fnoise will look as a flat line in the double logarithmic plane σy(τ) vs. τ, which suggests that for a signal of this type, the ADEV is around the same value for the different time scales. In some cases, the input time series is a superposition of different components with power-law spectral density Sy(f) = Pi=1Aifβi, where P is the number of noise
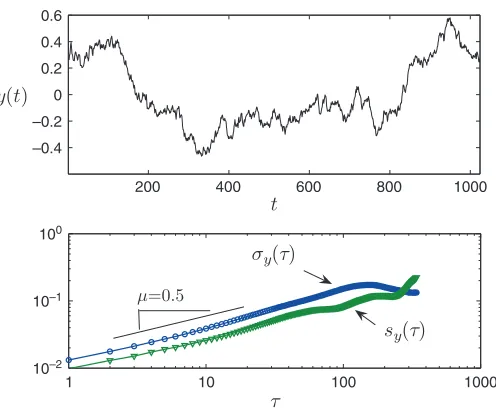
types considered andAiare constants. For this type of input time series, the ADEV will beσy(τ) =Pi=1Biτµi, where theBi are constants. Figure1shows the Allan
deviation (σy(τ)) calculated for a synthetic time-series.
aWe use theoverlapping version of the AVAR, which increases the number of data points used for the estimation of the AVAR, improving the quality of the estimation [7].
bThis selection fork
maxis a convention extensively used in the time and frequency metrology field, and it is related to the uncertainty in the estimation of the AVAR, which for a given averaging time is proportional to the number of differences that contribute to it.
200 400 600 800 1000 –0.4
–0.2 0 0.2 0.4 0.6
1 10 100 1000
10–2 10–1
[image:4.595.167.415.169.375.2]100
Fig. 1. A synthetic Brownian motion time-series and its corresponding computation of ADEV (σy(τ)) and HDEV (sy(τ)). It shows the corresponding value for the scaling coefficient µ= 0.5 (Eq. (3)). In this example, the observed curvature starting at around the observation interval τ= 100 is due to finite size effects, since at these values there are less data points available for the estimation of both the ADEV and HDEV, making them poorer statistics.
2.2. Hadamard variance
The Hadamard variance (HVAR), which we will denote bys2
y(τ), was introduced
as a generalization of the AVAR to perform high resolution spectral analysis of the frequency deviations of an oscillator [8,9], and it is a three-sample variance, which computes a second difference of the frequency deviation data, which cancels out linear drift in the data [15]. The HVAR is defined by:
s2y(τ) =
1
6[(¯yt+2τ−y¯t+τ)−(¯yt+τ−y¯t)]
2, (4)
with the same terminology and notation as for the AVAR. In discrete time, the HVARd is computed with the following estimator [16]:
ˆ
s2y[k] =
1 6(M −3k+ 1)
M−3k+1
i=1
(¯yk[i+ 2k]−2¯yk[i+k] + ¯yk[i])2. (5)
The Hadamard deviation (HDEV) also exhibits a scaling property when applied to signals with power-law spectral densities, namely:
sy(τ)∼τζ/2∼τλ, (6)
where the exponents satisfy a relation similar to the one for the Allan variance, namelyζ=−β−1, for−2≤β ≤0 [17]. Figure1 shows the Hadamard deviation (sy(τ)), calculated for a synthetic time-series.
3. Stability of Heart Rate
The problem in the study of frequency stability is how to characterize the properties of the output signal from a real oscillator [18]. The output signal from an ideal noise-free non-drifting oscillator would be a pure sine wave, but any real device, even the most precise, is disturbed by unavoidable processes such as random noises, drifts due to aging and/or environmental effects. In the present work we use the approach introduced in a recent study [13], which identifies the heart with an oscillator and consequently, the heart interbeat rate fluctuations are mapped to the frequency deviations of an oscillator. The input signal is the duration of the interbeat interval, and it is indexed by the interval number, on which the definition of the “scales”τ in the AVAR is based. Thus, the stability is referred to the variation in the duration of the interbeat interval for different “scales”. Then, instead of talking about the stability in a certain time intervalτ, we talk about the stability at certain number
kof interbeat intervals [13].
The concept of homeostasis, that refers to the tendency of biological systems to maintain a relative constancy of the internal environment after perturbations, suggests that physiological variables, such as the cardiac interbeat interval, maintain an approximately constant value in spite of continual perturbations [19]. Therefore, homeostasis is strongly related to the stability of the heart interbeat interval rate, where stability refers to the degree to which an oscillator produces a constant frequency over a specified time interval [8]. It is plausible that this approach could provide some insights about the stability of the heart signals for both healthy and diseased groups in wake and sleep periods, and in particular, for revealing differences between these periods.
4. Results and Discussion
We analyze RR interval sequences from two groups: 16 healthy subjects and 12 subjects with congestive heart failure (CHF) [20], during wake and sleep ECG records with length of 6 hours corresponding to approximately 3×10⁴ beats (see Fig.2for the representative time series for both groups at wake and sleep periods). This set of records have been used in previous studies [5, 12,13,21]. We compute both ADEV and HDEV for the wake and sleep records for each group. Figures3
0 10000 20000 0.5
1 1.5 2
0 10000 20000
0.5 1 1.5 2
0 10000 20000
0.5 1 1.5 2
Beat Number
RR Interval
0 10000 20000
0.5 1 1.5 2
Healthy, wake
Healthy, sleep
CHF, wake
[image:6.595.120.432.156.370.2]CHF, sleep
Fig. 2. Representative time series for both groups and for both wake and sleep periods.
10–3
10–2
10–1 Allan deviation
Wake
100 102 104
Hadamard deviation
Wake
100 102 104
10–3
10–2
10–1
(a) (c)
100 102 104
10–1
10–2
10–1
Sleep
100 102 104
10–3
10–2
10–1
Sleep
(b) (d)
[image:6.595.122.460.402.718.2]100 102 104 10–3
10–2
10–1 Allan deviation
Wake
10–3 10–2 10–1
100 102 104
Hadamard deviation
Wake
(a) (c)
Sleep
10–3 10–2 10–1
100 102 104
10–3 10–2 10–1
100 102 104
Sleep
[image:7.595.125.479.171.516.2](b) (d)
Fig. 4. Stability analysis of the heart interbeat for CHF patients for wake and sleep periods. For better visualization, only values of the interbeat interval indexkthat are powers of 2 are shown.
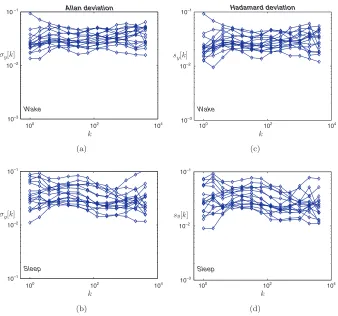
The Kolmogorov-Smirnov (K-S) test is used to accept or reject the null hypoth-esis that both the ADEV and the HDEV of any pair of subjects in the same group and for the same period (wake or sleep) each has the same distribution. We found that for both datasets and at 5% level of significance, we accept the null hypothesis that both the ADEV and the HDEV values for any two subjects in the same group at the same period (wake or sleep) each has the same distribution in most of the cases, suggesting that one can pool the data from all subjects in the same group at the same period to improve the statistics for each of the deviations. For each group, we calculate the average value of the ADEV and HDEV at each phase, which both look very similar (see Fig.5). The CHF group exhibits significant changes in both deviations between wake and sleep periods, as shown in Fig.6for the ADEV.
100 102 104 10–3
10–2
10–1 Allan deviation
Wake
CHF Healthy
10–3 10–2 10–1
100 102 104
Hadamard deviation
Wake
Healthy
CHF
(a) (c)
10–3 10–2 10–1
100 102 104
Sleep
Healthy
CHF
10–3 10–2 10–1
100 102 104
Sleep
Healthy
CHF
[image:8.595.115.467.161.506.2](b) (d)
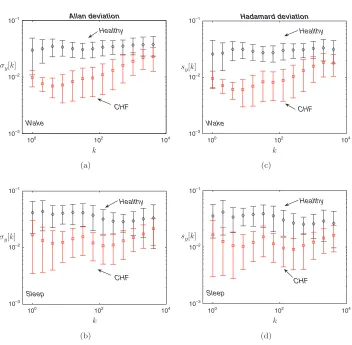
Fig. 5. Average values of ADEV (left column) and HDEV (right column), including dispersion, for the healthy (♦) and diseased () groups, for wake (a), (c) and sleep (b), (d), respectively. For better visualization, only values of the interbeat interval indexkthat are powers of 2 are shown.
100 102 104 10–3
10–2 10–1
k σy[k]
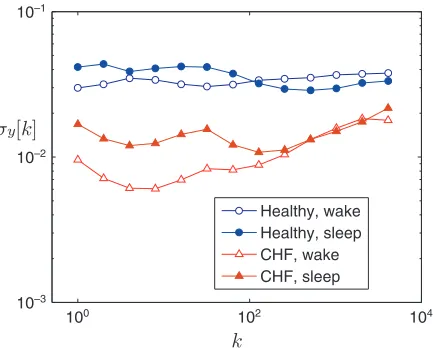
[image:9.595.189.406.174.351.2]Healthy, wake Healthy, sleep CHF, wake CHF, sleep
Fig. 6. Average values of ADEV for both groups during wake and sleep periods.
exhibit a convex trend starting at approximately the scale of 60 beats, whereas for scales lower than that, the values for the healthy group are approximately constant while for the CHF group they exhibit a convex trend. Also, as shown in Fig.6, the ADEV increases for both groups during the sleep period for the scales in the first two decades, being more significant for the CHF group. This increase in the ADEV implies a degradation of the stability of the heart interbeat rate during the sleep period. Previous studies have also reported similarities between both groups during the sleep period. For instance, [22] reports that the scaling exponents obtained with the detrended fluctuation analysis (DFA) for the CHF group during sleep are close to the exponents observed for the healthy group. A plausible explanation for this observation is that the manifestation of heart failure would be most severe when metabolic demands are greatest, and least severe when metabolic demands are minimal, during rest or sleep [22]. In addition, it was reported that the observed scaling characteristics in the heartbeat fluctuations during sleep and wake phases are related to intrinsic mechanisms of neuratonomic control [22].
In addition, the presence of increasing values of ADEV/HDEV for the CHF group during the wake phase indicates a degradation of the stability of interbeat rate, suggesting a poorer response to maintain the homeostastic state during greater metabolic demands during the wake phase. In contrast, the healthy group displays more regular stability of the interbeat rate throughout the different scales, which is related to a better capability to maintain the homeostatic state. This is consistent with the findings reported in [23], where a feedback control framework is intro-duced,e showing that the heart rate variability (HRV) of healthy subjects reflects
100 102 104 10–3
10–2 10–1
Beat scale (k)
Deviation
[image:10.595.181.401.172.354.2]Healthy, ADEV Healthy, HDEV CHF, ADEV CHF, HDEV Wake
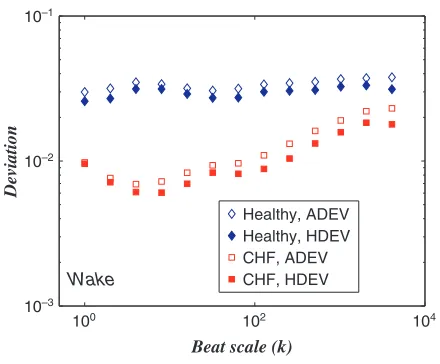
Fig. 7. Comparison of the average values of ADEV and HDEV for both groups during wake.
a cardio-respiratory system with the same robust frequency response during sleep and wake conditions. On the contrary, it is found that the HRV of CHF subjects reflects a cardio-respiratory system with a decreased sensitivity in a wide frequency range during both sleep and wake phases [23].
Figure 6 shows that the ADEV values for the CHF group are lower than that for the healthy group for all scales. According to [22], it has been reported that the standard deviation of the interbeat intervals during the sleep phase is lower than that for the wake phase. Since both ADEV and HDEV can also be interpreted as a multiscale deviation, our results indicate that both deviations are lower for the CHF group. In the context of time and frequency metrology, a lower value of ADEV/HDEV corresponds to higher stability. However, as mentioned above, the stability for the CHF group degrades for medium to large scales, for which both ADEV and HDEV display monotonic increase. Moreover, after comparing the results for ADEV versus HDEV (see Fig.7 for the wake period), we observe that the HDEV values for both phases are lower than the ADEV values for both groups, which could be a signature of the property of HDEV of removing linear trends in the signals.
5. Conclusions
periods. We find that the ADEV and HDEV profiles for the subjects in the CHF group exhibit remarkably different trends between wake and sleep periods, namely, larger dispersion between the results for each member of the group, while the results for the healthy subjects show some uniformity across the members of the group. The ADEV values for the CHF group display an approximately linear increase for medium to high scales, indicating a degradation of the stability. Also, we observe a degradation in stability for low beat scales in both groups during the sleep phase, which is more significant for the CHF group. The ADEV and HDEV statistics reveal that healthy data can be described by approximately uniform deviation val-ues along several scales, particularly for the wake period, which corresponds to the expected result for a 1/f noise, whereas CHF data show significant variations of the ADEV and HDEV values along beat scales.
Acknowledgments
This work was partially supported by CONACYT (Grant 49128-F-26020), COFAA-IPN, EDI-COFAA-IPN, M´exico. The authors wish to thank to the anonymous referee whose suggestions allowed the improvement of this manuscript.
References
[1] M. Moser, M. Lehofer, A. Sedminek, M. Lux, H. G. Zapotoczky, T. Kenner and A. Noordergraaf, Heart rate variability as a prognostic tool in cardiology, A
con-tribution to the problem from a theoretical point of view, Circulation 90 (1994)
1078–1082.
[2] P. Ch. Ivanov, L. A. N. Amaral, A. L. Goldberger, S. Havlin, M. G. Rosenblum, Z. R. Struzik and H. E. Stanley, Multifractality in human heartbeat dynamics,Nature399
(1999) 461–465.
[3] P. Ch. Ivanov, Q. D. Y. Ma, R. P. Bartsch, J. M. Hausdorff, L. A. Nunes Amaral, V. Schulte-Frohlinde, H. E. Stanley and M. Yoneyama, Levels of complexity in scale-invariant neural signals,Phys. Rev. E.79(2009) 041920.
[4] A. L. Goldberger, L. A. N. Amaral, J. M. Hausdorff, P. Ch. Ivanov, C. K. Peng and H. E. Stanley, Fractal dynamics in physiology: Alterations with disease and aging,
Proc. Natl. Acad. Sci.99(2002) 2466–2472.
[5] L. Guzm´an-Vargas and F. Angulo-Brown, Simple model of the aging effect in heart
interbeat time series,Phys. Rev. E.67(2003) 052901.
[6] Z. Gingl, P. Marka, L. Rudas, E. Z¨ollei and N. Cs´ık, Spectral analysis problems of heart rate and blood pressure fluctuations,Fluct. Noise Lett.7(2007) L143–L150. [7] D. W. Allan, Time and frequency (time-domain) characterization, estimation, and
prediction of precision clocks and oscillators, IEEE Trans. Ultras. Ferr. and Freq. Control34(1987) 647–654.
[8] J. Rutman, Characterization of phase and frequency instabilities in precision
fre-quency sources: Fifteen years of progress,Proc. IEEE66(1978) 1048–1075.
[9] R. A. Baugh, Frequency modulation analysis with the Hadamard variance, InProc.
25th Annual Symposium on Frequency Control, pp. 222–225, Atlantic City, NJ, USA, June 1971.
[10] R. G. Turcott and M. C. Teich, Fractal character of the electrocardiogram:
[11] G. M. Viswanathan, C. K. Peng, H. E. Stanley and A. L. Goldberger, Deviations from uniform power law scaling in nonstationary time series,Phys. Rev. E.55(1997) 845–849.
[12] L. Guzm´an-Vargas, I. Reyes-Ram´ırez, R. Hern´andez-P´erez and F. Angulo-Brown,
Scaling differences of heartbeat excursions between wake and sleep periods, in Meth-ods in Enzymology, Computer MethMeth-ods, Part C, Vol. 487, M. Johnson, ed. (Academic Press, 2010), pp. 409–430.
[13] R. Hern´andez-P´erez, L. Guzm´an-Vargas, I. Reyes-Ram´ırez and F. Angulo-Brown,
Evolution in time and scales of the stability of heart interbeat rate,Europhys. Lett.
92(2010) 68006.
[14] L. Galleani and P. Tavella, Characterization of nonstationary atomic clocks,Fluct. Noise Lett.7(2007) 461–471.
[15] S. Bregni and L. Jmoda, Accurate estimation of the Hurst parameter of long-range
dependent traffic using modified Allan and Hadamard variances,IEEE Trans. Comm.
56(2008) 1900–1906.
[16] W. J. Riley. The Hadamard Variance, 1999, Available online (http://www.wriley. com/paper4ht.htm).
[17] D. A. Howe, R. L. Beard, C. A. Greenhall, F. Vernotte, W. J. Riley and T. K. Peppler, Enhancements to GPS operations and clock evaluations using a “Total” Hadamard
variance,IEEE Trans. Ultras. Ferr. and Freq. Control52(2005) 1253–1261.
[18] J. Rutman and F. L. Walls, Characterization of frequency stability in precision
fre-quency sources,Proc. IEEE79(1991) 952–960.
[19] P. Ch. Ivanov, L. A. Nunes Amaral, A. L. Goldberger and H. E. Stanley, Stochastic feedback and the regulation of biological rhythms,Europhys. Lett.43(1998) 363–368. [20] A. L. Goldberger, L. A. N. Amaral, L. Glass, J. M. Hausdorff, P. Ch. Ivanov, R. G. Mark, J. E. Mietus, G. B. Moody, C.-K. Peng and H. E. Stanley, PhysioBank, Phys-ioToolkit, and PhysioNet: Components of a new research resource for complex phys-iologic signals,Circulation101(2000) e215–e220.
[21] I. Reyes-Ram´ırez and L. Guzm´an-Vargas, Scaling properties of excursions in
heart-beat dynamics,Europhys. Lett.89(2010) 38008.
[22] P. Ch. Ivanov, A. Bunde, L. A. N. Amaral, S. Havlin, J. Fritsch-Yelle, R. M. Baevsky, H. E. Stanley and A. L. Goldberger, Sleep-wake differences in scaling behavior of the human heartbeat: Analysis of terrestrial and long-term space flight data,Europhys. Lett.48(1999) 594–600.
[23] J. Alvarez-Ramirez, E. Rodriguez, J. C. Echeverria, A. de Luca and A. Velasco, Heart
beat dynamics during sleep and wake phases: A feedback control approach,Physica