Internet Self-Efficacy and Visual Search
Strategies: The Use of Eye Tracking Technology
in the Development of Web-Based
Learning Resources
Peter Eachus, Simon Cassidy, Sarah Norgate,
Lynne Marrow, and Leah Greene
University of Salford, Salford, UK
[email protected]
,
[email protected]
,
[email protected]
,
[email protected]
,
[email protected]
Abstract
Higher Education is increasingly relying on e-learning as a means of providing students with teaching and learning resources. Almost inevitably, this means that students interact with these learning resources through the medium of the computer screen. Although there have been signifi-cant advances in the design and implementation of on-line resources, exactly how students inter-act with these resources is a relatively new field of research. In this study, students were asked to interact with three types of virtual learning environment, i.e. BlackBoard, IngentaConnect and Wikipedia, while their eye movements were scanned and recorded using a Tobii 1750 eye track-ing system. The data gathered was analysed dynamically, statistically, and graphically in order to identify search patterns and “hot spots” within the online information source. The data was also correlated with a measure of Internet self-efficacy, the Web User Self-Efficacy scale (WUSE). Preliminary findings suggest that qualitative data obtained in this type of study may prove more useful than quantitative data.
Keywords: Eye tracking, Internet self-efficacy, visual search, e-learning
Introduction
Someone once said that the “eyes are the windows to the soul” but in eye tracking research they may best be considered as a portal to higher cognitive processes. The “camera” analogy that is often used in describing the human visual system is quite misleading. Far from being a passive receptor of visual information, the human eye has already started to process visual stimulation
before passing this information onto higher centres in the brain where it will be processed and meaning extracted.
The distribution of the light sensitive retinal elements, rods and cones over the surface of the retina is not even. The most sensitive region of the retina is approximately 1mm across and is densely packed with cones. This is the part of the retina that we use for looking at detailed visual stimulation. In order to Material published as part of this publication, either on-line or
read a sentence on a page the fovea must be tracked over the words sequentially. Tracking of the fovea is required not only in reading, but in the processing of any visual information where detail is important. Visual information processing is also occurring in the periphery of the retina, but for eye tracking researchers this is of less significance. A crucial question for researchers involved in eye tracking is concerned with what eye tracking can tell us about the way in which information is obtained from visual stimuli before processing at a higher level takes place. For human-computer interface (HCI) researchers this information is vital for the design of hardware and software that involves people interacting with computer systems.
Eye movement research has a relatively long history with the basic characteristics of eye move-ments being discovered between 1879 and 1920 (Rayner, 1998). Early research was often quite invasive with eye movements being tracked through devices that were in direct contact with the cornea. The first non-invasive technique was developed by Dodge and Cline in 1901 and used a method that involved reflecting light from the cornea. One of the first studies to examine the role of eye movements in a practical task was that of Tinker et al who in the 1930’s looked at the in-fluence of typeface, font size, and page layout on reading speed and patterns of eye movement (Tinker, 1963). At the end of the Second World War, human factors research was becoming in-creasingly important in the training of military personnel. Fitts, Jones, and Milton (1950) used motion picture cameras to capture the eye movements of pilots as they used the cockpit controls of their aircraft.
A difficulty with eye tracking research up until this time was that the head often had to be con-strained to prevent any movement that might confound the eye tracking data. The first head mounted eye tracker to overcome this problem was developed by Hartridge and Thompson (1948) and by 1958 Mackworth and Mackworth had developed a system that could record eye movements superimposed on the visual scene that was being viewed.
The use of eye tracking research in HCI, began in earnest during the 1980’s, with the advent of the personal computer. Before this time interaction with computers tended to be via punched cards or teletype and therefore the scope for eye tracking research was minimal. With personal computers came video screens and graphical user interfaces (GUI), thus providing eye tracking researchers with further opportunities.
The 1990’s saw greater technological advances with the Internet, email, video conferencing and of course computer games consoles. As the interfaces have become ever more complex, eye tracking research has found a niche in helping to answer questions about usability. How do the visual displays used in these technologies influence the manner in which people are able to inter-act with them?
Technologies Involved
The two basic types of eye tracking technology available to researchers are the head mounted sys-tems and those that are independent of the participant, for example, being positioned on the desk-top in front of the participant. Most systems rely on the use of infrared light that is reflected from the cornea and the retina in order to generate data that can then be used by the researcher to ex-amine the individual’s pattern of eye movements. In modern systems the manufacturers usually provide software that helps with the calibration of the system as well as the data collection. Al-though modern systems are quite easy to set up and to use, reliability can still be a problem and typically 10%-20% of people cannot be tracked reliably. Spectacles, contact lenses, ambient lighting and even seating arrangements can all cause reliability problems.
available (Figure 2) and these are particularly useful where the researcher is working with partici-pants who have to be active, e.g playing sport or moving around their environment.
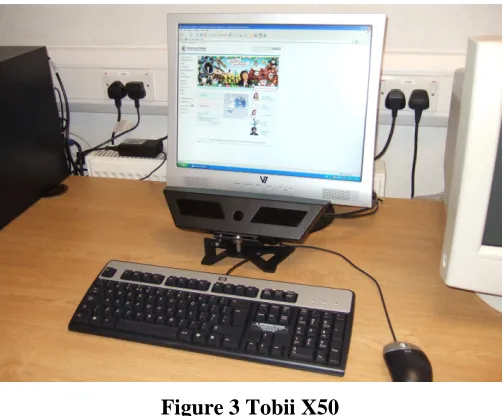
For some applications it is important that the participant can move their head easily and without the constraints of head mounted eye trackers. For example, research with infants would be very difficult using a head mounted system or even one that required head restraint. One system that does offer this degree of freedom is that produced by Tobii (http://www.tobii.com/).
The Tobii X50 is a relatively small stand alone unit that is positioned just in front of the partici-pant. Calibration is simple using the Clearview software system that is provided with the eye tracker. The Clearview software also deals with the analysis of the data which can be accessed in a variety of formats.
Typically the participant will be positioned in front of the computer screen and if interaction is required, they will be given a keyboard but this isn’t a requirement. The visual stimulus may be a website, a picture, or a moving image. Almost any image that can be presented via a computer screen can be used. The X50 uses an infrared light source to monitor eye tracking and this is in-visible from the participant’s perspective. The participant may be given a specific task to under-take, for example, finding information from an Internet source, or they may be presented with a static image to peruse. It should be noted that if using a keyboard some data may be lost as the
[image:3.612.365.509.75.227.2]
Figure 3 Tobii X50 Figure 1: ASL H6 HS
Head Mounted System
(Courtesy of Applied Science Laboratories)
Figure 2 Mobile Eye
[image:3.612.199.451.345.553.2]participant looks down at the keys rather than directly at the screen. The length of a typical ses-sion will obviously vary with the task but it may last from a few seconds to several minutes. Re-searchers should be aware that a voluminous amount of data will be produced with the longer studies.
Eye tracking Metrics
Most eye tracking systems produce data that can be examined in several different formats to meet the needs of most researchers.
Scan path
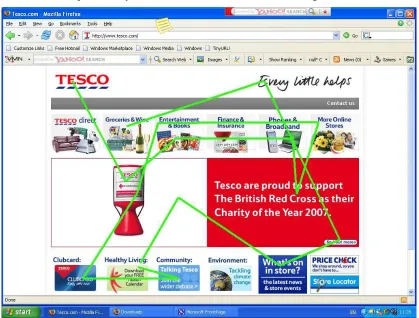
[image:4.612.79.498.246.564.2]This is probably the most basic form of data representation and is simply a trace of fixation points recorded in real time. This enables researchers to see quite precisely what a participant is looking at as well as the sequence of eye movements over the visual stimulus (Figure 4).
Figure 4: Example of a scan path
Spatial analysis
Statistical analysis
The “hot spot” measure described above provides a good qualitative presentation of the data, but if more precise measurements are required then it is possible to measure the proportion of time spent looking at different regions of the visual stimulus. This data can be presented in summary form as in Figure 6, or in terms of actual number and duration of fixations in a particular region of the image. This data can be exported as a text file for further analysis using statistical pack-ages, e.g. SPSS.
Interpretation of Eye Tracking Metrics
While it might be relatively straightforward to collect the data in whatever format is chosen, the interpretation of the data requires careful thought. The problem for the researcher is how to relate a particular pattern of eye movements to the cognitive activity associated with the visual task. For example, does a long fixation on a particular element of the image indicate that the individual is having difficulty with that element, or that they just find it attractive in someway, or perhaps both in the case of a visual illusion? In eye tracking research “top-down” approaches tend to be driven by theory or the need to test a particular hypothesis. For example cognitive theory might suggest that scanning takes place from left to right and therefore it might be better to place the most im-portant elements of a visual image towards the left. An alternative strategy, the “bottom-up” ap-proach starts by looking at where people fixate and then asks the question why do they look more at one particular element of the image rather than another? The two approaches are not mutually exclusive, indeed an effective strategy might be to begin without preconceived notions using a “bottom-up” approach, and then to formulate hypotheses based on these observations and what is known from cognitive theory.
From previous research it is possible to suggest what the psychological importance of different metrics might be:
Fixation Number: This appears to be related to search efficiency (Goldberg & Kotval, 1998).
[image:5.612.367.511.73.291.2]Large numbers of fixations probably indicate that the participant is searching for something that they are having difficulty locating, possibly because of poor design of the visual stimulus. Jacob
[image:5.612.128.291.75.296.2]and Karn (2003) suggest that the number of fixations on an element should reflect the importance of that element.
Gaze: The proportion of time spent looking at a particular element of the visual stimulus is
gener-ally seen as an indication of the importance of that element (Jacob & Karn 2003). Gaze duration may be measured as eye fixation time on target, or it may be made up of a number of different fixations on the target.
Area of Interest: AOI analysis is used where the researcher wants to quantify gaze data within a
defined region of the visual stimulus. For example, in the case of a web page, the researcher might be interested in how often or for how long the participant looks at a region of the web page that the designers have designated of high importance. Fitts et al. (1950) have shown that gazes on a particular AOI will be longer if the participant has difficulty extracting meaning from that region of the stimulus.
Scan Path: The scan path is made up of a sequence of fixations as shown in Figure 4. As well as
the overall pattern of fixations, researchers might be interested in the direction of scan path, e.g. top/bottom, left/right etc, or they may be interested in the scan path duration or scan path length.
Time to first fixation: Where participants are required to identify a particular element in the
vis-ual stimulus, the time to first fixation on that element can be a useful measure of efficiency of search strategy or the “attention-getting” properties of the element.
Usability Studies
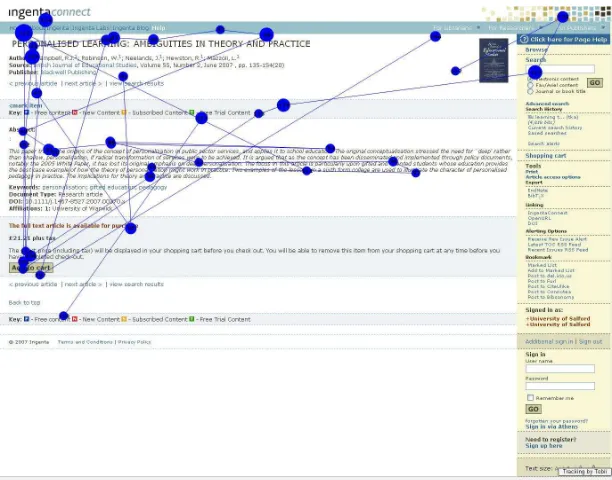
The purpose of the studies described below was to examine the feasibility of using eye tracking technology in the evaluation of the usabilty of e-learning web sites, specifically, BlackBoard vir-tual learning environment (Figure 7), IngentaConnect, the online journal database (Figure 8), and Wikipedia the online encyclopedia (Figure 9).
In addition, it was tentatively hypothesised that there would be a relationship between Internet self-efficacy, as measured by the Web User Self-Efficacy scale (WUSE), (Eachus & Cassidy, 2006) and the eye-tracking metrics. Internet self-efficacy is a measure of how confident a person feels about their ability to interact with the Internet. The WUSE scale measures this in terms of four constructs: Information Provision, Information Retrieval, Communications, and Internet Technology. Adding the scores obtained on these constructs provides an overall measure of Inter-net self-efficacy, the WUSE score. It was tentatively predicted that there may be a relationship between the way a person uses their visual system to scan web pages and this measure of Internet self-efficacy.
Sampling
At the start of each academic year students are routinely asked to complete the WUSE scale in order that their Internet Self-Efficacy may be evaluated to give academic staff some indication of how students are likely to cope with e-learning environments. All students who completed this scale were invited to take part in the study.
Procedure
guide to the success of the calibration. If there are any problems the calibration process is re-peated. This calibration information can be recorded for each participant, which means that the calibration procedure doesn’t have to be repeated if the same participant is being used in a further trial. Following calibration, the researcher set the parameters for the session, e.g. how long the session was to last, what type of visual stimulus was to be used and where this stimulus could be found; in the case of website a URL could be specified as a location. Once the session began, eye tracking and data recording occurred automatically as the participant undertook the given task. The eye tracking ceased once the predetermined time interval was reached. During the task, the participant was not aware of the eye tracking, they were not aware of the infrared light that was being reflected from their eyes and there was nothing on the screen to indicate that eye tracking was occurring
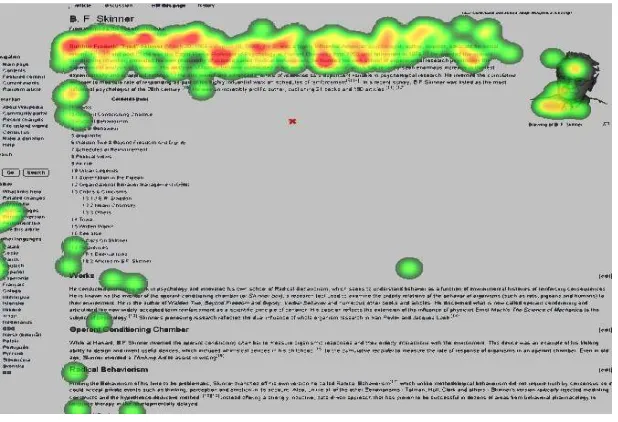
In this feasibility study participants were presented with tasks that required them to interact with three web based learning resources, specifically, the Blackboard virtual learning environment, IngentaConnect, an academic journal database, and Wikipedia an online encyclopedia. For the Blackboard trial, participants were asked to spend ten minutes examining online learning materi-als dealing with “Drugs and Behaviour”. In order to motivate participants they were informed that at the end of the ten minutes they would be asked to complete a simple questionnaire dealing with the content and the usability aspects of the materials. In the second task they were asked to use IngentaConnect to find journal articles dealing with learning theory, and for the Wikipedia task they were asked to find out for what B.F. Skinner was best known. None of these tasks were par-ticularly difficult; their main purpose was to provide a vehicle through which the participant could interact with an e-learning resource while eye tracking data was collected. The second two tasks lasted no more than 2 minutes and were terminated once the participant had achieved the task goal.
Results and Evaluation
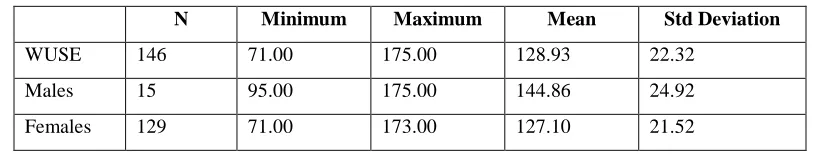
[image:7.612.119.526.500.577.2]The data collected via the WUSE scale provided an overall sample of N=146. The WUSE scale measures levels of Internet Self-Efficacy on four subscales: Information Retrieval, Information Provision, Communication, and Internet Technology. Summing the scores on these four subscales provides a WUSE total score, i.e. an overall measure of Internet Self-Efficacy. This was the measure used in this study. Descriptive statistics and the gender split are shown in Table 1.
Table 1: Descriptive Statistics, Web User Self Efficacy Scores
N Minimum Maximum Mean Std Deviation
WUSE 146 71.00 175.00 128.93 22.32
Males 15 95.00 175.00 144.86 24.92
Females 129 71.00 173.00 127.10 21.52
The difference in WUSE score between males and females was found to be statistically signifi-cant (t= -3.415, df = 142, p< 0.001, effect size = 0.81). This gender difference in Internet Self-Efficacy is consistent with previous findings (Eachus and Cassidy, 2006).
For all three tasks, eye tracking data was successfully recorded, though the quality of that data was variable. Scan path data was recorded accurately for all three tasks and could be played back easily using either the ClearView software, or via an exported AVI file. As was expected, data was occasionally lost when the participant looked down at the mouse but the eye tracker was able to resume eye tracking as soon as the participant looked back at the screen. Examples of the data collected are shown in Figures 7, 8, and 9.
[image:8.612.140.443.231.415.2]The data collection and analysis was most problematic where changes in the visual image occur, for example, with Flash animations, pop-ups or even when moving from one web page to another. Under these circumstances attempting to view fixation data or hot spots invariably resulted in a blank screen. The explanation for his appears to be that the ClearView software records data con-tinuously and doesn’t discriminate between one web page and the next or even between a web
Figure 7 Scan Path (BlackBoard VLE)
[image:8.612.135.441.451.691.2]page with an animation and the same page without animation. Fixation data and hot spots extract the data for their plotting from the X Y co-ordinates of each eye as detected by the eye tracker. The X Y co-ordinates are, in a sense, static even though the web page might change. If all the recorded data was plotted then a very confused picture would emerge with, in effect, eye tracking data from different web pages being superimposed on each other. Fortunately Tobii, the manufac-turers of this system, have developed a tool within the ClearView software that can help with this problem. The Scene Tool enables the researcher to view a recording of the visual stimulus, in-cluding changes to web pages, and the researcher can then identify and mark on the time line where these changes occur. The ClearView software then treats the time between one mark and the next as a single page, and thus fixation and hot-spot data can now be displayed. What is really required is a dynamic fixation and hot spot display system that would actually change as the scene being viewed changes. Unfortunately at present this level of sophistication does not appear to be available.
Tobii suggests that data recording problems can arise if the participant is wearing spectacles, es-pecially bifocals or contact lenses. In this study one of the participants wore varifocal specta-cles,but this didn’t appear to interfere with the performance of the eye tracker.
[image:9.612.171.480.74.285.2]In order to examine any possible relationship between Internet Self-Efficacy, as measured by WUSE scores, and the eye tracking metrics, participants were divided into two groups: those who scored +1 standard deviation above the mean WUSE score and those who scored -1 standard de-viation below this mean. In this exploratory study it was predicted that there would be differences in eye tracking metrics when these two groups were compared. Although there does appear to be significant variation between individuals (see Table 2) in the metric data obtained, preliminary analysis, using a t-test, has failed to identify consistent differences that would support this hy-pothesis. Similarly it was predicted that duration of fixation would be related to Internet Self-Efficacy, a Spearman Rank Order correlations failed to find any statistically significant relation-ship.
Table 2: Examples of variation in eye tracking metrics Participant Mean
fixations
Mean Duration
Xplot Yplot WUSE
A 930 285.75 681.36 480.39 175
B 349 144.4 696.35 408.35 102
C 780 296.32 694.21 427.85 151
D 857 225.02 651.73 397.55 116
Table 2 illustrates some of the quantitative data that it is possible to generate using this eye track-ing technology. This data was collected over a ten minute period while a participant interacted with a web based learning resource (BlackBoard VLE). A fixation is defined as an interval of time (set at 100 milliseconds) during which the eye doesn’t move. Thus, in the data above, it can be seen that during the ten minute period Participant A recorded 930 fixations and the mean dura-tion for each of these was 285.75 milliseconds. This varies considerably from Participant B who had a mean number of fixations of 349, with a mean duration of 144.4 milliseconds. It can also be seen that these two participants also differ considerably in terms of Internet Self-Efficacy
(WUSE). Unfortunately, this preliminary data does not allow us to generalise this finding.
The Xploy and Yplot data is presented to give an indication of how it is possible to quantify the mean position of fixation during the ten minute interaction. This data is recorded in pixels with a screen resolution set at 1400 x 1050. In this particular example this data is only of limited use but if a designer wanted to know if a particular region of the screen was the focus of attention, then these measurements could answer that question precisely. It should be noted that the data pre-sented in Table 2 represents the cumulative data over the ten minute period and this represents anything between several hundred and several thousand data points. Thus the data could be ana-lysed over any period of time that might be required by the researcher.
Discussion
Conclusion
This study has demonstrated the feasibility of using an eye tracking system to record patterns of eye movements while participants interact with e-learning resources. The data produced appears to be reliable, valid and has a degree of sensitivity that would meet the needs of most researchers. The data produced by the Tobii X50 system and the ClearView software is available in a variety of formats, and it can be used to describe the interaction between participant and e-learning re-source in both qualitative and quantitative terms. However, relating the data collected, to the cog-nitive processing of information and psychological constructs, like self-efficacy, may prove more problematic.
References
Dodge, R., & Cline, T. S. (1901). The angle velocity of eye movements. Psychological Review, 8, 145-157.
Eachus, P., & Cassidy, S. (2006). Development of the Web Users Self-Efficacy Scale (WUSE). Issues in
Informing Science and Information Technology, 3, 199-209. Retrieved from
http://informingscience.org/proceedings/InSITE2006/IISITEach219.pdf
Fitts, P. M., Jones, R. E., & Milton, J. L. (1950). Eye movements of aircraft pilots during instrument-landing approaches. Aeronautical Engineering Review, 9(2), 24-29.
Goldberg, J. H., & Kotval, X. P. (1998). Eye movement-based evaluation of the computer interface. In S. K. Kumar (Ed.), Advances in occupational ergonomics and safety (pp. 529-532). Amsterdam.
Hartridge, H., & Thompson, L.C. (1948). Methods of investigating eye movements. British Journal of
Ophthalmology, 32, 581-591.
Jacob, K. J., & Karn, K. S. (2003). Commentary on Section 4. Eye tracking in human-computer interaction and usability research: ready to deliver the promises. In J. Hyona, R. Radach, & H. Deubel (Eds.), The
mind's eyes: Cognitive and applied aspects of eye movements. Oxford: Elsivier Science.
Mackworth, J. F., & Mackworth, N. H. (1958). Eye fixations recorded on changing visual scenes by televi-sion eye-marker. Journal of Optical Society of America, 52, 713-716.
Rayner, K. (1998). Eye movements in reading and information processing: 20 years of research.
Psycho-logical Bulletin, 124(3), 372-422.
Tinker, M. A. (1963). Legibility of print. Ames, Iowa State University Press
Biographies
Peter Eachus. My main interests are the psychological aspects of
Simon Cassidy. My main interests are in social-cognitive theory and
its application to health, education and performance. I am also re-searching the impact of new technologies, especially the Internet and use of mobile phones on human performance and functioning.
Sarah Norgate. My main interest is in applying mainstream theories
of developmental psychology to clinical populations (e.g. children with visual problems) and contexts (e.g. hospitals). I critique molecular genetic lines of enquiry to the study of certain behaviours (e.g. IQ).
Lynne Marrow. My main interests are focused on aspects of the
brain’s dopamine systems and I have researched and published in the areas of movement disorders and schizophrenia, depression, the reward systems, substance misuse and aggression. I also have an interest in the use of the Internet as an educational tool.
Leah Greene. I am the technician for the School of Community,