E
CONOMÍ
A
Testing for Stock Market Integration in a
Developing Economy: Colombia
Luis Gutierrez y Jesús Otero
(Documento de Trabajo, citar con autorización del autor) No. 4 – Agosto 2006
D
DDOOOCCCUUUMMMEEENNNTTTOOOSSS
D
DDEEE
T
T
ESTING FORS
TOCKM
ARKETI
NTEGRATION IN AD
EVELOPINGE
CONOMY:
C
OLOMBIA ♦Luis Gutiérrez Facultad de Economía Universidad del Rosario
Bogotá, Colombia [email protected]
Jesús Otero ♣ Facultad de Economía Universidad del Rosario
Bogotá, Colombia [email protected]
August 2006
Abstract
This paper examines the linkage between two parallel stock exchanges trading the same shares in Colombia, namely the Bogotá Stock Exchange and the Medellín Stock Exchange. We provide empirical evidence to support the hypothesis that these two markets can be best described as fully integrated over a period of almost four decades, which is consistent with the view that arbitrage opportunities are only possible in the short but not in the long run. In addition, we find evidence that the location of a company’s headquarters appears to matter in stock price formation.
JEL classifications: G14, O16.
Keywords: Stock market, cointegration, arbitrage, Colombia.
♦
We would like to thank Luis Eduardo Fajardo, Ana Maria Iregui and most especially Manuel Ramírez for useful discussions on several of the ideas developed in the paper. We would also like to thank the Colombian Stock Exchange (Bolsa de Valores de Colombia – BVC) for help in obtaining some necessary data. Any remaining errors are ours.
♣
Corresponding author Jesús Otero
Facultad de Economía Universidad del Rosario Calle 14 # 4-69
Bogotá, Colombia
1. Introduction
In recent years there has been a great deal of interest in analysing stock market interdependence in well-established financial markets. Indeed, a number of authors have examined possible linkages in the USA, Europe, Asia and Latin American stock markets; see e.g. Kasa (1992), Corhay et al (1993, 1995), Chowdhury (1994), Choudhry (1997) and Fernández-Serrano and Sosvilla-Rivero (2003), among others. The evidence reported in these studies is consistent with the hypothesis that common stochastic trends lie behind the long-run co-movements of equity markets across the world, suggesting that in the long run, potential benefits from international diversification may have not been as significant as previously thought.1
This paper aims to complement this body of literature by studying the linkage between two parallel equity markets trading the same shares in a developing country such as Colombia. Developing countries are often characterised as economies where equity markets are rather limited in size, scope and geographical location; see e.g. Agénor and Montiel (1996). The study of the Colombian experience is therefore interesting, because during several years, three stock exchanges coexisted simultaneously in the country’s three main cities: the Bogotá Stock Exchange (Bolsa de Bogotá), the Medellín Stock Exchange (Bolsa de Medellín); and the Occidente Stock Exchange (Bolsa de Occidente) in Cali.
Thus, the basic idea of the paper is to examine whether the Colombian stock markets can be best described as fully integrated, so that the price of the same asset in different cities should be the same; in other words, the law of one price should hold. Specifically, our empirical analysis uses monthly data of the stock prices of 13 companies running from January 1963 to June 2001.2 It appears that the analysis of stock market integration in Colombia has not been studied before. To our knowledge, perhaps the only attempt has been that of Yepes et al (1978), who report the existence of price differentials between the Bogotá and Medellín markets at a specific point in time. They find price differentials that fluctuate within a range of 0.2 to 23 per cent, and conclude that it would be possible for market participants to make a profit by purchasing a share in one city and selling it in the other. The question that arises from this static analysis is whether market participants can make profits systematically. This paper attempts to answer this question.
2. Historical overview of the Colombian stock exchange markets
The Colombian stock exchanges date back from November 1928 when the Bogotá Stock Exchange was officially created. It started operations in April 1929. By that time, other Latin American cities had already created their own stock exchanges: Buenos Aires (Argentina) in 1854, Lima (Peru) in 1860, Montevideo (Uruguay) in 1867, Rio de Janeiro (Brazil) and Santiago de Chile (Chile) both in 1893, and Mexico City (México) in 1895. As in many neighbouring countries, the appearance of equity markets in Colombia can be mostly explained by the late industrialization process that took place, as some of the first manufacturing, insurance and banking companies started to appear in the early twentieth century (see e.g. Berry, 1983).
Perhaps it is not surprising that, even before the creation of the Bogotá Stock Exchange, an unofficial market operated in Medellín, Colombia’s second largest city, since most of the then new manufacturing, insurance and banking companies were founded in that city. Indeed, the monthly review of the Colombian Central Bank reports that in 1927 about 34 companies traded their shares in the so-called Medellín Trade Exchange (Bolsa de Comercio de Medellín), although it should be mentioned that at that time it was not an official, and therefore regulated, stock exchange. In April 1929, three companies simultaneously traded their shares in both the newly created Bogotá Stock Exchange and in the Medellín Trade Exchange.3 These three companies accounted for about 50% of the overall trading volume in both the Bogotá and Medellín markets.
Trading of shares and other securities in the Medellín market remained active until the mid 1950s, when some traders promoted the creation of an official stock exchange in that city, also with the support from the government. Promoters argued that there was a need for a more organised and regulated market, and so in 1961 the Medellín Trade Exchange officially became the Medellín Stock Exchange. In 1963, when our analysis starts, the Bogotá and Medellín stock exchanges were trading the shares of 89 and 54 companies, respectively. The joint trading volume of the 13 shares selected in our analysis accounted for about 61% of the overall trading volume in that year. During the last six years of our sample period, the contribution of these 13 shares to overall equity trading still accounted for about 35%.
1988 only 12 out of 88 companies appeared in all three exchanges. The underdevelopment of the equity market prompted the need for a unique and strong market, and so in July 2001 the stock exchanges of Bogotá, Medellín and Occidente merged and created the Colombian Stock Exchange (Bolsa de Valores de Colombia) which is currently in operation.
3. Empirical modelling exercise
The data set used in this paper consists of time series of monthly average prices for the shares of 13 companies over the period January 1963 to June 2001, i.e. prior to the creation of the Colombian Stock Exchange. Until the early nineties, the data was hand-collected from bulletins published by both the Bogotá and Medellín stock exchanges. For the remaining years, information was extracted from a database provided by the Colombian Stock Exchange. The period of analysis, which covers almost four decades, represents the longest possible sample period for which price data is fully available for a reasonable number of companies quoted simultaneously in the Bogotá and Medellín markets.4 The Occidente Stock Exchange was not included in the analysis because price data is only available from the early 1990s and for a rather reduced number of companies. The time span should be long enough to enable the detection of any long-run equilibrium relationship in the data.
The sample of companies was chosen because of their high tradability, and to reflect a wide spectrum of different industrial groupings in Colombia, including Banking, Insurance, Brewing, Tobacco, Textiles, Metal, Construction, and Transportation. Historically, the companies considered have been included in the baskets used to calculate the price indices of the two stock exchanges. The names of the companies selected, their mnemonic and industrial grouping are all included in the Appendix.
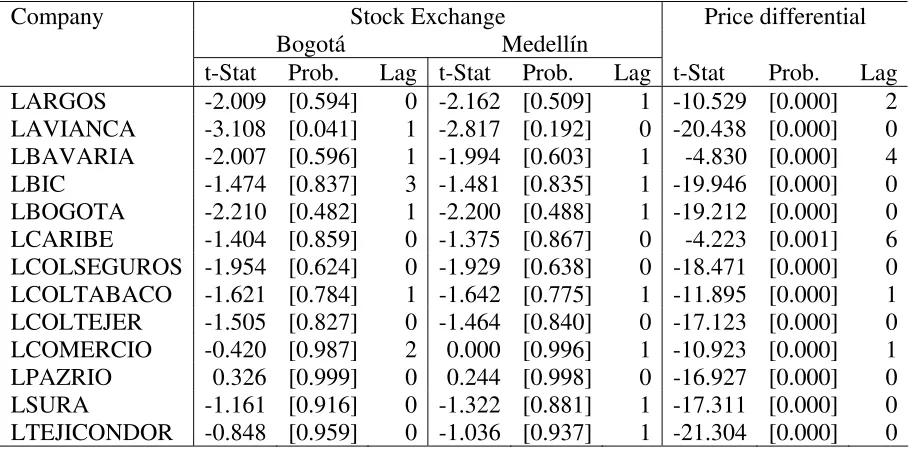
Preliminary analysis of the price data using the Augmented Dickey-Fuller (1979) (ADF) tests suggested that all series are I(1) when considered in levels, while the price differential, defined as the price observed in the Bogotá market minus that in Medellín, appears to be I(0) (see Table 1). It should be noticed that finding stationarity in the price differential is equivalent to finding that the two prices are cointegrated with a known cointegrating vector equal to
(
. This result implies that for all the companies under consideration, the quoted prices in the Bogotá and Medellín markets must be linked by a long-run equilibrium relationship. In the short run these prices may deviate from the long-run equilibrium relationship, although not by an ever-growing amount, since economic forces may be expected to act so as to restore equilibrium; i.e. the discrepancy in the relationship must be integrated of order zero. This is consistent with)
'the view that arbitrage opportunities are only possible in the short but not in the long run.
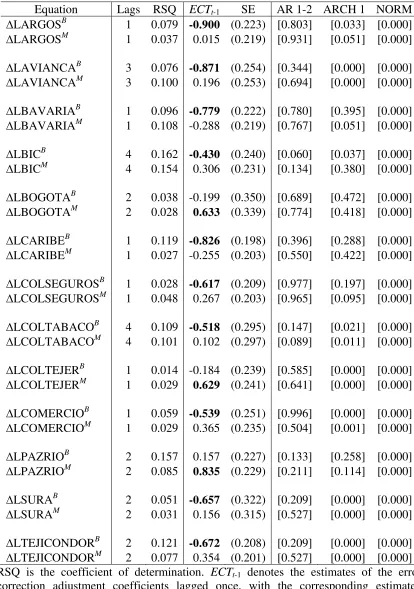
Once evidence of cointegration is found, the next step is to estimate the corresponding error correction mechanism, which allows us to model the short run dynamic behaviour of the variables. In the two variables case, this mechanism is given by the following equations:
(
)
1 1 1 lags , B
t
B B
t t t t p
p α βECT− p pM ε
Δ = + + Δ Δ + ,
(
)
2 2 1 lags , M
t
M B
t t t t p
p α β ECT− p pM ε
Δ = + + Δ Δ + ,
where ptB and ptM denote the price of a stock in the Bogotá and Medellín markets, respectively, and ECTt−1= ptB−1−ptM−1 is the error correction term lagged once. The estimated coefficients β1 and β2 measure the speed of adjustment of each variable to deviations from the long-run equilibrium. Because of the way in which ECTt−1 was defined, one is interested in testing the null hypothesis that β1
( )
β2 is equal to zero against the one-sided alternative that it is positive (negative).OLS estimates of the error correction mechanism for each of the 13 companies under consideration are reported in Table 2, along with some diagnostic test statistics. To save space, we report only the estimated coefficients associated toECTt−1.5 In the Bogotá Stock Exchange, the results show that the short-run behaviour of the share prices of ARGOS, AVIANCA, BAVARIA, BIC, CARIBE, COLSEGUROS, COLTABACO, COMERCIO, SURA and TEJICONDOR appears to be significantly affected by the error correction term. There is no statistical evidence that in the Medellín Stock Exchange the prices of these companies adjust to deviations from long-run equilibria, so that they could be treated as weakly exogenous. Furthermore, in the Medellín Stock Exchange the short-run behaviour of the share prices of BOGOTA, COLTEJER and PAZRIO exhibit significant feedbacks from the disequilibrium errors. In the Bogotá Stock Exchange the prices of these three companies do not appear to adjust to any deviation from long-run equilibria, so that they also could be treated as weakly exogenous. The statistically significant adjustment coefficients indicate that stock prices adjusted relatively fast to changes to the underlying equilibrium relationship, since the parameter estimate on ECTt−1 shows that economic agents removed approximately 50% of the resulting disequilibrium within each month.
occurs first in the company’s “home” market, and it is then transmitted to the other market. In a recent paper, Pirinsky and Wang (2006) argue that a geographic component, associated to trading patterns of local residents, may play a significant role in price formation in equity markets.
4. Concluding remarks
Table 1.Dickey and Fuller unit root tests
Company Stock Exchange Price differential
Bogotá Medellín
t-Stat Prob. Lag t-Stat Prob. Lag t-Stat Prob. Lag LARGOS -2.009 [0.594] 0 -2.162 [0.509] 1 -10.529 [0.000] 2 LAVIANCA -3.108 [0.041] 1 -2.817 [0.192] 0 -20.438 [0.000] 0 LBAVARIA -2.007 [0.596] 1 -1.994 [0.603] 1 -4.830 [0.000] 4 LBIC -1.474 [0.837] 3 -1.481 [0.835] 1 -19.946 [0.000] 0 LBOGOTA -2.210 [0.482] 1 -2.200 [0.488] 1 -19.212 [0.000] 0 LCARIBE -1.404 [0.859] 0 -1.375 [0.867] 0 -4.223 [0.001] 6 LCOLSEGUROS -1.954 [0.624] 0 -1.929 [0.638] 0 -18.471 [0.000] 0 LCOLTABACO -1.621 [0.784] 1 -1.642 [0.775] 1 -11.895 [0.000] 1 LCOLTEJER -1.505 [0.827] 0 -1.464 [0.840] 0 -17.123 [0.000] 0 LCOMERCIO -0.420 [0.987] 2 0.000 [0.996] 1 -10.923 [0.000] 1 LPAZRIO 0.326 [0.999] 0 0.244 [0.998] 0 -16.927 [0.000] 0 LSURA -1.161 [0.916] 0 -1.322 [0.881] 1 -17.311 [0.000] 0 LTEJICONDOR -0.848 [0.959] 0 -1.036 [0.937] 1 -21.304 [0.000] 0 Notes:
Table 2. Estimates of the error correction coefficients and diagnostic statistics Equation Lags RSQ ECTt-1 SE AR 1-2 ARCH 1 NORM
ΔLARGOSB 1 0.079 -0.900 (0.223) [0.803] [0.033] [0.000]
ΔLARGOSM 1 0.037 0.015 (0.219) [0.931] [0.051] [0.000]
ΔLAVIANCAB 3 0.076 -0.871 (0.254) [0.344] [0.000] [0.000]
ΔLAVIANCAM 3 0.100 0.196 (0.253) [0.694] [0.000] [0.000]
ΔLBAVARIAB 1 0.096 -0.779 (0.222) [0.780] [0.395] [0.000]
ΔLBAVARIAM 1 0.108 -0.288 (0.219) [0.767] [0.051] [0.000]
ΔLBICB 4 0.162 -0.430 (0.240) [0.060] [0.037] [0.000]
ΔLBICM 4 0.154 0.306 (0.231) [0.134] [0.380] [0.000]
ΔLBOGOTAB 2 0.038 -0.199 (0.350) [0.689] [0.472] [0.000]
ΔLBOGOTAM 2 0.028 0.633 (0.339) [0.774] [0.418] [0.000]
ΔLCARIBEB 1 0.119 -0.826 (0.198) [0.396] [0.288] [0.000]
ΔLCARIBEM 1 0.027 -0.255 (0.203) [0.550] [0.422] [0.000]
ΔLCOLSEGUROSB 1 0.028 -0.617 (0.209) [0.977] [0.197] [0.000]
ΔLCOLSEGUROSM 1 0.048 0.267 (0.203) [0.965] [0.095] [0.000]
ΔLCOLTABACOB 4 0.109 -0.518 (0.295) [0.147] [0.021] [0.000]
ΔLCOLTABACOM 4 0.101 0.102 (0.297) [0.089] [0.011] [0.000]
ΔLCOLTEJERB 1 0.014 -0.184 (0.239) [0.585] [0.000] [0.000]
ΔLCOLTEJERM 1 0.029 0.629 (0.241) [0.641] [0.000] [0.000]
ΔLCOMERCIOB 1 0.059 -0.539 (0.251) [0.996] [0.000] [0.000]
ΔLCOMERCIOM 1 0.029 0.365 (0.235) [0.504] [0.001] [0.000]
ΔLPAZRIOB 2 0.157 0.157 (0.227) [0.133] [0.258] [0.000]
ΔLPAZRIOM 2 0.085 0.835 (0.229) [0.211] [0.114] [0.000]
ΔLSURAB 2 0.051 -0.657 (0.322) [0.209] [0.000] [0.000]
ΔLSURAM 2 0.031 0.156 (0.315) [0.527] [0.000] [0.000]
ΔLTEJICONDORB 2 0.121 -0.672 (0.208) [0.209] [0.000] [0.000]
Appendix
The following companies were used in the analysis (industrial grouping, company name, mnemonic and last available observation):
Banking: Banco de Bogotá (BOGOTA, until 2001M6)
Banco del Comercio (COMERCIO, until 1991M11) Banco Industrial Colombiano (BIC, until 2001M6).
Insurance: Compañía Colombiana de Seguros (COLSEGUROS, until 1998M12) Compañía Suramericana de Seguros (SURA, until 1997M12).
Brewing: Bavaria (BAVARIA, until 2000M12).
Tobacco: Compañía Colombiana de Tabaco (COLTABACO, until 2001M6). Textiles: Fábrica Colombiana de Tejidos (COLTEJER, until 2001M6)
Tejidos El Cóndor (TEJICONDOR, until 2001M6). Metal: Acerías Paz del Río (PAZRIO, until 1999M10).
Construction: Compañía de Cementos Argos (ARGOS, until 2001M6) Cementos Caribe (CARIBE, until 2001M6).
Transportation: Aerovías Nacionales de Colombia (AVIANCA, until 1998M12).
References
Agénor P.-R. and Montiel, P.J. (1996) Development Macroeconomics, Princeton University Press, Princeton, NJ.
Ahlgren, N. and Antell, J. (2002) Testing for cointegration between international stock prices. Applied Financial Economics, 12, 851–861.
Berry, A. (1983) A descriptive history of Colombian industrial development in the Twentieth century, in Essays on Industrialization in Colombia (Ed) A. Berry, Center for Latin American Studies, Arizona State University, Tempe AZ, pp 7–98 .
Choudhry, T. (1997) Stochastic trends in stock prices: Evidence from Latin American markets. Journal of Macoeconomics, 19, 285–304.
Chowdhury, A.R. (1994) Stock market interdependencies: Evidence from the Asian NIEs. Journal of Macoeconomics, 16, 629–651.
Corhay, A., Tourani Rad, A. and Urbain, J.-P. (1993) Common stochastic trends in European stock markets. Economics Letters, 42, 385–390.
Corhay, A., Tourani Rad, A. and Urbain, J.-P. (1995) Long run behaviour of Pacific-Basin stock prices. Applied Financial Economics, 5, 11–18.
Dickey, D. and Fuller, W. (1979) Distribution of the estimators for autoregressive time series with a unit root. Journal of the American Statistical Association, 74, 427–31.
Fernández-Serrano, J.L. and Sosvilla-Rivero, S. (2003) Modelling the linkages between US and Latin American stock markets. Applied Economics, 35, 1423–1434.
Kasa, K. (1992) Common stochastic trends in international stock markets. Journal of Monetary Economics, 29, 95–124.
Lütkepohl, H. (2004). Vector autoregressive and vector error correction models, in Applied Time Series Econometrics (Eds) H. Lütkepohl and M. Krätzig, Cambridge University Press, Cambridge, pp 86–158.
MacKinnon, J.G. (1996) Numerical distribution functions for unit root and cointegration tests. Journal of Applied Econometrics, 11, 601–618.
Pirinsky, C. and Wang, Q. (2006) Does corporate headquarters location matter for stock returns? Journal of Finance, 61, 1991–2015.
Yepes, C., Forero, C. and Lovera, J. (1978) Arbitraje entre las bolsas de Medellín y Bogotá. Estrategia Económica y Financiera, 11, 29.
Endnotes 1
An exception is Ahlgren and Antell (2002) who do not find evidence of cointegration among Finland, France, Germany, Sweden, the UK and the USA from January 1980 to February 1997.
2
Another country with more than one stock market is China, with the Shanghai Stock Exchange, the Shenzhen Stock Exchange, and the Hong Kong Stock Exchange. The possibility of cointegration among these three markets was recently studied by Zhou and Zhou (2005), using aggregated daily indices for these stock exchanges from April 1991 to December 2002
3
These three companies were BOGOTA (a commercial bank), COLTABACO (a tobacco company) and COLSEGUROS (an insurance company).
4
Although the Medellín Stock Exchange was created in 1961, the analysis starts in 1963 due to data availability.
5
The estimated error correction equations pass the LM statistic for testing the null of no serial correlation of up to order two. The ARCH effects reported in some of the equations are not surprising since we are dealing with financial time series, and should not be taken as a signal of inadequate modeling of the conditional mean of the series, which is the main interest of the present analysis; see e.g. Lütkepohl (2004; p.157). The normality failures are due to a few outliers; introducing impulse dummy variables to account for these atypical observations actually worsened the other diagnostic test statistics, and so it was decided to leave them out of the models.
6