Publicness of Goods and Violent Conflict: Evidence from
Colombia
∗Darwin Cort´es† Daniel Montolio ‡
April 23, 2013
Abstract:
How the degree of publicness of goods affect violent conflict? Based on the theoretical model in Esteban and Ray (2001) we find that the effect of the degree of publicness depends on the group size. When the group is small (large), the degree of publicness increases (decreases) the likelihood of conflict. This opens an empirical question that we tackle using microdata from the Colombian conflict at the municipality level. We use three goods with different publicness degree to identify the sign of the effect of publicness on conflict. These goods are coca crops (private good), road density (public good subject to congestion) and average education quality (a purer public good). After dealing with endogeneity issues using an IV approach, we find that the degree of publicness reduces the likelihood of both paramilitary and guerrilla attacks. Moreover, coca production exacerbates conflict and the provision of both public goods mitigates conflict. These results are robust to size, geographical, and welfare controls. Policies that improve public goods provision will help to fight the onset of conflict.
JEL codes: D74, H41
Keywords: Conflict, Coca Production, Road Density, Education, Publicness.
∗We thank Daniel Martinez and Alejandro Montoya for their research assistance. Daniel Montolio
acknowl-edges support from grant 2009SGR102 from the Catalan Autonomous Government.
†Corresponding author, Department of Economics and CeiBA-Complejidad, Universidad del Rosario,
Colombia, Carrera 5 15-37, Piso 6, 110321, Bogota, Colombia - (57) 3008496803 -
1
Introduction
The economic causes of conflicts have received considerable attention in the economic liter-ature. Most of the literature is dedicated to the analysis of income shocks that come from private goods (e.g. Miguel, et al., 2004; Dube and Vargas, 2013), with special attention to natural resources (Frankel, 2010). The role of public goods provision has received much less attention.
The aim of the paper is to study the effect of the publicness degree of goods on conflict. For this purpose, based on the theoretical model in Esteban and Ray (2001), we model the behavior of several groups in conflict and derive some conclusions about the relationship between publicness of goods and conflict. This relationship heavily depends on the group size. When the group is small enough, publicness of goods reduces conflict. On the contrary, when the group is large enough, publicness of goods increases conflict.
Then, we test these theoretical predictions using event-based microdata from the Colom-bian conflict. We study the effect of three goods that differ in the degree of publicness, namely, coca crops, a private good, road density, a public good subject to congestion, and education quality, a pure public good that proxies knowledge. The main results show that conflict is less likely when the degree of publicness is larger. This result is in line with the theoretical predictions for small groups. Besides, coca production exacerbates conflict, a re-sult that is compatible with previous findings (Angrist and Kugler, 2008). More importantly, both public goods mitigate conflict.
The main empirical problem to identify the effect of the publicness degree on conflict is endogeneity. Not only provision of goods may affect conflict but also conflict may affect goods provision. To tackle this issue we adopt an IV approach. We use historical instruments related to coca production and public good provision. IV results are compatible with the theory for the case of small groups, namely, the degree of publicness of conflict prize reduces the onset of conflict.
each member of the group as in the case of fighting for a private good and, hence, the larger the group, the higher the effort devoted to win the conflict (see among others Chamberlin, 1974; Katz et al. 1990 and Nti, 1998). Esteban and Ray (2001) go further allowing for a mixed composite prize with some publicness degree and nonlinear effort cost. They show that the Olson’s paradox do not hold anymore when either effort is costly enough (quadratic) or prize is public enough.
Esteban, Ray and coauthors extended this model to analyze ethnical conflicts. They have shown both theoretically and empirically that the degree of publicness plays a role in this type of conflicts (Esteban and Ray, 2011 and Esteban et al. 2012). We use the model in Esteban and Ray (2001) to understand the Colombian conflict, a conflict in which polarization along religion and ethnicity plays no role.
In the empirical grounds, this paper relates to the literature that studies the relationship between public goods and conflict. The bulk of these studies concentrate on the consequences of conflict on public goods provision. The literature has studied the effect of conflict on social development (S´anchez and Diaz, 2005), education (Barrera and Ib´a˜nez, 2004; Due˜nas and S´anchez, 2007; Rodr´ıguez and S´anchez, 2009, 2010) and infrastructure (Villegas and Duque, 2009). To our best of knowledge no study tackles the causal effect of public good provision on conflict. The relationship between conflict and coca has been extensively studied. Some studies have shown that conflict intensification is an important cause of the expansion of coca crops (D´ıaz and S´anchez, 2004), and some others that coca production fuels conflict (Angrist and Kugler, 2008).
The rest of the paper is organized as follows. Section 2 presents a brief overview of the Colombian conflict. Section 3 outlines a simple conflict model that helps us to establish the main intuitions to be empirically tested. In section 4 we specify the empirical strategy, paying special attention to the identification of causal relations among the variables of interest. Section 5 presents and describes the data. Section 6 presents the main empirical results. Finally, section 7 concludes and offers some policy implications of the main results.
2
Some Background on the Colombian Conflict
The Colombian conflict has lasted over fifty years. One of the fighting groups is the Revo-lutionary Armed Forces of Colombia (FARC), the oldest guerrilla in the world, founded in 1964. The origin of this guerrilla has political roots that can be traced back at least until the period known as La Violencia,1
which was triggered by the 1948 assassination of populist
political leader Jorge Eli´ecer Gait´an. The FARC and other guerrilla movements claim to be fighting for the rights of the poor in Colombia, to protect them from government violence and to redistribute land toward the poor.
Colombia is a country very rich in oil, gold and coal. The presence of these resources have fueled the conflict for decades (see Dube and Vargas, 2013, for empirical evidence on oil and conflict). The first paramilitary groups were organized in the 1970s as well as the first illegal crops (first marihuana and then coca and poppy crops). However is only until the 1990s that both phenomena acquire national relevance. Paramilitaries scaled up during the 1980s but got a national organization only in the second part of the 1990s. Coca crops harvested in Colombia experienced a huge increase after the US government cut down the Amazonian air bridge in 1993 (Angrist and Kugler, 2008). Indeed, according to Colombian (and international) authorities during the nineties both guerrilla and paramilitaries increased their involvement in the drug industry (protection of crop fields and clandestine labs) as reported, for instance, by the Ministry of National Defence of Colombia (2000) and the United States General Accounting Office (1994).2
For these reasons the conflict became more complex during the nineties. There were three conflicting groups: the guerrilla trying to overthrow the government and control the state, the government struggling to retain power, and the paramilitary groups, defending themselves from guerrilla actions. Even if formally the Colombian conflict has three actors, there is evidence showing that the paramilitaries have been coordinated with the official army to protect the interests of powerful elites, including multinational companies, large landowners and drug traffickers.
From our point of view, the interesting feature of the complex and long-lasting conflict in Colombia is its evolution from a political conflict in the early stages to the current con-flict mainly hold to control the resources coming from coca production and other natural resources, but where political ideas still seem to play a role. Acemoglu et al. (2009) present evidence supporting the fact that paramilitary groups have significant effects on elections. The authors claim that this supports the idea that paramilitaries have a symbiotic relation-ship with politicians: the illegal army provides votes to politicians with similar preferences over public good provision, and politicians implement policies that are close to those preferred by paramilitaries.
La Violencia, several members of the Liberal Party organized self-defence groups and guerrilla units in the countryside, which fought against the police and other groups under the control of the Conservative party.
3
Theory – Publicness of Goods and Conflict
Based on the well-known conflict model presented by Esteban and Ray (2001), we consider I groups (indexed i) in a conflict. Each group is conformed by Ni members with identical
preferences. Each member exerts an effortai in the conflict, so that the aggregate effort in
groupiisAi=Niai. Ais the total effort exerted in the economy;A= I
P
i=1
Ai.The per capita
benefit of conflict to each member of groupiis given by
Wi =W(λ, Ni) =λP + (1−λ)M
Ni
, (1)
whereλis the degree of publicness of the prize the groups are fighting for. This reward from conflict is, hence, a composite good withP representing a pure public good (not subject to congestion) and NM
i a private good (subject to congestion). Note that the reward steaming
fromP is equal for all members of the winning group, independently of the group size while the reward steaming from M must be shared with the rest of the members of the group and, hence, the individual share depends on the size of the group (Ni). The cost function of
exerting effort for each member of the groupiisV(ai) withV′ >0 and V′′>0 and it can be
interpreted as the monetary and/or time resources spent in going to conflict. The expected per capita utility of going to conflict is
Ai
AW(λ, Ni)−V(ai), (2)
where Ai
A =πi is the winning probability of group i. The First Order Condition gives us the
reaction function of an individual of groupi:
(1
A −
Ai
A2)W(λ, Ni)−V
′(a
i) = 0, (3)
Defining equation (3) as F, we can obtain how an individual changes his/her optimal effort according to the degree of publicness of the prize of conflict:
∂ai ∂λ =− ∂F ∂λ ∂F ∂ai =− 1
A(1−
Ai
A)
∂W ∂λ −A22(1−
Ai
A)W(λ, Ni)−V′′(ai)
, (4)
since Ai
A =πi then 1− Ai
A >0 and, hence, the denominator of equation (4) is negative. The
numerator sign depends on ∂W
∂λ, that is
∂W
∂λ =P−
M Ni
The effort exerted in conflict decreases with the degree of publicness of conflict prize when Ni< N ≡ MP. In this case ∂a∂λi <0 because ∂W∂λ <0.
If the group is small enough (smaller than thresholdN), the higher the degree of publicness of the reward, the smaller the effort exerted in winning the conflict. The contrary holds when the group is larger thanN.
4
Empirical Strategy
As we saw in the previous section, the effect ofpublicness of goods on conflict is not evident, and may either exacerbate or mitigate it depending on group size. This opens an empirical question on the sign and magnitude of the effect of publicness of goods on conflict.
To tackle this question we model the probability for an illegal army to commit an attack as:
1l [Ai >0] =α+θ1Ci+θ2Ri+θ3Ei+Xi′δ+ui, (6)
where 1l [Ai >0] is one of three measures of conflict. The first measure takes value one if
municipalityihas experienced at least one attack,A, by the guerrilla in the period 2000-2005; and zero otherwise. The second measure is defined similarly over the attacks undertaken by paramilitaries. The third measure takes value one if municipality i has been attacked by either the guerrilla or the paramilitaries (or both), and zero otherwise. Variable Ci is the
yearly average of coca crop hectares in municipalityi, Ri measures density of primary and
secondary roads (Km of roads/Area) in municipality i, Ei is the average education quality
in municipality i measured through a standardized national test. Vector Xi is a vector
of control variables of municipality i, including size of municipality (average population), geographical controls (longitude, latitude, temperature and rainfall), and welfare controls (education attaintment and poverty). Variable ui is the error term. The coefficients θj,
j = 1,2,3, are the coefficients of interest. They capture correlations between our goods of interest and conflict.
allow us to make predictions about the sign of coefficients. This is so because the theory relies on a composite prize. A-priori coefficients could have any sign. There is some evidence showing that coca production fuels conflict (Angrist and Kugler, 2008), but there is no much evidence about the effect of public goods.
Estimates of Equation (6) are very likely to be biased due to endogeneity issues. Conflict intensity may be a cause of expanding coca crop production (D´ıaz and S´anchez, 2004). At the same time, coca production may increase conflict (Angrist and Kugler, 2008). Many municipalities with high coca production could have previously been centres of guerrilla or paramilitary activity. We would thus like to distinguish between attacks due to fighting for controlling coca rents from attacks explained by a secular expansion of illegal armies in areas where the legal government is weak, that are optimal for guerrilla and paramilitaries to settle down.
Similarly, there is a double causality between the provision of public goods and conflict. Not only the provision of public goods may affect conflict, as pointed out by the theory, but conflict may also affect the provision of public goods. Barrera and Ib´anez (2004) have evidence showing that conflict lowers enrolment rates for all group of ages. The effect is larger for more vulnerable groups like women and youngsters, specially from indigenous people. Villegas and Duque (2009) report that part of the violent activity of illegal armies is against public infrastructures.
To deal with the endogeneity issues we use instrumental variables (IV). We instrument the provision of each of the three goods mentioned above. Although to estimate the model we use Maximum Likelihood, instead of Two-Stage Least Squares, posing the equations of both stages helps to understand the empirical strategy. Formally,
Gi = λ+ηIVi+Xi′ϑ+ǫi
1l [Ai >0] = ϕ+θGbi+Xi′ϕ+εi, (7)
whereGi is one of the goods mentioned above, either coca, road density or education quality,
in municipality i; IVi is the instrument of the good. The other variables are the same as
before. Our coefficient of interest is θ. It captures the causal effect of each good Gi on
conflict.
strategy”, a radar system implemented in the Amazonian zone to cut down the air bridge between Colombia and Peru. As a result, coca began to be produced in Colombia (Angrist and Kugler, 2008). As pointed out by Angrist and Kugler (2008) the best areas for future coca production are those with a preexisting coca presence. This makes the group of municipalities producing coca leaf relatively stable across time. We believe that this stability makes the instrument to meet the exclusion restriction.
The instrument for both public goods, road density and education quality, is the number of (primary and secondary) road kilometers in 1949 by municipality. This instrument is a proxy for the historical level of public good provision in each municipality.3
It is more likely to improve public goods provision in those municipalities that have already invested on them. One key advantage of our instrument is that is previous to the year in which the oldest Colombian guerrilla, FARC, was founded (1964). We believe the instrument fulfills the exclusion restriction because it is correlated with public good provision today but completely exogenous to the probability for a municipality to be attacked today.
Some caveats of our approach are in order. First, even if roads are needed for development in general, and the provision of public goods of different kind in particular, we expect the instrument to be more robust for road density than for education quality. Indeed, the road network in a point in time can guide the infrastructure policy on where to construct new roads. Second, welfare controls (average education attaintment and poverty) can also be correlated with the instrument. This might bias our results, in particular, can affect the estimates and significance of η in the first stage of Equation (7). Finally, ML estimator is very likely to not converge when the outcome is a dummy variable and there are more than one endogenous variable. For this reason we only report results introducing each endogenous variable, one by one.
Since our instruments are cross-section data, we collapse the other variables into averages using yearly data for the period 2000 - 2005. Using panel data together with cross-section IV could artificially reduce the standard errors of the estimates. The cost of using cross-section data is that we cannot introduce municipality fixed effects to sweep out the effect of unobserv-ables. Instead we introduce a complete battery of controls. As mentioned above we include size controls (population), geographical and climate controls (longitude, latitude, tempera-ture and rainfall), and welfare controls (education attaintment and poverty). Municipality size help to control for conflict scale. Geographical controls are fully exogenous and may help to explain some likelihood of conflict, related to strategic zones or strategic corridors for illegal armies. As shown in the next section most coca crops are toward the south and south-east of the country. Education attaintment and poverty may also explain some likelihood
of conflict and are measured in 1993, as a way to reduce the potential bias discussed above. Finally, we standardize all the explanatory variables to facilitate the comparison between the coefficients of interest.
5
Data and Descriptive Statistics
We build up a unique yearly cross-section database that comes from a collapsed panel data for the period 2000-2005, gathered from different sources. Data on the Colombian conflict comes from CERAC-URosario, an event-based database at the municipality level (1,002 Colombian municipalities). Data on coca crops comes from the Illicit Crop Monitoring System (SIMCI) managed by the United Nations Office on Drugs and Crime (UNODC) in Colombia. The data is gathered from satellite images, and flights and land verifications. Data on roads and geographic coordinates come from the National Geography Office (IGAC). The education quality measure is a language test score that comes from a national standardized test admin-istrated by the National Office for Education Quality (ICFES). Population size, education attaintment and poverty come from the National Statistics Office (DANE). Population size is yearly estimations based on population censuses. Education attaintment and poverty comes from 1993 population census. Data on temperature and rainfall comes from the National Weather Office (IDEAM).
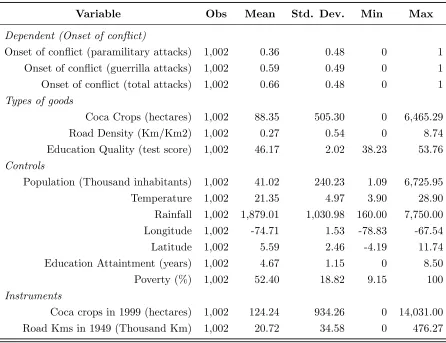
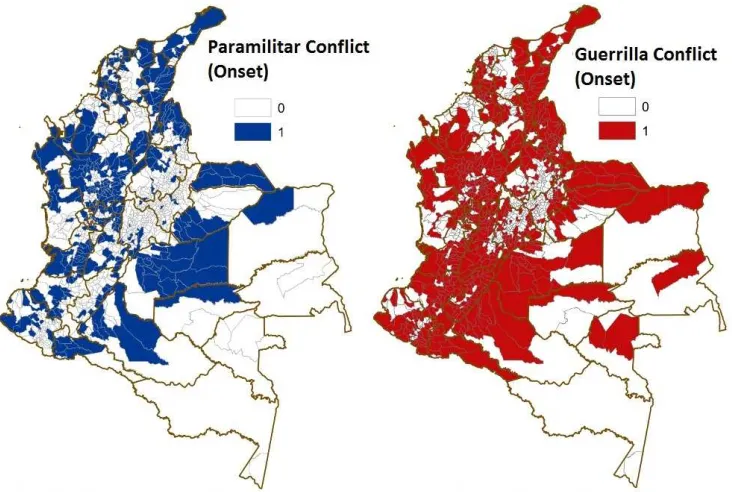
All Tables and Figures are in the Appendix A. In Table 1 we report the main descrip-tive statistics of the variables used in the empirical estimation. Regarding conflict, a given municipality has a probability of 36% to be attacked by the paramilitary and 59% to be attacked by the guerrilla, on average. In Figure 1 we report the spatial distribution of the onset of Colombian conflict for both paramilitaries and guerrilla. Both groups make attacks in practically all the Colombian territory except for the south where is located the northern part of the Amazonian jungle.
bad in the Magdalena Medio, and the worse education quality is concentrated in both the Pacific and Caribbean coasts.
Regarding controls, population size of Colombian municipalities ranges from one thousand to almost seven million inhabitants, with an average of 41 thousand inhabitants. Average temperature is 21 Celsius degrees and average rainfall is 1,879 millimeters per year. Educa-tion attaintment of household heads in 1993 was 4.67 years, on average. Around 52.4% of population is poor in 1993.
In 1999, 124.24 hectares of coca were cultivated in Colombian municipalities, on average. The country has experience a decrease of coca crops in the period of study. However, the larger production was concentrated in a smaller number of municipalities, namely, South of the country, North of Santander and South Bolivar (see Figure 3). In 1949, municipalities with the smallest quantity of primary and secondary roads were evenly distributed across Colombian Departments. Municipalities with no roads are very often far from the respective Department capital.
6
Main Results
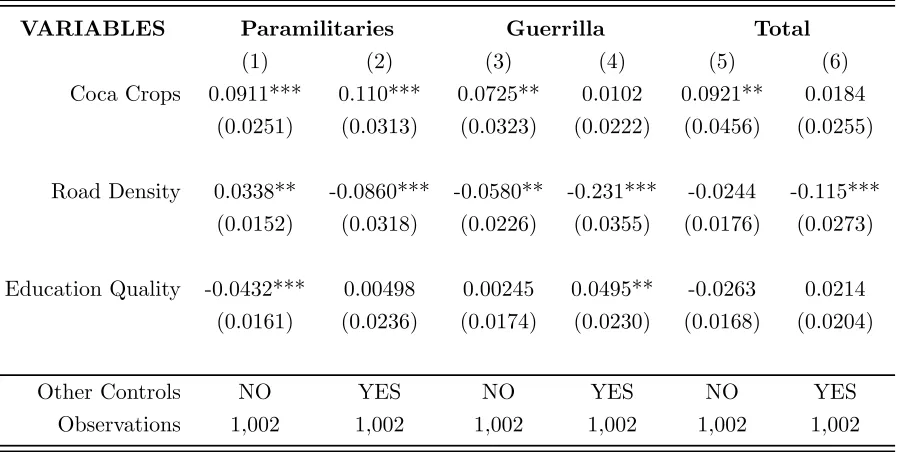
All tables are reported in Appendix A. As a baseline set of results in Table 2 we report the estimations of Equation (6). These are ”naive” estimations because do not tackle endogeneity issues. For each measure of conflict we report coefficients with (columns with even numbers) and without (columns with odd numbers) controls. As pointed out above the correlation between coca and conflict is positive, although not always significant. It is always significant for the onset of paramilitary attacks, but it is not for guerrilla attacks once we introduce controls. Since the incidence of guerrilla attacks is larger than that of paramilitary attacks, total attacks become not significant in the specifications with controls. Correlation between road density and conflict seems to be negative. It is significant for all measures of conflict once we introduce controls. Correlation between education quality and conflict is more erratic both in magnitude and sign. Specifications with controls show a positive correlation (the one for guerrilla attacks is significant). None of these results show the ordering of coefficients that we expect from the theory.
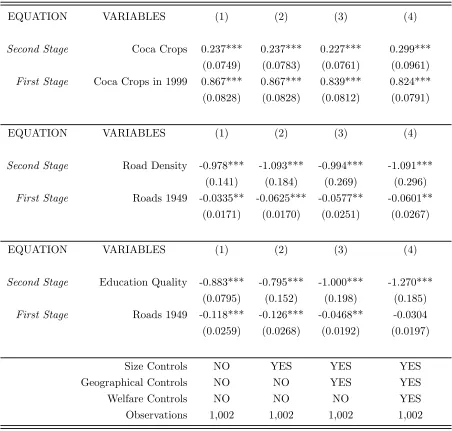
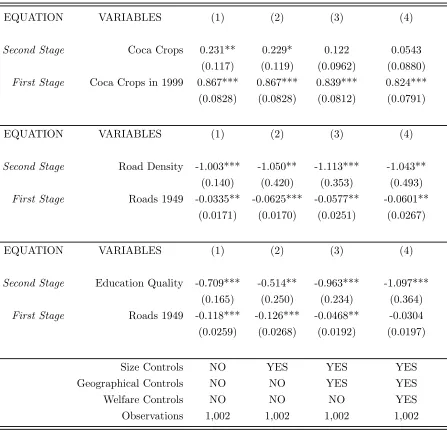
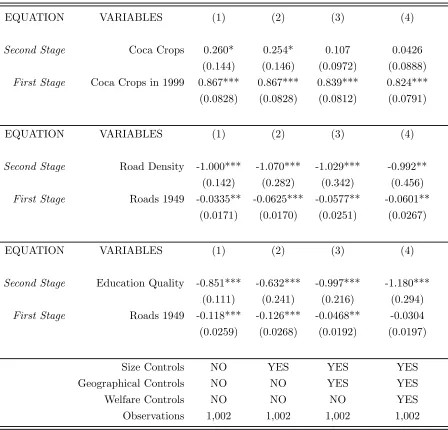
Estimates of the coefficient of interest in Equation (7) for paramilitary, guerrilla and total attacks are reported in Tables 3, 4 and 5, respectively.4
Each of those tables has three panels and four columns. We report the results of coca crops in the first panel, those of road density in the second panel and those of education quality in the third panel. We progressively add
control in the subsequent columns. In the first column we report estimates with no controls, in the second column we add size controls, in the third one we introduce geographical controls, and in the fourth column we finally add welfare controls.
Regarding the first-stage estimates, the instrument coefficient is stable in magnitude. It is also significant in all specifications except for education quality with all controls (Panel 3, Column (4) of all tables). As mentioned in the empirical strategy section, this is likely to happen when controls are not exogenous. Roads in 1949 might not only affect current edu-cation quality, but also eduedu-cation attaintment and poverty. For this reason, our benchmark results for education quality should be those reported in Columns (3). We still report results with all controls (Column (4)) for completeness reasons.
The onset of paramilitary attacks increases with coca crops and reduces with road density and education quality (see Table 3). All coefficients in the second-stage are significant and stable in magnitude. Strikingly, once we control for geographical variables (Columns (3) and (4)), the ordering of coefficients is the one predicted by the theory for small groups, meaning that conflict onset reduces with the publicness degree of the composite prize.
The onset of guerrilla attacks seem to increases with coca crops, but the coefficient is not significant anymore once we introduce geographical controls (see Table 4). The likelihood of suffering a guerrilla attack reduces with road density and education quality. Their coefficients are very stable and significant across all specifications. Even though the estimates of the coca coefficient is not significant in specifications with geographical and welfare controls (columns (3) and (4)), the ordering of coefficients predicted by the theory for small groups is maintained.
The onset of total attacks reflect the results for guerrilla (see Table 5). Results in Column (4) are ordered according to the theoretical predictions. All coefficients are stable in magni-tude, although the estimates of the effect of coca on conflict are not significant anymore once we introduce geographical and welfare controls.
7
Final Remarks
Is there any empirical evidence regarding the impact of public goods on the onset of conflict? Is there any relation between the degree of publicness of the expected prize from conflict and the probability of suffering and attack? To answer these questions, this paper has addressed an important and still unveiled issue regarding the determinants of the onset of violent conflicts.
conflict depends on group size. If the group in conflict is small (large) enough, conflict likelihood decreases (increases) with good publicness.
In the empirical exercise, we use three goods with different degree of publicness, namely, coca crops (private good), road density (impure public good) and education quality (purer public good), to estimate the effect of publicness on conflict. Our main findings show that the likelihood of conflict goes down with the degree of publicness. According to the previous literature, coca crops makes conflict more likely. Moreover, the provision of public goods makes conflict less likely. Policy recommendations are straightforward. Most policy efforts have been put in the war against drugs, including, coca eradication. Those efforts must be complemented with large investments in public goods.
Finally, the results for the onset of guerrilla attacks are a bit less neat than those for paramilitary attacks. As suggested by the theory, this could be explained by differences in group sizes across paramilitary and guerrilla armies. Other explanations are possible. It seems that during the 2000s the guerilla was already controlling large zones of coca production. This may help to explain why coca crops might not increase guerrilla attacks. Besides, even though both guerrilla and paramilitary have well defined national commands in the period 2000-2005, guerrilla fronts5
seem to be more decentralized than paramilitaries, so that they have more room to take decisions on their own beyond the national command directives. This opens a line for future research.
References
[1] Acemoglu, D., Robinson, J.A., Santos, R.J., 2009. The Monopoly of Violence: Evidence from Colombia. NBER Working Paper 15578.
[2] Angrist, J., Kugler, A., 2008. Rural windfall or a new resource curse? coca, income and civil conflict in Colombia. The Review of Economics and Statistics 90(2): 191-215.
[3] Barrera, F., Ib´a˜nez A., 2004. Does Violence Reduce Investment In Education? A Theo-retical And Empirical Approach. Documentos CEDE No. 2004-27. Bogot´a: Universidad de los Andes.
[4] Chamberlin, J.R., 1974. Provision of collective goods as a function of group size. Amer-ican Political Science Review 68: 707-716.
[5] D´ıaz, A.M., S´anchez, F., 2004. Geography of Illicit Crops (Coca Leaf) and Armed Con-flict in Colombia. The Development Research Centre, Development Studies Institute, London School of Economics (February 2004).
[6] Dube, O., Vargas, J.F., 2013. Commodity Price Shocks and Civil Conflict: Evidence from Colombia. Review of Economic Studies. F orthcoming.
[7] Due˜nas, L., Sanch´ez, F., 2007. Does Armed Conflict Affect the Poorest? The Case of School Dropout in Eastern Colombia. Working Paper. Bogot´a: Universidad de los Andes.
[8] Esteban, J., Mayoral, L., Ray, D., 2012. Ethnicity and Conflict: An Empirical Study. American Economic Review 102(4): 1310-42.
[9] Esteban, J., Ray, D., 2001. Collective action and the group size paradox. American Political Science Review, 95 (3): 663-672.
[10] Esteban, J., Ray, D., 2011. Linking Conflict to Inequality and Polarization. American Economic Review 101(4): 1345-74.
[11] Frankel, J., 2010. The Natural Resource Curse: a Survey, NBER Working Paper No. 15836
[12] Katz, E., Nitzan, S., Rosenberg, J., 1990. Rent-seeking for pure public goods. Public Choice 65: 49-60.
[13] Kay, B., 1999. Violent Opportunities: The Rise and Fall of ’King Coca’ and Shinning Path, Journal of Interamerican Studies and World Affairs 41(3): 97-127.
[14] Miguel, E., Satyanath, S., Sergenti, E., 2004. Economic Shocks and Civil Conflict: An Instrumental Variables Approach. Journal of Political Economy 112(4): 725-753.
[15] Ministry of National Defense of Colombia, 2000. El narcotr´afico: una amenaza para la seguridad nacional. October, 2000.
[16] Nti, K.O., 1998. Effort and performance in group contests. European Journal of Political Economy 14(4): 769-778.
[17] Olson, M., 1965. The Logic of Collective Action: Public Goods and the Theory of Groups, Harvard Univ. Press, Cambridge, MA, 1965.
[19] Rodr´ıguez, C., S´anchez, F., 2010. Books and Guns. The Quality of Schools in Conflict Zones. Documentos CEDE No. 2010-38. Bogot´a: Universidad de los Andes.
[20] S´anchez, F., D´ıaz. A., 2005. Los efectos del conflicto armado en el desarrollo social colombiano, 1990-2002. Documentos CEDE No. 2005-58. Bogot´a: Universidad de los Andes.
[21] United States General Accounting Office, National Security and International Affairs Division, 1994. Drug Control: US Drug Interdiction Issues in Latin America, October 1994.
A
Tables and maps
Table 1: Descriptive statistics
Variable Obs Mean Std. Dev. Min Max
Dependent (Onset of conflict)
Onset of conflict (paramilitary attacks) 1,002 0.36 0.48 0 1
Onset of conflict (guerrilla attacks) 1,002 0.59 0.49 0 1
Onset of conflict (total attacks) 1,002 0.66 0.48 0 1
Types of goods
Coca Crops (hectares) 1,002 88.35 505.30 0 6,465.29
Road Density (Km/Km2) 1,002 0.27 0.54 0 8.74
Education Quality (test score) 1,002 46.17 2.02 38.23 53.76
Controls
Population (Thousand inhabitants) 1,002 41.02 240.23 1.09 6,725.95
Temperature 1,002 21.35 4.97 3.90 28.90
Rainfall 1,002 1,879.01 1,030.98 160.00 7,750.00
Longitude 1,002 -74.71 1.53 -78.83 -67.54
Latitude 1,002 5.59 2.46 -4.19 11.74
Education Attaintment (years) 1,002 4.67 1.15 0 8.50
Poverty (%) 1,002 52.40 18.82 9.15 100
Instruments
Coca crops in 1999 (hectares) 1,002 124.24 934.26 0 14,031.00
Table 2: Naive estimations
VARIABLES Paramilitaries Guerrilla Total
(1) (2) (3) (4) (5) (6)
Coca Crops 0.0911*** 0.110*** 0.0725** 0.0102 0.0921** 0.0184
(0.0251) (0.0313) (0.0323) (0.0222) (0.0456) (0.0255)
Road Density 0.0338** -0.0860*** -0.0580** -0.231*** -0.0244 -0.115***
(0.0152) (0.0318) (0.0226) (0.0355) (0.0176) (0.0273)
Education Quality -0.0432*** 0.00498 0.00245 0.0495** -0.0263 0.0214
(0.0161) (0.0236) (0.0174) (0.0230) (0.0168) (0.0204)
Other Controls NO YES NO YES NO YES
Observations 1,002 1,002 1,002 1,002 1,002 1,002
Table 3: Onset of conflict (IV estimates): Paramilitaries attacks
EQUATION VARIABLES (1) (2) (3) (4)
Second Stage Coca Crops 0.237*** 0.237*** 0.227*** 0.299***
(0.0749) (0.0783) (0.0761) (0.0961)
First Stage Coca Crops in 1999 0.867*** 0.867*** 0.839*** 0.824***
(0.0828) (0.0828) (0.0812) (0.0791)
EQUATION VARIABLES (1) (2) (3) (4)
Second Stage Road Density -0.978*** -1.093*** -0.994*** -1.091***
(0.141) (0.184) (0.269) (0.296)
First Stage Roads 1949 -0.0335** -0.0625*** -0.0577** -0.0601**
(0.0171) (0.0170) (0.0251) (0.0267)
EQUATION VARIABLES (1) (2) (3) (4)
Second Stage Education Quality -0.883*** -0.795*** -1.000*** -1.270***
(0.0795) (0.152) (0.198) (0.185)
First Stage Roads 1949 -0.118*** -0.126*** -0.0468** -0.0304
(0.0259) (0.0268) (0.0192) (0.0197)
Size Controls NO YES YES YES
Geographical Controls NO NO YES YES
Welfare Controls NO NO NO YES
Observations 1,002 1,002 1,002 1,002
Table 4: Onset of conflict (IV estimates): Guerrilla attacks
EQUATION VARIABLES (1) (2) (3) (4)
Second Stage Coca Crops 0.231** 0.229* 0.122 0.0543
(0.117) (0.119) (0.0962) (0.0880)
First Stage Coca Crops in 1999 0.867*** 0.867*** 0.839*** 0.824***
(0.0828) (0.0828) (0.0812) (0.0791)
EQUATION VARIABLES (1) (2) (3) (4)
Second Stage Road Density -1.003*** -1.050** -1.113*** -1.043**
(0.140) (0.420) (0.353) (0.493)
First Stage Roads 1949 -0.0335** -0.0625*** -0.0577** -0.0601**
(0.0171) (0.0170) (0.0251) (0.0267)
EQUATION VARIABLES (1) (2) (3) (4)
Second Stage Education Quality -0.709*** -0.514** -0.963*** -1.097***
(0.165) (0.250) (0.234) (0.364)
First Stage Roads 1949 -0.118*** -0.126*** -0.0468** -0.0304
(0.0259) (0.0268) (0.0192) (0.0197)
Size Controls NO YES YES YES
Geographical Controls NO NO YES YES
Welfare Controls NO NO NO YES
Observations 1,002 1,002 1,002 1,002
Table 5: Onset of conflict (IV estimates): Total attacks
EQUATION VARIABLES (1) (2) (3) (4)
Second Stage Coca Crops 0.260* 0.254* 0.107 0.0426
(0.144) (0.146) (0.0972) (0.0888)
First Stage Coca Crops in 1999 0.867*** 0.867*** 0.839*** 0.824***
(0.0828) (0.0828) (0.0812) (0.0791)
EQUATION VARIABLES (1) (2) (3) (4)
Second Stage Road Density -1.000*** -1.070*** -1.029*** -0.992**
(0.142) (0.282) (0.342) (0.456)
First Stage Roads 1949 -0.0335** -0.0625*** -0.0577** -0.0601**
(0.0171) (0.0170) (0.0251) (0.0267)
EQUATION VARIABLES (1) (2) (3) (4)
Second Stage Education Quality -0.851*** -0.632*** -0.997*** -1.180***
(0.111) (0.241) (0.216) (0.294)
First Stage Roads 1949 -0.118*** -0.126*** -0.0468** -0.0304
(0.0259) (0.0268) (0.0192) (0.0197)
Size Controls NO YES YES YES
Geographical Controls NO NO YES YES
Welfare Controls NO NO NO YES
Observations 1,002 1,002 1,002 1,002
B
Complete results
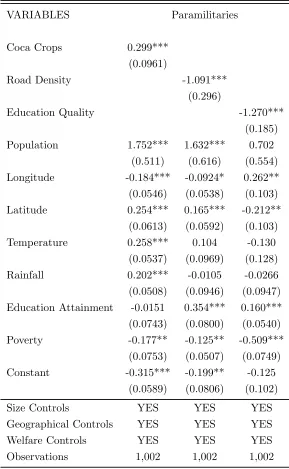
Table B.1: IV Estimates for paramilitary attacks with full set of controls
VARIABLES Paramilitaries
Coca Crops 0.299***
(0.0961)
Road Density -1.091***
(0.296)
Education Quality -1.270***
(0.185)
Population 1.752*** 1.632*** 0.702
(0.511) (0.616) (0.554)
Longitude -0.184*** -0.0924* 0.262**
(0.0546) (0.0538) (0.103)
Latitude 0.254*** 0.165*** -0.212**
(0.0613) (0.0592) (0.103)
Temperature 0.258*** 0.104 -0.130
(0.0537) (0.0969) (0.128)
Rainfall 0.202*** -0.0105 -0.0266
(0.0508) (0.0946) (0.0947)
Education Attainment -0.0151 0.354*** 0.160***
(0.0743) (0.0800) (0.0540)
Poverty -0.177** -0.125** -0.509***
(0.0753) (0.0507) (0.0749)
Constant -0.315*** -0.199** -0.125
(0.0589) (0.0806) (0.102)
Size Controls YES YES YES
Geographical Controls YES YES YES
Welfare Controls YES YES YES
Observations 1,002 1,002 1,002
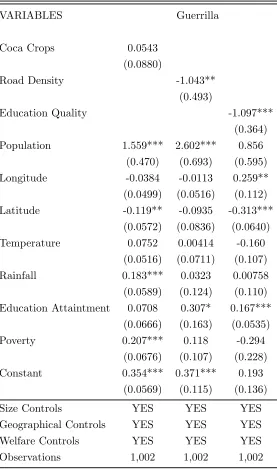
Table B.2: IV Estimates for guerrilla attacks with full set of controls
VARIABLES Guerrilla
Coca Crops 0.0543
(0.0880)
Road Density -1.043**
(0.493)
Education Quality -1.097***
(0.364)
Population 1.559*** 2.602*** 0.856
(0.470) (0.693) (0.595)
Longitude -0.0384 -0.0113 0.259**
(0.0499) (0.0516) (0.112)
Latitude -0.119** -0.0935 -0.313***
(0.0572) (0.0836) (0.0640)
Temperature 0.0752 0.00414 -0.160
(0.0516) (0.0711) (0.107)
Rainfall 0.183*** 0.0323 0.00758
(0.0589) (0.124) (0.110)
Education Attaintment 0.0708 0.307* 0.167***
(0.0666) (0.163) (0.0535)
Poverty 0.207*** 0.118 -0.294
(0.0676) (0.107) (0.228)
Constant 0.354*** 0.371*** 0.193
(0.0569) (0.115) (0.136)
Size Controls YES YES YES
Geographical Controls YES YES YES
Welfare Controls YES YES YES
Observations 1,002 1,002 1,002
Table B.3: IV estimates for total attacks with full set of controls
VARIABLES Total
Coca Crops 0.0426
(0.0888)
Road Density -0.992**
(0.456)
Education Quality -1.180***
(0.294)
Population 2.272*** 2.946*** 1.146
(0.732) (1.010) (0.863)
Longitude -0.0752 -0.0447 0.262**
(0.0516) (0.0519) (0.110)
Latitude -0.0632 -0.0222 -0.292***
(0.0597) (0.0709) (0.0687)
Temperature 0.130** 0.0401 -0.154
(0.0517) (0.0798) (0.110)
Rainfall 0.208*** 0.0383 0.00435
(0.0633) (0.129) (0.113)
Education Attaintment 0.102 0.344*** 0.182***
(0.0706) (0.132) (0.0548)
Poverty 0.186*** 0.0815 -0.352*
(0.0692) (0.101) (0.187)
Constant 0.609*** 0.564*** 0.302
(0.0797) (0.204) (0.220)
Size Controls YES YES YES
Geographical Controls YES YES YES
Welfare Controls YES YES YES
Observations 1,002 1,002 1,002