FACULTAD LATINOAMERICANA DE CIENCIAS SOCIALES SEDE ECUADOR
PROGRAMA DE ECONOMÍA CONVOCATORIA 2008-2010
TESIS PARA OBETENER EL TÍTULO DE MAESTRÍA EN CIENCIAS SOCIALES CON MENCIÓN EN ECONOMÍA DEL DESARROLLO
PROFIT TAX WITH HOLDINGS AND FIRMS’ COMPLIANCE BEHAVIOR IN ECUADOR
ANA MERCEDES RIVADENEIRA ALAVA
OCTUBRE 2010
FACULTAD LATINOAMERICANA DE CIENCIAS SOCIALES SEDE ECUADOR
PROGRAMA DE ECONOMÍA CONVOCATORIA 2008-2010
TESIS PARA OBETENER EL TÍTULO DE MAESTRÍA EN CIENCIAS SOCIALES CON MENCIÓN EN ECONOMÍA DEL DESARROLLO
PROFIT TAX WITH HOLDINGS AND FIRMS’ COMPLIANCE BEHAVIOR IN ECUADOR
ANA MERCEDES RIVADENEIRA ALAVA
ASESOR DE TESIS: Paúl E. Carrillo, Ph.D.
LECTORES/AS: Miguel Acosta A., Dr.
DEDICATORIA
CONTENTS
ABSTRACT ... iv
CHAPTER I INTRODUCTION ... 1
CHAPTER II LITERATURE REVIEW ON TAX EVASION ... 4
Firms and tax evasion ... 9
CHAPTER III ECUADOR’S INSTITUTIONAL BACKGROUND ... 13
Brief history of the Ecuadorian Tax System during the 20th century ... 13
Tax Laws and Regulations in the 21st century ... 15
The Ecuadorian Income Tax and Withholding System ... 17
CHAPTER IV WITHHOLDINGS AND BUNCHING ... 21
Data and Descriptive Statistics ... 21
Graphical evidence... 22
The empirical model ... 24
Results ... 25
CHAPTER V BUNCHING AND FRAUD ... 27
Data ... 27
The empirical model ... 28
Results ... 29
CHAPTER VI A PROFILE OF THE TAX EVADING FIRM ... 31
Data ... 31
The empirical model ... 31
Results ... 32
CHAPTER VII CONCLUSIONS ... 35
APPENDIX B: TABLES ... 44
TABLES
ABSTRACT
This investigation analyzes Ecuadorian firms’ compliance behavior. Using firm-level data from the Tax Administration Agency in Ecuador (SRI), we compute the distribution of firms’ 2006 profit-tax/income ratio (tax-burden) and show the existence of obvious spikes just around the firms’ withholding requirements. While the theory suggests that tax evasion or tax avoidance could explain these patterns, one cannot rule out other explanations.
To test whether this evidence shows irregular (tax-evading) behavior from firms or just the actual distribution of profit tax burden, we use a quasi-experimental approach. Withholding requirements in Ecuador vary by industry and have changed over time: for some industries (manufacturing, construction and wholesale trade) they increased from 1 to 2 percent in June 2007; for other industries (transport) they remained constant at 1 percent. Bunching patterns around the withholding rates are clearly seen in all industries in 2006 and radically change in 2007 only for those industries where withholding rates were raised. In our view, this evidence suggests that firms who bunch in 2006 are more likely to manipulate their tax returns. Presumably, firms whose true tax obligation exceeds their withheld amount may choose to maneuver their tax return and declare a lower tax that closely matches their withheld funds.
While we cannot assess if firms who bunch around their withholding rates are
evading taxes rather than avoiding taxes, we can investigate if that group of firms is more likely to declare incorrect information to the tax authority. To achieve this task, we have been able to gather information about self-reported and third-party reported sales and exports for most of the firms in our panel. Having two sources of information allows us to compare whether firms misreport income on their profit-tax returns. Using simple linear regression models, it is found that, indeed, firms that bunch evidence systematic larger differences between the sales they declare and what other firms declare have bought from them.
CHAPTER I INTRODUCTION
Tax withholding is an instrument used by many countries and has been generally perceived as an effective tool to combat tax evasion. While in most jurisdictions withholding a tax applies to employment income, in many developing countries a fixed percentage of firms’ sales is also withheld at the time when a transaction is made. The withheld amount can be typically applied as a payment on the firm’s profit-tax liability (tax credit). Clearly, such instrument increases firms’ transaction and capital costs. But more importantly, withholding rates create a “threshold” that can potentially affect the way that firms report their taxable profits.
In Ecuador, the income (profit) tax withholding system is the obligation of some taxpayers (withholding agents) to deduct part of the payment when purchasing a good or service. This deduction takes place only if the payment is taxable income for those who receive it. Withholding agents must file an income tax withholding return on a monthly basis. The total amount withheld from a firm’s sales is deductible from its annual profit tax liability.
The withholding system could restrict firms’ liquidity because it reduces companies’ monthly income. Since withholding rates are modified by the tax authority without previous announcement, companies cannot use this information in their annual financial planning. Firms could, however, resort to tax evasive behavior in order to minimize this negative effect. Given the fact that the withheld amount can be typically
applied as an advance payment on the firm’s profit tax liability, the firm could have the incentive to adjust its annual profit –underreporting its sales or overstating its expenses and costs– to the point where the income tax liability equals the amount withheld from the firm during the year.
the true distribution of profits and set the “right” withholding rate –one that maximizes taxpayers compliance and makes sure they pay the correct tax amount. To test if this is the case, we use a quasi-experimental approach. Withholding requirements in Ecuador vary by industry and have changed over time: for some industries (manufacturing, construction and wholesale trade) they increased from 1 to 2 percent in June 2007; for other industries (transportation) they remained constant at 1 percent. Bunching patterns around the withholding rates are clearly seen in all industries in 2006 and radically change in 2007 only for those industries where withholding rates were raised. In our
view, this evidence suggests that firms who bunch in 2006 are more likely to manipulate their tax returns. Presumably, firms whose true tax obligation exceeds their withheld amount may choose to maneuver their tax-declaration and declare a lower tax that closely matches their withheld funds.
While we cannot assess if firms who bunch around their withholding rates are evading taxes rather than avoiding taxes, we can investigate if that group of firms is more likely to declare incorrect information to the tax authority. To achieve this task, we have been able to gather information about self-reported and third-party reported sales and exports for most of the firms in our panel. Having two sources of information allows us to compare whether firms misreport income on their profit-tax returns. Using simple linear regression models, it is found that, indeed, firms that bunch evidence systematic larger differences between the sales they declare and what other firms declare have bought from them.
In our view, this combined evidence suggests that firms who bunch around the withholding rates are more likely to misreport taxes and auditing efforts should be focused around them. For auditing and control purposes it is useful to construct a profile of such firms. Besides firms’ characteristics, we have gathered information about the demographic characteristics of the firm’s general manager, such as his/her gender, age, education and marital status (using administrative records from the Ecuadorian Civil Registry). It is found that medium size firms in the Ecuadorian Coastal region leaded by a single male general manager are significantly more likely to bunch and, thus, may be more likely to misreport their tax declarations.
CHAPTER II
LITERATURE REVIEW ON TAX EVASION
Nearly four decades ago tax evasion and its determinants became a subject of interest to researchers. The relevance of this field has been a result of governments’ concern about the combination of three factors: fiscal sustainability of the Welfare State, political costs of excessive taxation and institutionalization of fiscal stability –which limits the use of deficit and indebtedness to finance public expenditure–, especially in Europe (Martínez et al., 2009: 1-2). Tax noncompliance has also been one of the main problems explaining underperformance of tax systems in developing countries. In this case, informality is particularly important. This chapter focuses on the theoretical and empirical research on tax evasion and (non-)compliance. We follow Martínez et al. (2009)’s work which contains a vast survey on tax evasion literature.
Tax evasion has been addressed from different perspectives. The analysis of individual behavior towards income taxes has been predominant. It is only more recently that firms have become the agent under study and other types of taxes are being considered (Martínez et al., 2009: 3-5). Though this survey will make a brief assessment of the most important approaches to tax compliance, we will devote more space to the part of literature that looks into firms and their specificities.
Formal economic investigation on tax evasion started as an extension of expected utility theory. Allingham and Sandmo (1972) is considered to be the pioneer work in this field. The authors’ objective was to analyze the individual decision on
endogenously determined probability of detection– (Allingham and Sandmo, 1972: 327-332). The dynamic model –which incorporates the individual’s declaration decisions in different periods, under the fact that if he is caught evading in period t he is discovered in all previous periods and must pay a greater penalty– concludes that tax evasion is a short-sighted decision (pp. 332-337).
Srinivasan (1973), Yitzhaki (1974), Christiansen (1980) and others follow a similar approach to individual tax evasion –as a portfolio allocation problem– (Franzoni, 1998: 5). Later extensions within the basic model came with the introduction
of endogenous income, dynamic effects, uncertain audit results, vertical equity and individual’s honesty (Martínez et al., 2009: 7). However, expected utility models of tax evasion delivered questionable results, not entirely consistent with empirical evidence.
That all taxpayers evade taxes as long as net return on evasion is positive and that they only respond to deterrent policy contrasted with the fact that some people pay their taxes in spite of very low probabilities of detection and punishment; it was also contrary to the observed compliance levels (Martínez et al., 2009: 10-11). There were other determinants of individual behavior that were not being considered. Even Allingham and Sandmo (1972) recognized that “[…] in addition to the income loss there may be other factors affecting utility if one’s attempt to tax evasion is detected. These factors may perhaps be summarily characterized as affecting adversely one’s reputation as a citizen of the community; […]” (p. 326). Social and moral considerations as well as attitudes towards the government and perceptions of fairness were later introduced in the analysis of individual compliance behavior after empirical findings showed its importance.
Empirical studies were initially scarce because of the difficulty to measure tax evasion –it is meant to be concealed–. Data was either confidential or unreliable. From the 80s, however, empirical evidence on tax compliance started to blossom. And although this type of research lacked a theoretical framework, according to Andreoni et al. (1998), it was able to inspire theoretical developments later on (Martínez et al., 2009). Empirical studies have attempted to estimate the size and the determinants of tax evasion; Clotfelter (1983) was the pioneer work of this type. (Franzoni, 1998: 9)
econometric models, whose primary interest has been to evaluate explanatory power of the traditional approach to tax evasion. They generally estimate some measure of evaded income as a function of fiscal parameters, personal income and types of income. Among the principal studies are Clotfelter (1983), Witte and Woodbury (1985), Dubin et al. (1987), Feinstein (1991), Erard (1992), Martínez-Vazquez y Rider (2003). According to Cowell (2004), the main results of these econometric studies are: compliance is determined by income type and socio-economic characteristics of individuals; income source is stronger that income level in explaining tax evasion (i.e.
self-employment income is less reported than wage income); higher income is associated with higher amounts of underreported income; relationship between tax compliance and detection probability and severity of penalties is positive but weak; groups with higher marginal tax rates show less compliance but since these groups differ from those taxed with lower marginal rates, the effect could be through the difference in income or risk preferences –later work shows a weak effect of income on tax evasion and a negative impact of marginal tax rates; variations in detection rates are at least as important as variations in personal characteristics.
This last result takes us to the second group of empirical studies: those based on survey data. The advantage of this approach is that survey data have socioeconomic, demographic, and attitudinal variables which allow the analysis of the importance of personal traits explaining the predisposition to comply or evade taxes. On the other hand, survey data could be inaccurate since information is self-reported. Models based on this methodology tend to overestimate compliance (Andreoni et al., 1998: 837). These non-economic determinants of tax compliance –such as taxpayers’ characteristics, their perceptions about taxes and the fiscal system, values, attitudes and moral– have been suggested by other social sciences –namely, psychology and sociology. The first references are the works of Schmölders (1970), Vogel (1974), Spicer and Lundstedt (1976). Two groups can be distinguished within this approach: those that emphasize personal standards guiding tax compliance behavior and those which concentrate on social norms. In the first group we find Groeland and Val Veldhoven (1983), Porcano (1988), Reckers et al. (1994). In the second group we could
or tax morale as in De Juan et al. (1994) and Torgler and Schneider (2004). (Martínez et al., 2009)
The main results obtained by survey studies, though not conclusive and ambiguous, are (Martínez et al., 2009: 24-26): besides economic variables included in the traditional approach, other personal characteristics help explain tax evasion; a positive attitude towards taxes and the fiscal and political arrangements improves compliance; predisposition to comply (or not) depends on personal comparisons with a reference group as well as on fairness and justice considerations; income sources are
important since they imply different opportunities for tax evasion.
Finally, the third group of empirical research is composed studies that rely on laboratory experiments. The methodology consists of games simulating tax compliance situations where individuals (often students) can participate –they can underreport and incur the risk of penalty and are rewarded according to their performance at the end of the game– (Franzoni, 1998: 11-12). The main contribution of experimental methods is that they provide a proper setting to analyze taxpayers’ motivations and, therefore, the impacts of incentives on taxpayer compliance. Among this group we can find Spicer y Becker (1980), Baldry (1987), Webley (1987), Robben et al. (1990), Alm, McClelland y Schulze (1991), Alm, Sanchez y De Juan (1995), Bosco y Mittone (1997), Alm y Mckee (2000), Cumming, Martínez-Vazquez and Mckee (2001). (Martínez et al. 2009: 26-31)
Experimental economics of tax compliance has led to the following conclusions, according to Cowell (2004): there is no compelling evidence that taxpayers act as predicted by the traditional model of choice under uncertainty when it comes to tax evading decisions; the structure of taxation is more relevant than tax rates and exemptions; results related to audit parameters are similar to those of microeconometric analyses –the greater the probability of detection the greater compliance will be–; experiments show a higher degree of compliance than theory predicts; when associated with public goods provision, compliance improves.
Empirical research on tax evasion evidences the need to consider other non-economic factors if we are to reach a better understanding of individual behavior. That is why later theoretical developments include (Martínez et al. 2009: 37-73) (Cowell,
- Extensions to the traditional expected utility model. These include: strategic models of interaction between taxpayer and tax authorities with pre-commitment of the second to and audit strategy and without commitment; models including moral and social bearings as arguments in the utility function, horizontal and vertical equity considerations, trust in government; models of multiple alternatives of evasion; models that take into account the role of tax preparers or advisors which can be assumed to improve compliance or to increase noncompliance; tax evasion and labor supply models.
- Prospective theory, which is an alternative view of choice under uncertainty. It challenges the individual rationality assumption and focuses on agent’s behavior towards gains and losses considering her initial situation as a reference point. Thus, an asymmetry arises in such behavior since the individual is more risk averse to losses than attracted to gains. Prospective theory separates the decision-making process in two stages: framing and evaluation.
- Equity theory is a body of literature that considers individual willingness to comply under a more general setting that integrates different elements or motivation sources. This literature assumes that taxpayer and the State have a relationship in which the later provides public goods and services and the former pays for them through taxes. This and the individual judgments about how fair this exchange is affect compliance decisions. Vertical and horizontal equity also lead to some important and mixed conclusions.
- Trust theory comes from the idea of the State as a community where trust between citizens and the government play an important role in taxpayers’ decisions to comply or not.
- Tax morale is defined as the intrinsic motivation to pay taxes, which is related to civic virtue, ethics, and moral considerations about taxation. Investigations in this area try to find individual and aggregated determinants of tax morale.
- Motivation crowding theory focuses on the role of authorities and their capacity to influence individuals’ motivation which has different motivation sources: extrinsic motivation –incentives that come from the outside–, intrinsic
consider the existence of external interventions that crowd-out internal motivation, and of external interventions that enhance it. Generally, external intervention produce a crowding-out effect when they are perceived as intrusive; they produce a crowding-in effect if they are thought to be constructive.
Firms and tax evasion
As previously mentioned the analysis of firms’ tax behavior is more modest than the
individuals’. In this section we devote to describing the advances on firms’ tax compliance.
The earliest work studied the firm’s behavior from the same theoretical framework of individual taxpayers and focused on the more simple market structures – competitive and monopolistic–. Their objective was to find the influence of evasion and tax policy on production and pricing decisions. References that take this approach are Cremer and Gahvari (1993), Virmani (1989), Marelli (1984), Marelli and Martina (1988), Myles (1995), Yaniv (1995) and (1996), Etro (1998), among others. Their most important result is the separability property of tax decisions and market decisions, which holds for noncompetitive markets under the risk neutrality assumption (Martínez et al., 2009: 73-77).
The standard approach is a model of a firm with constant average and marginal costs that faces a uniform tax rate on sales or profits (Cowell, 2004: 244-245). The firm must choose output and evasion level to maximize expected profits, which depend on price, marginal cost, concealment costs and output. The firm chooses output and the amount of concealment separately. In the competitive case, output decisions are taken with the price equal marginal cost rule. The firm always conceals part of its output (profit) if expected tax rate is lower than effective tax rate. Results from comparative statics are: reported sales (profit) decrease when tax rate increases; increases in tax rates translate into price increases but in a smaller proportion because part of it is assimilated increasing evasion; the greater probability of detection or penalties are the larger the proportion of declared sales, expected tax rate and market price will be. This approach
reduces evasion; but, in contrast, a rise in tax rate causes an unambiguous increase in evasion.
However, Cowell (2004) points three aspects in which firms and individuals differ. The first one is the nature of the taxpayer. As opposed to individuals or households, firms are endogenously determined in the sense that they emerge, shape or disappear as a response to economic incentives; the tax regime and enforcement mechanisms are among those incentives. The second difference is risk preferences. While in individual analysis we get the whole range between full and zero compliance
whether we assume risk neutrality or high risk aversion, firm analysis requires the neutrality assumption for the separability result to hold.
The third distinction between individual and firm behavior has to do with responsiveness to incentives. Usually, individuals have different responses to penalties or audit probabilities as a result of different degrees of risk aversion (in the traditional model). Firms, on the other hand, base their evading decisions on costs of concealment and the rate of return. These parameters –and responsiveness to incentives– change with the nature of the firm’s product (so industry categories are important), the size and organizational structures of the firm (more complex organizations should have higher concealment costs), the role of reputation (which imposes a higher costs to firms with a recognized brand name), and the degree of concentration of the industry (which could increase or decrease noncompliance costs).
Other particular features of firms related to compliance are the role of the interaction between firms and third parties (Cowell, 2006) and the possibility to engage in collusive activities to evade taxes (Martínez et al., 2009: 82-83). There are also more recent developments that look into the influence of government performance and behavior on firms’ decision to evade (Bayer and Kupzowa, 2006). Another important area is the study of big corporations and the dissociation of decision making between owners, shareholders and managers. It is usually modeled as a principal-agent problem (Martínez et al., 2009: 83).
Empirical studies of firm compliance behavior are also meager. In addition to the object of study this has been also caused by the absence of accurate data. That is
and Weber (1989), Apel (1994), Mirus and Smith (1997) or Shuetze (2002). (Martínez et al., 2009: 84)
According to Cowell (2004) the bulk of this work only displays obvious results or is methodologically weak. Mostly descriptive statistics and simple correlations have been employed; only recently more advanced techniques have been estimated –Tobit and Probit, ANOVA, structural equations models (Martínez et al., 2009: 85).
Nevertheless, some results are worth mentioning. Rice (1992), Giles (2000), among others find that a firm’s probability of evading depends on characteristics such
as size, economic activity, knowledge of tax regulations, efficiency, etc. (Martínez et al., 2009: 58); firms’ compliance has a positive relationship with being publicly traded and belonging to a highly regulated industry; firms with lower profits relative to the median evade more (Cowell, 2004: 246).
When investigating non-economic features of firms’ compliance, a negative correlation is found with attitudes in favor of tax evasion and against taxation. Interestingly, this attitudinal component seems to be partly related to competitiveness issues, since firms are reluctant to pay taxes when they face difficulties for survival and also as a response to the income loss managers perceive. Other explanations of their unwillingness to comply with tax laws are trust in government and institutions and their perceptions on the system’s equity. (Martínez et a., 2009: 86)
In Ecuador, tax evasion studies are even more limited. There is only one available article worth mentioning. Andino and Parra (2007) focus on firms to estimate the value-added and profit tax absolute and relative gaps for year 2004. They do this for different economic activities and at the aggregated level. They employ data from the use and supply tables of the System of National Accounts to calculate firms’ VAT and profit tax potential revenue. Tax Administration data on returns filed by firms is used to find actual tax revenue. Andino and Parra (2007) find a global VAT gap of 30.6% of potential VAT revenue. This estimate is extremely high for heavy industries (80.4%), small medium industries (52.5%), oil extraction and refining (52%), and post and telecommunication firms (46.8%). The global profit tax gap estimated is 61.3% of potential profit tax revenue. The gap is alarming in the construction field (96%),
CHAPTER III
ECUADOR’S INSTITUTIONAL BACKGROUND
Ecuador is an oil-producing country. Currently inhabited by 14 million people, this country has been a case of the resource curse: originally specialized in primary exports (i.e. cacao and bananas), the first oil boom in the 70s consolidated an economic system based on primary exports and petro-dollars. During the 80s the debt crises struck the country and marked the path of its economy for the following decade. The 20th century ended with a severe financial crisis that resulted in the dollarization of the economy and a decaying democracy.
Brief history of the Ecuadorian Tax System during the 20th century
During the first half of the twentieth century, the Ecuadorian tax system was described as inefficient and complex. There were about 250 valid taxes, an extremely complex and entangled battery of regulations and, not surprisingly, high levels of tax evasion. The Tax Administration –Dirección de Rentas– was a department within the Ministry of Finance. It lacked political autonomy and technical capacity; therefore, control and collection mechanisms were deficient. One of the biggest problems was the extreme decentralization of public revenue. It was often the case that the same tax base was
charged with many regional and local taxes.
In the 1950s, together with the banana boom, the need for a transformation of the tax system emerged. A number of measures were taken in the following two decades: standardization of tariffs; creation of a unified income tax; a new Income Tax Act, which introduced a more progressive tax rate structure, classified income by its source, etc. By the late 1960s, tariffs and other external trade taxes were, by far, the main source of central government revenue (about 65%). The income tax, tax stamps, sales and consumption taxes were next in importance. The first steps towards a more transparent, organized and progressive tax system were taken during these years.
product grew at an outstanding rate (an average of 7% each year) as well as imports and private and public final consumption. This excitement also caused a dangerously high growth of total external debt and inflation. As far as taxation goes, there were changes that improved the tax system precision. Unfortunately, resource abundance also redirected tax policy towards the erosion of the tax burden: more deductions from the income tax base were introduced as well as duties exemptions for capital goods, lower tax rates for invested or reinvested profits for companies appealing to the Ley de
Fomento (Promotion Act). On the contrary, it was also during these years –in 1975– that
the Tax Code was issued.
The excitement caused by the oil boom came to an end with the international oil price fall and the debt crisis of the 80s. When the main sources of government revenue – oil exports and foreign credit– were interrupted, issuing currency was the answer, not improving taxation. Rentier mentality was deeply rooted. The tax system did not change much until 1989, when the government decided to take action to cut the fiscal deficit. The reform had two components: administrative transformation and tax structure reform. The administrative transformation was approved in 1988 and it included: simplification of tax filing forms, abolition of all minor taxes, penalties and fees increase, categorization of tax fraud as criminal offense and the implementation of new collection mechanisms. The tax structure reform was approved in 1989 and it aimed at simplifying the tax system by: replacing all other taxes with only three important ones – the income tax, the value-added tax and the special consumption tax–, reducing the number of brackets in the income tax system, removing some deductions and exemptions. All these precepts were gathered in the Ley de Régimen Tributario Interno (Internal Taxation Law). By the end of this decade production and sales tax was the most important one, the revenue collected from this tax was even larger than revenue from external trade taxes. Income tax revenue declined over the same period of time. Thus, indirect taxes gained more ground.
In the early 90s, the consolidation of structural adjustment programs brought good news in the economic front. Product started to grow, inflation was under control again and foreign investors’ confidence was restored. This did not last long, though. The
This situation got worse with the destruction caused by the El Niño Phenomenon in 1997 and the falling oil prices in 1998.
In the tax front, the Dirección General de Rentas was separated from the Ministry of Finance in 1993. The current Ecuadorian Tax Administration Agency –
Servicio de Rentas Internas (SRI)– was created in December, 1997 –in place of the
former Dirección de Rentas– as an independent institution with administrative, financial and operational autonomy. Its creation was motivated by the need to modernize the management of national taxes, increase tax revenue and fight evasion. The SRI began its
activity on August 1998, after a transition period. Since then the SRI has become one of the most respected institutions by Ecuadorians.
The 1998 Ley de Reordenamiento en Materia Económica en el área
Tributario-Financiera (Economic Reorganization of the Tax and Financial Areas Act) replaced the
income tax with the 1% tax on capital movements (impuesto a la circulación de
capitales). However, the income tax was reinstated and the tax on capital movements
was reduced to 0.8% in March 1999. That same year economic and social crisis peaked. Liquidity problems turned to solvency crisis for some of the most important national banks: government interventions, a forced 5-day holiday for banks, frozen deposits across all financial institutions gave away the severity of the crisis.
Tax Laws and Regulations in the 21st century
Tax regulations in Ecuador are given by the Código Tributario (Tax Code) and the Ley
de Régimen Tributario Interno (Internal Taxation Law). Both of these legal bodies have
been subject to important changes since the beginning of the 21st century.
In 2000, the U.S. dollar was adopted as the national currency. This and other economic changes –required by the IMF’s structural adjustment program– were legitimized by the
Ley Fundamental para la Transformación Económica del Ecuador. This law introduced
changes in the 1989 Ley de Régimen Tributario Interno and in the 1998 Ley de
Reordenamiento Económico. In August 2000, two other legal documents were passed:
the Ley para la Promoción de la Inversión y la Participación Ciudadana and its reform
earmarked taxes; (ii) the cancellation of the capital-movements tax; (iii) changes in the allocation of income tax revenue.
During 2001, the Ley de Reforma Tributaria (Tax Reform Act) was passed with the following regulations: (i) a national vehicle tax was introduced; (ii) the increase of the first bracket in the income tax system from US$ 5,000 to US $ 6,200; the reduction of the income tax rate on inheritance and bequests from 10% to 5%; a 10% discount on the income tax rate of reinvested profits for businesses; the option to donate 25% of the income tax liability to universities and other organizations; the derogation of other
consumption taxes, the 1% tax on foreign currency sales, the motorized land transport vehicles tax legislation. Also, the VAT rate was increased from 12% to 14% but it was immediately reversed after it was declared unconstitutional.
The most important tax reform over the period analyzed was the Ley para la
Equidad Tributaria en el Ecuador (Tax Equity Law) which came into effect on
December 29th, 2007. The main changes introduce by this law were:
- The Tax Code was elevated to Organic Law and governs over any other legal rule of the same matter
- The introduction of tougher penalties for tax violations;
- The instauration of a Simplified Tax System (Régimen Impositvo Simplificado - RISE) to fulfill income tax and VAT obligations for individuals with a previous annual income below US $60,000;
- The creation of the 0.5% tax on currency outflows and the rural land tax;
- Changes to the income tax regulations: individuals can deduct personal, spouse and minor or disabled children’s expenditure on housing, education and health; the introduction of three more brackets with 12%, 30% and 35% marginal tax rates; a new progressive income tax schedule for inheritance, bequest and donations; a new procedure to determine the advance payment, among others. - Changes to the VAT regulations: redefinition of some goods and services taxed
with 0% and 12% rates.
- Changes to the special consumption tax regulations: a higher tax rates for cigarettes, soft and alcoholic drinks, and vehicles; perfumes, videogames,
Tax legislation in Ecuador is particularly unstable: only 6 months after it was enacted, the Equity Tax Law was reformed; and again on December, 2009. There are also other legal bodies related to different issues that demand especial tax treatments – exemptions, deduction, discounts, etc. – that are not contemplated in the main tax laws. This shows a lack of long term planning and an undefined tax policy. These characteristics increase indirect costs of compliance and could encourage negative attitudes towards the tax system.
The Ecuadorian Income Tax and Withholding System
As already mentioned, tax regulations in Ecuador have undergone substantial changes in the last few years. They aimed at increasing the tax system’s progressivity. Therefore, a lot of the reforms focused on the personal and corporate income (profit) tax. In this section we will refer to the regulation and procedures in force during 2006 and 2007.
The global income tax is a national tax. It is applied to a single measure of taxable income –the sum of labor and capital income– whether it is paid in money, kind or services. In general, the tax base is defined as the total taxable income (net of exemptions) minus refunds, discounts, costs, expenses and other deductions attributable to that income. In other words, the tax base for companies is the annual profit resulting from their balance sheets. For individuals there is a progressive six-bracket system while for companies there is a unique tax rate equal to 25%. Companies get a reduced tax rate if they reinvest their profits –profit tax rate is only 15% on the amount reinvested–.
The Ecuadorian tax administration registered 85,779 firms required to file a return in 2006 and 95,753 in 2007. Tax filing for income earned during year t had to be done between February and April of year t+1. Ecuadorian tax laws considered two mechanisms for collecting income tax throughout the year: a mandatory1 advance payment and a withholding system2. The advance payment for year t+1 had to be calculated and reported on the income tax return for year t. The 2006 Law read it was to be computed as half the tax liability of year t minus the total amount withheld from the
1
taxpayer during year t. It was collected in July and September, in two equal shares. Since this mechanism was a payment in advance, the amount paid in year t was deductible from the income tax liability yielded in year t and filed in year t+1.
The withholding system is a mechanism by which all companies, employers and individuals with economic activity purchasing goods or services (withholding agents) are required to deduct a fixed percentage of their counterpart’s payment. This deduction takes place only if the payment is taxable income for those who receive it. Withholding agents must file a return of all withholdings from third parties to the tax authority on a
monthly basis. The total amount withheld in year t from a taxpayer is deductible from that taxpayer’s income tax liability in year t. In such a way, withholdings are also a form of payment in advance.
[image:25.595.79.528.468.747.2]According to law, withholding rates are dictated by the tax authority at any time it is considered necessary3. They usually vary according to the good or service being purchased, except for wage income which has a different withholding regime. The following table shows withholding rates, their categories and the periods they were in force for the most important transactions.
Table 1. Withholding rates changes between 2003 and 2008
Category
Withholding rates
In force from 2003/Apr/1 to 2006/Dec/31
In force from 2007/Jan/1 to 2007/Feb/22
In force from 2007/Feb/23 to
2007/Jul/1
In force from 2007/Jul/1 to 2008/Mar/20
Private passenger transport and public and private freight services
1% 1% 1% 1%
Tangible goods purchases (except fuels)
1% 1% 1% 2%
Real estate construction activities,
urbanization, division into lots and the like.
1% 1% 1% 2%
Services performed by individuals where manpower prevails over intellect
1% 1% 1% 2%
Financial gains (interests, discounts, etc.)
5% 5% 5% 2%
3
Leasing of real estate
owned by firms 5% 5% 5% 8%
Leasing of real estate
owned by individuals 8% 5% 5% 8%
Fees, commissions, royalties and other payments of professional or other services where intellect prevails.
8% 5% 5% 8%
Payments constituting exempt income for those who receive them
0% 0% 0% 0%
Public passenger
transport 0% 0% 0% 0%
Real estate and fuel
purchases 0% 0% 0% 0%
Source: Servicio de Rentas Internas, Resoluciones de Conocimiento General (Resolutions for the public knowledge).
Note: there are other categories that have not been included in this table.
To figure out the 2006 and 2007 profit tax base, companies had to carry out the following steps starting from the annual net profit:
Net Profit
- Employees’ share on annual benefit (15% according to law)
- All exempt income
+ All non-deductible expenses
+ All expenses related to exempt income generation
+ 15% of employees’ share on exempt income
= Taxable Profit
Determining the profit tax liability for year t required a few more steps after applying the 25% tax rate to the tax base:
25% of Taxable Profit4
- Advanced payments corresponding to year t - Total income withheld during year t
- Tax credit from previous years
- Other exemptions stipulated by special laws
= Year t tax liability
CHAPTER IV
WITHHOLDINGS AND BUNCHING
This chapter describes the empirical evidence of firms’ tax burden bunching around the withholding rate in 2006 and 2007. We present graphics and estimate a simple OLS model to find the relationship between changes in withholding rates and firms’ reported profit tax burden.
Data and Descriptive Statistics
Data for this study were taken from the Ecuadorian Tax administration profit tax returns (Form 101) for years 2006 and 2007. Only final tax returns were used5. Information belonged to companies resident in Ecuador, marked as “active” taxpayers in both years. We constructed a squared panel with 27,978 cases for each year, after eliminating duplicates, cases with at least one-year missing (and zero) information in key variables –total income, total assets, tax generated in year t– and other inconsistencies.
To simplify our study, we decided to keep only firms in four economic activities –construction, manufacturing, trade and transport–. The main reason was that these are industries whose income is most likely to come from a traceable source –real estate building, sale of tangible goods and transport services, respectively–; therefore most of their income is withheld at a specific rate. After this depuration, we were left with 12,406 cases per year. Withholding rates varied across years and also across industries
(within the second year). Since changes in withholding rates were exogenously determined, we are able to use a quasi-experimental design.
Table B1 in Appendix B shows the changes in withholding rates for the four industries –construction, manufacturing, trade and transport–. We can see that 1% of the payment for sales of all four industries had to be withheld throughout 2006 and up to June, 2007. From July 1st 2007, the tax authority increased the profit tax withholding rate for tangible goods purchases and real estate construction categories; thus all companies in construction, manufacturing and trade were withheld 2% of their sales. The withholding rate for transport services remained unchanged at 1%.
The top part of Table B2 in Appendix B describes all the variables included in this model. It also presents some descriptive statistics. Ecuadorian firms had a mean annual income of $2.9 million in 2006. Mean annual income increased to $3.3 million in 2007. Average profit tax liability also increased between the two years, it went from $28.2 million to $35.1 million. This reveals a rather low profit tax-burden on Ecuadorian firms as measured by the profit tax / income ratio: its mean was scarcely 0.9% in 2006 and 1.1% in 2007. Assets averaged $1.7 million and $1.9 million in 2006 and 2007, respectively.
We created three dummy variables –Bunch (A), (B) and (C)– to identify companies with a tax burden close to 1% –the withholding rate in force during 2006–. Each variable considers a different width around the 0.01 point. Table B2 shows that 2.5% of all cases (304 firms) had a profit tax burden in the [0.99%, 1.01%] interval, 4.3% (528 cases) had a profit tax-burden between 0.98% and 1.02%, and 3.7% of all cases (454 firms) had a profit tax burden in the [0.97%, 1.03%] interval.
Table B2 also depicts additional information about the sample selected. About 21.6% of cases are manufacturing firms, 8.9% are construction companies, 56.3% are in wholesale and retail trade and 12.9% are transportation companies. Also, 42.4% are firms located in the Ecuadorian Coastal Region; 51.3% are dedicated to foreign trade activities (imports, exports or both). Finally, there are 17.7 Large Taxpayer Units (LTUs), a class of taxpayers determined by the tax authority according to their share of total tax revenue collected in a year. LTUs are withholding agents, their sales are withheld only when transacting with other LTUs and they have more responsibilities and tighter controls from the tax authority.
Graphical evidence
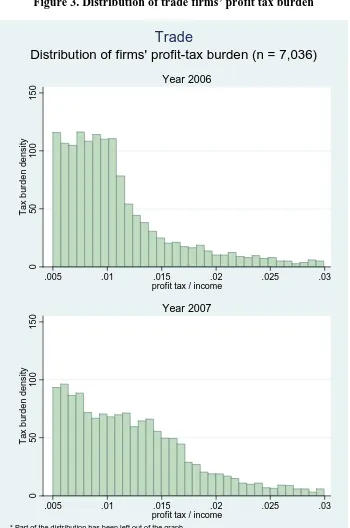
Figure 1 to 4 in Appendix A exhibit density histograms for firms’ tax burden in 2006 (top) and in 2007 (bottom). Figure 1 shows the distribution of construction firms’ profit tax burden. There is a noticeable clustering of firms in the 0.01 profit tax / income ratio bin in 2006. The density takes its maximum value at this point. The same occurs with
firms, while there seems to be no evidence of bunching around one single point, there is a sudden drop in density after the 0.01 bin.
These findings could have two interpretations. Spikes around the 0.01 point in 2006 could simply reflect the true distribution of firms’ profit tax burden. This would mean that the tax administration knew this from empirical evidence and set, afterwards, the right withholding rate (1%) for the four categories –the one that would guarantee that most taxpayers comply and pay the correct amount. On the other hand, bunching around the 0.01 tax/income ratio could also reflect suspicious behavior from firms.
Before taking this discussion any further we should analyze the rest of the evidence. The bottom parts of the four Figures in Appendix A show density histograms of firms’ profit tax burden for year 2007. There are two things worth noting. First, in three of the four industries –construction, manufacturing and trade– the clusters of firms around the 0.01 tax/income ratio disappear. Densities increase between the 1% and 2% profit tax burden. This is in line with the withholding rate increase to 2% that took place in 2007 for the three categories. However, there is no bunching around the 0.02 tax/income ratio because the change occurred in the middle of the year and affected only the second half of the year sales. The second thing worth noting is that the spike is still present for transport companies in 2007. This matches with the fact that there was no change in the withholding rate for this category; it remained at 1%.
These observations seem to support the firms’ suspicious behavior hypothesis. The fact that densities change when withholding rates increased and remained when withholding rates did not move shows that companies are manipulating the information they report to the tax administration when filing their profit tax returns. The reason may be that firms try to avoid paying more than what they have already paid throughout the year –because of income withheld at source–. Therefore, firms manipulate certain variables –conceal part of their sales or overstate their costs– to minimize their profit tax liability.
The empirical model
In addition to graphical evidence, we use a simple Ordinary Least Squares (OLS) model to prove the first part of our hypothesis –changes in profit tax withholding rates affect the tax / income ratio reported by firms and such changes are larger when firms bunch around the withholding rate–. The mathematical formulation is
(1)
Where is the year change in firm i’s profit tax burden ( ); is
the year change in profit tax withholding rates ( )6; is a dummy variable that equals 1 if firm i’s 2006 tax burden is in the vicinity of the withholding
rate in force during that year, as defined earlier; is the interaction between the first two independent variables; is a vector of firm size variables (change
in the logarithm of assets and in the logarithm of assets squared), and u is the error term.
measures the average effect of the change in withholding rates on the change
in tax burden between 2006 and 2007. measures how the year change in tax burden differs between firms that bunched around the 2006 profit tax withholding rate and firms that did not. However, these are only partial (direct) effects.
The variable of our interest is the interaction term on the right hand side of equation (1). This interaction term implies there are direct and indirect effects of dWR
on tax burden changes. The direct effect is given and it reflects the fact that changes in withholding rates affect all firms’ tax burden because it decreases the amount they
receive from each sale, reducing their income. The indirect effect is given by and it can be interpreted as the average variation of the change in profit tax burden caused by withholding rate changes when firms belong to the bunch. This reflects the fact that bunching suggests an irregular behavior from firms. Namely, on average, companies with a profit tax burden near the exogenously determined withholding rate in 2006 reacted to withholding rate changes in a different way than firms with a larger or lower tax burden.
6
The use of an OLS model with panel data is based on the assumption that all individual effects are eliminated by the specification. Therefore, we find unbiased estimates. We study firms’ and CEOs’ characteristics and bunching in Chapter 5.
Results
Results are presented in Table B3 on Appendix B. Columns (1) and (2) display estimates for Bunch (A); columns (3) and (4), for Bunch (B), and columns (5) and (6)
do the same for Bunch (C). Also, columns (2), (4) and (6) include the year change in the logarithm of assets and the year change on the squared logarithm of assets as independent variables (these are used as proxies for firm size).
In all six specifications the relevant variables have the expected sign. The estimated coefficient of the dummy variable for bunching is constant for both specifications within each group –with and without assets–. For the first group, firms with a 2006 tax burden between [0.99%, 1.01%] –firms in Bunch (A)– reported a profit tax burden 0.4% smaller than that of firms outside this bunch. For the second and third groups, firms with a 2006 tax burden between [0.98%, 1.02%] and between [0.97%, 1.03%] –Bunch (B) and Bunch (C), respectively–, the coefficient shows 0.2% lower reported profit tax burden when compared with firms outside these bunches. However, the estimate was not statistically significant for firms in Bunch (B). On average, the logarithm of assets coefficient reveals that a 1% increase in assets was related with a consistent 0.6% growth in reported tax burden.
The change in withholding rates had a positive and statistically significant effect on firm’s tax burden, on average. In all bunches, the effect increased when controlling for firm size with assets. Controlling for Bunch (A), the average effect of a unit change in withholding rates went from an 18.1% to a 20.2% increase in the tax burden (columns (1) and (2)). Controlling for Bunch (B), the average effect of a unit change in withholding rates went from a 17.9% tax burden increase to a 20% increase (columns (3) and (4)). Controlling for Bunch (C), the average effect of a unit change in withholding rates went from a 17.5% tax burden increase to a 19.6% increase (columns
Finally, the interaction term coefficients are all statistically significant. In column (1) we can see that firms in Bunch (A) showed an increase in their profit tax burden 0.466 larger than that of all other firms when withholding rates went up from 0.01 to 0.02. The coefficient was 0.471 when controlling for firm size (column (2)). In column (2), firms in Bunch (B) showed an increase in their profit tax burden 0.330 larger than that of the rest of the firms after a similar change in withholding rates. In this case, the coefficient was 0.347 when controlling for firm size (column (4)). In column (5), firms in Bunch (C) had an increase in their profit tax burden 0.339 larger than that
of the other firms after withholding rates were raised.
CHAPTER V
BUNCHING AND FRAUD
As already mentioned, bunching evidence near the withholding rate in force during 2006 could simply reflect the actual distribution of firms’ profit tax burden in that year. However, the variation of bunching across the two years after withholding rates changed could have a different interpretation. Withholding part of a firm’s income at source restricts liquidity affecting the business. This is specially so when withholding rates change without previous announcement and companies cannot incorporate this in their annual planning. It could be even more important for small and medium businesses (SMBs). Under these conditions some taxpayers may be tempted to alter its conduct in order to lessen this negative effect.
On the other hand, since withholdings are regular installments of the profit tax paid on a monthly basis, taxpayers may attempt to alter their tax returns so they end up paying, at most, the amount withheld. This would be the case for companies with an annual profit tax greater than the tax paid in advance (tax/income ratio greater than the 1% withholding rate). These firms have an incentive to misreport their balance sheet information –whether underreporting their income or exaggerating their costs and expenses– to minimize their profit tax liability. Companies with a lower tax/income ratio do not have that incentive since they already have an asset they would not necessarily want to increase because it does not represent an immediate gain.
If taxpayers had a tax-evasive behavior like the one just described, a variation in
withholding rates would induce a change in their tax burden, which is what we found in the preceding chapter. In the remaining of this chapter we look for some evidence of fraudulent behavior from firms that bunched around the 1% withholding rate in 2006.
Data
from the Ecuadorian Customs Agency. Unfortunately, this information was not available for 2006 so we use 2007 data instead. After combining both data sets we were left with 11,228 observations. About 9.5% of the original sample was lost.
The empirical model
We use an OLS model again. Since information was available only for 2007 we are left with a simple cross-section data set for the following model:
(2)
Where is the difference between the logarithm of third-party reported sales and exports and the logarithm of self-reported sales and exports ;
the dependent variable in equation (2) can also be interpreted and the logarithm of ⁄ –the “misreporting ratio”–. is the same dummy variable as
before, and is a vector of firm i’s characteristics such as: economic activity – manufacturing, construction, wholesale and retail trade and transport7–, firm size measured with the logarithm of assets and the logarithm of assets squared, a dummy variable that equals 1 if firm’s economic activity includes foreign trade, a dummy variable for geographical location and another one indicating if the firm is a Large Taxpayer Unit (LTU). is the error term.
Because of the definition of the dependant variable in equation (2), only a positive gap –a ⁄ 1– indicates tax-evasive behavior (third-party reports are larger than self reported sales); this means that firms are underreporting their sales (and exports) in their returns. Well-behaved firms should have a zero –a
⁄ 1– or negative – ⁄ 1– gap. The negative gap is
explained by the lack of complete information from other sources –not all customers or clients are withholding agents and therefore they are not bound to file the Annex–. So, not all of firms’ sales are reported by third parties through the withholding system.
Our focus is coefficient , which measures whether firms in the three alternative bunches behave more dishonestly than firms outside the bunches. Namely,
7
measures the percentage change in the 2007 / ratio when firms have a tax-burden near the withholding rate in 2006. The larger this coefficient is, the greater the difference between firms that bunched and firms that did not.
Results
Table B4 in Appendix B displays the results. Columns (1) and (2) present the results for 2 specifications of equation (1) with Bunch (A); columns (3) and (4) do the same for Bunch (B), and columns (5) and (6) for Bunch (C). The second specifications –columns (2), (4) and (6)– add more controls.
Our target estimate ( ) is positive and statistically significant at the 1% level across all specifications. The first column shows that, controlling for economic activity, firms in Bunch (A) exhibited, in 2007, a misreporting ratio 38% larger than that of firms outside Bunch (A). The coefficient changes to 35.5% when controlling for firm size, foreign trade activities, LTU classification and geographical location (column (2)). The third column shows that, controlling for economic activity, firms in Bunch (B) exhibited, in 2007, a misreporting ratio 32.5% larger than that of the rest of the firms. The coefficient decreases to 30.2% when adding more controls (column (4)). The last two columns in Table B4 show that, controlling for economic activity, firms in Bunch (C) exhibited, in 2007, a misreporting ratio 35.1% (36.3%) larger than that of firms outside Bunch (C) with controls (without additional controls).
Most controls are also statistically significant. Firms in the wholesale and retail trade business showed a misreporting ratio between 59.5% and 70% smaller than firms in the transport sector. On the contrary, construction firms showed a larger misreporting ratio than firms in the transport sector, between 22.4% and 25.1% larger.
Firm size variables are also important. Since both coefficients – _ and
_ – are statistically significant we find, with everything else constant, the asset
elasticity of the misreporting ratio – ⁄ – is a linear function of
the logarithm of assets with a positive slope (given by _ ) and a negative
reached when assets equaled US$ 292.8 thousand dollars; in specification (4), the critical point was reached at US$ 290.7 thousand dollars of assets, and in specification (6), at US$ 290.4 dollars of assets. These three values are smaller than the sample mean of assets in 2007 –about 15% of the mean value–. This finding suggests that for micro and small businesses a 1% increase in assets decreased the misreporting ratio –firms complied more–. However, once firms grew a little more this behavior deteriorated –a 1% increase in assets also increased the misreporting ratio.
In 2007, exporters and importers had a larger misreporting ratio on average,
between 37.2% and 37.0% larger than domestic market companies. This demonstrates that this type of firms is more prone to inappropriate and illegal behavior. On the other hand, firms selected as LTUs have a better behavior: the coefficient is negative and statistically significant indicating LTUs, on average, have a smaller difference between their self-reported sales and those reported by third-parties. The misreporting ratio is between 16.4% and 16.2% lower when compared to all other firms (non LTUs). This could be due to the fact that LTUs, having more responsibilities, are under a stricter control from the tax authority. The geographic dummy coefficient shows that firms located in the Coastal Region are less compliant; this coefficient is only significant (at the 10% level) for specification (2).
CHAPTER VI
A PROFILE OF THE TAX EVADING FIRM
If firms which bunch around their withholding rates are more likely to manipulate their balance sheets for tax-evasion purposes, it is important to find the determinants that a firm bunches. Using this information, the tax authority may be able to construct a profile of firms that should be subjected to tighter controls. In this chapter we construct a probability model for firms bunching around their withholding rates.
Data
In addition to firms’ characteristics, introduced in Chapter 3 and Chapter 4, we use data from the Ecuadorian tax administration’s identification data base8. This resource contains further information about firms and their managers (CEOs). CEOs, being the highest ranked executives, could influence their employees to engage in fraudulent actions –such as manipulating tax returns– in order to evade taxes and maximize their business’s profits. That is why we add CEO variables to the determinants that a firm bunches.
Descriptive statistics and a brief description of the additional variables we use in this model are presented in the bottom part of Table B2 (Appendix B). All characteristics are presented for year 2006 only. Over 80% of CEOs were men; average age was 45.6 years. Over half of CEOs (51.9%) had some college education (not
necessarily college degree); 77.5% were married and 38.8% of CEOs were born in the Coastal Region.
The empirical model
The determinants that a firm bunches are estimated as a function of the firm’s and the general manager’s characteristics. The mathematical formulation is:
(3)
Where is the dummy variable that equals 1 when firm i’s tax burden is around the profit tax withholding rate in 2006; in this case we use the [0.98%, 1.02%] interval – Bunch (2). On the right-hand side of equation (3) is a vector of firm i characteristics
–the same described in sub-section 4.2–; is a vector of firm i’s CEO characteristics –
sex, age, education, marital status and place of origin (geographic region)–. is the error term. We use only 2006 data to ensure consistency with the definition of the dependant variable.
Results
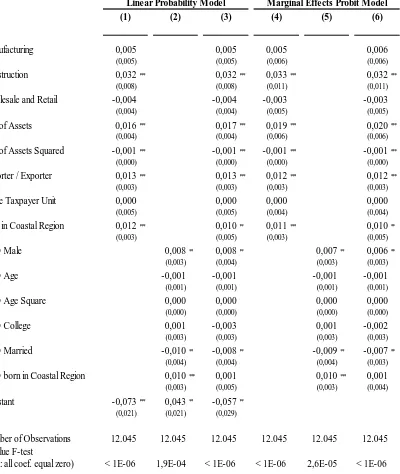
With cross-section data for year 2006 we estimate a linear probability model and a Probit model. Table B5 in Appendix B presents the results. Specifications (1), (2) and (3) show the outcome for the linear probability model with firm controls only (column 1), CEO controls only (column 2) and both (column3). Specifications (4), (5) and (6) show the marginal effects of the Probit model with firm controls only (column 4), CEO controls only (column 5) and both (column 6).
Construction companies had a greater probability than transport companies of bunching around their withholding rate. The coefficient is positive and statistically significant in all specifications for both models: according to the linear model,
construction companies had a 0.032 increase in bunching probability, on average, when controlling for firm characteristics and when adding all controls; in the Probit model, the coefficient is 0.033 for the first set of controls and 0.032 when all controls are used. Manufacturing firms and trading companies have positive coefficients but they are not statistically significant. This result is in line with the findings in Andino and López (2007). They estimated a profit tax evasion of 96% of potential tax liability for the construction industry, the biggest tax-evader at the national level in 2004.
probability model with firm characteristics controls (with firm and CEO characteristics controls). The critical point was US$ 94 thousand dollars (US$ 107 thousand dollars) in the Probit model with firm characteristics controls (with firm and CEO characteristics controls). These findings show that small businesses were more likely to bunch around the withholding rate than larger companies. This could be explained by two factors: (i) small firms have a strong financial incentive to minimize their tax liability because they have relatively small revenues and the profit tax withholding system inflicts a relative larger penalty on their business. (ii) After firms acquire a reasonable size, the financial
incentive decreases; in addition to that, big companies are often designated as LTUs which restricts even more the possibility of incorrect action.
Once more, the importer/exporter variable is statistically significant and positively related to the dependent variable. The likelihood of importer and exporter firms bunching around the withholding rate, in 2006, was 0.013 larger than the rest of firms for both specifications of the linear model, in columns (1) and (3), and 0.012 larger for both specifications of the Probit model, in columns (4) and (6). Firms located in the Coastal Region also exhibited a larger probability of bunching in 0.012 (0.010), in the first (last) specification of the linear model, and in 0.011 (0.010), in the first (last) specification of the Probit model. Being a Large Taxpayer Unit had no significant impact on bunching likelihood.
Analyzing CEO’s characteristics we find that age, age squared and college attendance are not determinants of firms’ bunching likelihood in any of the specifications. CEO’s dummy variable for males is statistically significant and positive. In the linear probability model without any firm characteristic controls (column (2)) and with all control variables included (column (3)), coefficients reveal that companies with male CEOs were more likely than companies run by women to bunch around the withholding rate by 0.008. In the Probit model, this likelihood increases by 0.007 without firm controls (column 5) and by 0.006 with all controls (column 6) when comparing firms run by men with firms run by women. This could be a consequence of the fact that women are thought to be more risk-averse than men; another explanation could be that men have lower tax morale than women.
married at the time were less likely to bunch than firms run by singles, divorced or widowers. The coefficient is -0.010 when firm characteristics are not included in the linear regression (column (2)) and -0.008 when they are (column (3)). The coefficients are -0.009 and -0.007, respectively, for the Probit model (columns (5) and (6)). CEO’s region of origin is only significant when firm variables are not considered in the estimation. Column (2) and column (5) show that companies with CEOs born near the coastline were more likely to bunch around their withholding rates by 0.010.
In conclusion, construction firms and firms engaged in exporting/importing
CHAPTER VII CONCLUSIONS
Using 2006 and 2007 data from the Ecuadorian tax administration, this investigation attempts to find evidence on Ecuadorian firms’ compliance behavior. Namely, we analyze how firms’ tax burden (measured as profit tax / income) is affected by an exogenous variation of tax policy –the change in withholding rates–. We also analyze whether this effect can be interpreted as fraudulent behavior and its determinants. To match legal withholding rate categories we only study firms in four economic activities –construction, manufacturing, trade and transport–.
Our hypothesis is that changes in profit tax withholding rates, being exogenously and discretionally determined by the tax authority, affect the income (and profit) reported by firms in their annual tax returns. They do because firms adjust their tax liability in order to avoid paying more than what has already been withheld from them during the year. This behavior could be more notorious for big companies –with larger profits– since they are assumed to have a larger incentive to underreport their incomes (or over-report their costs and expenses) and decrease their relatively higher tax obligations.
Graphical evidence shows that the distribution of firms’ tax burden clusters around the 0.01 point in 2006 which is equal to the withholding rate in force during that year (1%). This is observed in all four industries. In 2007, the distribution changes: for construction, manufacturing and trade firms, the spike in the 0.01 bin disappears. The
densities increase between the 0.01 and 0.02 profit tax burden on the same year withholding rates increased to 2% for mentioned industries. Bunching is observed for transport firms, whose withholding rate remained unchanged at 1%.
Chapter 5 presents evidence on firms’ misreporting behavior. The model estimated shows that firms with a tax-burden near the 1% withholding rate in 2006 had a larger difference between self-reported and third-party reported sales and exports. Misreporting ratio was between 30.2% and 38% larger for these firms. Results also show that this difference increases with firm size. This proofs the second part of the hypothesis –changes in firms’ tax burden due to changes in withholding rates are not coincidental: firms manipulate their reported information to reduce their profit tax liability–. In this case, bunching suggests tax-evasive behavior from firms.
Finally, we study some determinants of this irregular behavior estimating a linear probability and a Probit model in Chapter 5. We include firm and CEO’s characteristics as independent variables. Results demonstrate that construction firms and firms engaged in exporting/importing activities, with assets below the mean, located in the Coastal Region and whose CEO is an unmarried man, have a higher probability of bunching around the profit tax withholding rate. Since bunching is closely related to fraudulent behavior, tax authorities should pay close attention to this type of firms and design better (customized) control mechanisms.
The previous investigation contributes to the not-so-prolific empirical literature on firms’ compliance behavior. It does so in many important ways. First, the quasi-experiment we exploit, where withholding rates of only some industries were modified, provides us with a stronger identification strategy to analyze the impact of thresholds on tax reporting. Second, we are able to compute an objective measure of misreporting (difference between self-reported and third-party-reported income) and use it to test if bunching around the threshold is associated with misreporting. Hence, we are able to link bunching around a threshold with tax evasion. Third, the Ecuadorian Tax Authority has given us the unusual opportunity to access data with detailed information about firms’ characteristics as well as demographic details of their general managers. This allows us to create a profile of the firms who bunch as well as a profile of their managers.
On the other hand, there are some shortcomings. We rely on the traditional theory of tax evasion. Other than some socio-demographic variables in the bunching