Hochschule Magdeburg-Stendal
Fachbereich Ingenieurwissenschaften und Industriedesign (IWID) Insitut für Elektrotechnik
___________________________________________________________________
BACHELORARBEIT
“Bridging Engineering and Manufacturing”
Vorgelegt von: Diego de la Fuente Lozano
Geb.am: 12.06.1991
Matrikel-Nr: 20151018
zur Erlangung des akademischen Grades
“Bachelor of Engineering (B.Eng.)”
Erstprüfer: Prof. Hans-Ulrich Bake
Hochschule Magdeburg-Stendal
Zweitprüfer: Dipl.-Ing. (FH) Sebastian Möser, M.Sc.
“The design
is a language
and
the main thing is
how
you use that
language.”
Bachelor Thesis by
Diego de la Fuente Lozano
Theme: “Bridging Engineering and Manufacturing”
Thesis definition:
Many companies would like to expedite the delivery of engineering to clients. This can be done by optimizing the exchange of data between engineering and manufacturing units. The current language for this is drawings. They are also the still the best form of communication between design engineers and other engineers. They are always clear and always readable, exchangeable and printable. This practice usually forces design engineers to transpose all of their designs from 3D to 2D. The converse is true in manufacturing companies. They, in turn, have to “reconstruct” or at the least “visualize” the design engineers’ idea from 2D into 3D. Moreover, since drawings may contain errors or be inexact, the responsible individuals in manufacturing may need more time for consultations and clarifications, thus delaying a project.
Bachelor Thesis by
Diego de la Fuente Lozano
Design engineers and manufacturers lose a great deal of time and invest a great deal of labour and money breaking down and reconstructing 3D models. Human error, which is never entirely avoidable, also has to be factored into this chain.
Tasks:
• Research and identify the most frequent problems between engineering and manufacturing.
• Identify normal procedures and solutions to problems in engineering and manufacturing routines.
• Search the Internet and other sources for state-of-the-art. What tools and software packages exist and which ones could provide support or help?
• Devise a concept for data exchange between engineering and manufacturing units and/or identify software tools that would be suitable for this.
We wish Mr Diego de la Fuente when editing the bachelor thesis the best successes
--- ---
I
Declaration of originality
Here I stated:
This Bachelor thesis is the result of my personal work, not copied; I do not use ideas, formulas, comprehensive quotes and various illustrations, drawn from any book, article, memory, etc., (in print or electronic version) without mentioning clearly and strict source, both the body text and in the bibliography.
I am also fully aware that failure to comply these extremes is the subject of university sanctions and / or other order.
Magdeburg, 01.08.2015
II
Index:
Declaration of originality ... I
Index ... II List of figures ... IV List of abbreviations ... VI1 Introduction ... 1
1.1 Manufacturing steps……….1
1.2 Types of engineering information……….……….…… 5
1.3 Engineering documentation standards………..… 6
1.4 Engineering documentation initiatives………..…. 7
2 Research and identify the most frequent problems between engineering and manufacturing ... 8
2.1 2D Drawings Problems……… 8
2.2 3D Model Problems……….………..……….. 12
3 Identify normal procedures and solutions to problems in engineering and manufacturing routines……….. 14
3.1 Combination of 2D drawings and 3D model………..….. 14
3.2 3D CAD model with the 2D annotations………. 15
3.3 Dividing the design ……….……….…… 16
3.4 3D CAD model with other formats assigned………. 17
3.5 Better solution……….. 18
4 Tools and software packets solutions………... 20
4.1 MBE as a Professional Solution………20
4.2 What is Visualization?... 26
4.3 Format files for data exchange……….……….…… 31
4.3.1 The Exchange Process using STEP ………..……34
4.3.2 The Exchange and Visualization Processes using JT ……….…. 36
III
4.4 Different CAD software packets……… 43
4.4.1 NX™ Siemens PLM software……….. 43
4.4.2 CATIA™ 3D Master software ………..………….…. 48
4.4.3 SOLIDWORKS MBD ………..… 51
4.4.4 3D Viewers applications ……… 63
4.5 MBD advantages and disadvantages……….…… 66
IV
List of figures
Figure 1: Visualization MBD example: ... 26
Figure 2: An MBE-Ready 3DPDF Document Example ... 28
Figure 3: Visualization in the design progress ... 30
Figure 4: Down-stream use cases ... 31
Figure 5: Application data Exchange ... 32
Figure 6: Sending data to a machine ... 33
Figure 7: Data exchange using STEP ... 35
Figure 8: Using JT for exchange and visualization ... 37
Figure 9: Using 3DPDF for exchange, visualization and publish... 40
Figure 10: Detailed publishing process using 3DPDF ... 41
Figure 11: Downstream chain ... 44
Figure 12: Siemens PLM NX™view ... 46
Figure 13: Siemens 3DPDF ... 47
Figure 14: CATIA 3D Master ... 49
V
Figure 16: DimXpert step ... 57
Figure 17: Bottom view ... 58
Figure 18: Bottom-Holes view ... 59
Figure 19: Front view ... 59
Figure 20: Front-Section view ... 60
Figure 21: Top view ... 60
Figure 22: 3DPDF view example ... 61
Figure 23: 3DPDF view example ... 62
VI
List of abbreviations
2D 2-Dimensional
3D 3-Dimensional
3D PDF 3-Dimensional Portable Document Format
ASME American Society of Mechanical Engineers
BOM Bill Of Materials
CAD Computer Aided Design
CMM Coordinate-measuring machine
CNC Computerized Numerical Control
DMU Digital Mock-Up
EAI Engineering Animation Incorporated
ECM Enterprise Content Management
ECMA European Computer Manufacturers Association
ERP Enterprise Resource Planning
GD&T Geometric Dimensioning and Tolerancing
ISO International Organization for Standardization
IT Information Technology
JEITA Japanese Electronics and Information Technology Industries
Association
VII
MBE Model-Based Enterprise
NC Numerically Controlled
OEM Original Equipment Manufacturer
PCP Product Creation Process
PLM Product Lifecycle Management
PMI Product and Manufacturing Information
PRC Product Representation Compact
RFQ Request for Quote
TTF Trade and Technologies France
1
1
Introduction
This chapter is a little introduction to the manufacturing process in order to help to understand it and why the communication between the groups, which take part into the development process, is important. Dividing the manufacturing process in many steps, will facilitate the view of which interdisciplinary group is in charge of each task and which tools or documentation are used to share the information from the first step until the last one. There many important aspects about the documentation used between the manufacturing group and the designers like the standards or the kind of information they must share. Once all about the manufacturing process and how the information is transmitted, to the downstream chain, have been explained, finding the most frequent problems between engineering and manufacturing is the next step. This introduction contains a summary of the different steps during the development process and how is treated all the information of the product.
1.1
Manufacturing steps
Many interdisciplinary groups participate during the development of a new product. These groups have to cooperate together in order to find the right way to design and manufacture the product. During the manufacturing and design process, some problems appear between the different areas of engineering. Dividing the process in many steps will help to identify the problems between these areas and solve them.
2 Step 1 Product concept: The first step consists on presenting basic sketches about the idea of the product. Now is time to ask about the product, what is it and how is it going to be used?
Step 2 Research: It is important to research the current markets and demands. The organization should know what is already on the market and what is similar to the product idea? If there is already a similar product in the market, the organization must find the way to make the product better.
Step 3 Product design development: Using the information found in the previous step, the organization will start developing the product designs. During the design of the product, it is needed to answer some questions:
– What is the function of the product? – Will the product be able to withstand use? – Will the product be reliable?
– Can the product be produced at a cost effective price?
– Will the manufacturing process be easy to produce the final product? Does it contain multiple parts?
– Will the process be cost effective? Can the organization still make profit after manufacturing the product?
– Does the organization want the product to be of a high quality? – Will be the product reusable?
– Which material will the product be made from? This will depend on the use and the forces the product is expected to withstand.
3 Step 5 CAD: Using 3D modelling software CAD (Computer Aided Design) the organization will get a computerised 3D model of the final product design. This kind of tools helps them to highlight problem areas in the designs where the theoretical stresses and strains on the product will be shown. If there are problems here with the designs, is time to solve these design faults and revisit step 4.
Step 6 CAM: Once the organization has a computerised 3D model without problems, it is able to create a prototype of the design using computer aided engineering systems. A physical representation of the design is great for testing and developing.
Step 7 Prototype testing: With the prototype made, the organization may have to go back to the drawing board during the test of the prototype. In this point the organization must be critical with his product; is the product working properly? If it is not right, the organization will have to return to Step 3 and re-develop the designs.
Step 8 Manufacturing: Once the organization is satisfied with his product prototype, the organization can then manufacture the product. There are many aspects which will condition the manufacturing costs: the complexity of the product, if there are multiple components, selected materials, low or high production. The organization must consider all of these factors in order to ensure that they will get a healthy profit on the end product.
The kind of product that is going to be manufactured conditions the source of the raw materials. Raw materials can be acquired from local sources or imported from other countries. Local raw materials mostly come from the nature such as from the mines, plantations, farms, fisheries etc. Imported raw materials can be acquired mostly from other business companies like crude oil, flour, chemicals, machinery and parts, electronic parts and several others.
4
• First is the “analytical process”. This process involves the breaking down of the raw materials into smaller parts.
• Second is the “synthetic process”, this process involves the assembling of ready-made parts or by using mixed ingredients.
• Third is the “conditioning process”, in this process the raw materials may be change on its form in order for it to be used in another purpose.
Step 9 Assembly: The assembly of the product is really important. A simple product with few combinations will spend up manufacture and reduce the costs. In addition, it will make the assembly of the product easier and quicker, reducing the overall cost more than if it is a complex product.
Step 10 Feedback and testing: In this step what the organization has to do is testing the product with different groups. Again it is important to be critical with the product and listen to the feedback the organization gets back from other people. This is important for any further product development.
Step 11 Product development: If the organization has found, in the testing and feedback areas, something that needs to be improvement, they will need to check the product development.
Step 12 Quality test: The use of workers trained for checking the manufacturing process is in charge to ensure that the production and quality is the same for all products. This will ensure that the products undergo quality control and meet the company's standards.
5 marketing depends on the quality of the products, demand price, advertisements and several other factors.
1.2
Types of engineering information
Different kinds of information are embedded in 3D models. They are often defined and classified separately in the next way:
• PMI (Product and Manufacturing Information): Product and manufacturing information include all non-geometric aspects of a product necessary for manufacturing the product components and assemblies. It should include geometric dimensions and tolerances, 3D annotation and dimensions, surface finish, and material specifications. PMI is added in the 3D model within model-based definition.
The PMI annotation is created on the 3D CAD model, associated to edges and faces, and can be exported into neutral formats such as ISO 10303 STEP and 3D PDF making this information available for all groups involved into the down-stream processes. PMI is used to visualize product definition within the 3D model. In addition, some 3D model formats enable computer-aided manufacturing software to access PMI directly for CNC (Computerized Numerical Control) programming. The PMI also can be used by tolerance analysis and Coordinate-measuring machine (CMM) software applications if the modelling application permits it. PMI items are often organized within annotation views. [3]
6 • 3D Annotations: This kind of documentation allows engineers to add notes to the design that may not be related to the geometric characteristics of the part, assembly or product CAD model. [4]
1.3
Engineering documentation standards
There are many standards published by professional organizations that define how drawings should be documented. Those professional organizations developed and published new standards that defined how PMI should be documented in 3D models.[4]
• ASME Y14.41 3D Digital Product Definition: Released in August 2003, this is the American standard for annotating 3D models.
• ISO 16792 Digital Product Definition Data Practices: Released December 2006, this is the international standard for annotating 3D models.
7
1.4
Engineering documentation initiatives
Into the world of engineering documentation many people mistake paperless and drawingless as the same thing, although they are interrelated, they mean two different things [4]:
• Paperless Initiatives: The meaning of this initiative is that the organization is delivering the engineering documentation electronically instead of on physical, paper copies. Any type of documentation can be sent electronically.
8
2
Research and identify the most frequent problems
between engineering and manufacturing.
This chapter presents some of the most frequent problems between manufacturing and engineering during manufacturing process. It is important to bear in mind that design and manufacturing are different groups and they have to communicate together during the manufacturing process. Designers take care of the product design including all information like materials, surfaces and the way manufacturing group should make the product. Problems appear when designers try to communicate all this information to the manufacturing group. The documents, which designers use to share the information to the manufacturing group, make this communication possible but there also many different ways to make these documents. Each of them has his own problems and advantages. During this chapter the problems of using 2D drawings and 3D model files will be explained. These problems will help to find a solution in posterior chapters.
2.1
2D drawings Problems
Engineering documentation is a big important part during the manufacturing process. The objective is representing an engineering design in the most accurate and concise way possible. Translating the 3D reality we live in onto sheets of paper involved a carefully considered system of dimensioning and orthographic projections. This is known as 2D drawings. The system of representing a design in 2D drawings has always been used and worked as it works now. This is the reason why engineers who are trained in these methodologies difficulty understand why they should change this method.
9 by the communication medium. As we think and understand the universe in 3D, engineers can now define and control the designs in 3D. However the intended value behind PMI is more than just adding a dimension. PMI brings a persistent overlay of metadata that is queried and utilized with the 3D model. This will facilitate during the development process tasks like manufacturing and inspecting.
That is why the classic engineering drawing has many problems or limitations [5], [6]:
Interpretation Issues: The first problem appears when engineers try to translate a 3D design into 2D drawings. A properly executed drawing should not be subject to misinterpretation, but that skill required to do this is becoming difficult to find nowadays. Unclear depictions in 2D drawings could be problematic (i.e. which surface did that leader line touch?). Another limitation is that errors can easily escape detection, although there are tools like GD&T which helps to mitigated them, this is another skill required difficult to find. Here is where PMI has an advantage because it can clearly associate surfaces and endpoints, and provide validation those dimensions making logical sense.
Manual Inspection: There are not tools which can help us to interpret the 2D drawings so humans are in charge of the reinterpretation of the drawings on the other side of the manufacturing lifecycle. Here there is another limitation: the botched inspection. As it has been mentioned before, PMI sets the stage for automated inspection, accelerating manufacturing processes while simultaneously improving quality.
10 problems, in addition, the time wasted here was not spent in new projects. Now is where deadlines for new development work are a problem because of the importance of time in the market. As result, the engineering organization must catch up by putting in extra time.
Instead of requesting additional clarification or documentation, the downstream consumer misinterprets the engineering documentation, causing an error that proceeds further downstream in the product development process. That is what makes really important solving a little error at the beginning of the development process. The possibility for such errors with 2D Drawings is relatively easy to understand. The fact that such deliverables require more specialized training and spatial-visual intelligence increases the chance of misinterpretation. One might question the need to trouble the engineering organization with such issues. The engineering documentation could be perfectly correct. A downstream misinterpretation should be addressed downstream. Considering the potential investments by the company, however, that thinking is flawed. Let us consider some examples. Let us say that a machinist misinterprets a component’s engineering documentation. The machinist produces a large number of the components with this error. Once the machinist recognizes the problem and makes the company aware of it, a choice must be made. If the components cannot function in the greater design, then they must be repurposed or turned into scrap. However, if the components can function in the design, then the engineer must tweak the design to accommodate the modified component. That is where the design emergency arises for the engineer.
11 and development process. As such, minimizing the amount of time spent on engineering documentation is beneficial, as that time can instead be spent on design.
2D Drawings of components require interpretation. Lines that are “dashed” are hidden, or exist behind the solid of the component. In more complex cases, there can be many such hidden lines that overlap. Three orthogonal views of the component provide enough information to definitively determine the entire dimensional and spatial shape of the component. Isometric views offer an additional perspective of the component that helps clarify the component. This leads to additional requests for clarification and forms of documentation. This means that engineers not only have to create so many documents to clarify the design, also we will spend a lot of time trying to interpret it, and all know that time is money when we are talking about industry.
Assessing production errors: Another limitation found is the number of times that the company has to check the documentation if it caused production problems. There will always be errors in the production process.
The lower rate of production errors relates back to the lower incidence of misinterpretations. It is difficult for non-engineers to learn and retain the knowledge and skills required to interpret 2D Drawings. Whether it is because of misinterpreted engineering documentation or because of incorrect engineering documentation, the result is the same: more scrap and waste.
12 design from 2D drawings of a similar one. This is a big problem in companies whose products are relatively similar and only change some standards.
2.2
3D Model Problems
PMI seems to be the best solution to represent all the information needed in 3D, however it is a relative new solution and it presents problems yet. Some of these problems appear with the training of the people who is going to use the PMI solution. Most engineers used to work with 2D drawings so they will have to learn this new solution to represent their design. And this is not only a change for engineers; the supply chain has also to learn the new concept of representing data in order to be able to work properly with it [5], [7].
Not universal accessible: there is no standard format for visualizing the design as we have in 2D drawings with PDF (Portable Document Format). We could use 3D-PDF to represent the model but the not all information is fully carried by 3D-PDF. Another problem related to this is that users only can get the information from the solid part file to the person who actually made the part without having the native software where the part was created in. It supposes that the manufacturing group must work with the same software that designers use, which is a big problem if the organization is working with many different companies which could use different CAM software. Licences of this software are expensive so it will be a problem as a company if you have to buy more than one to be able to work with different companies.
13 was designed. That is why “inspection drawings” are still very much needed so 3D model is not a real solution.
Geometric Dimensioning and Tolerancing (GD&T): ASME Y14.41 which defines digital product definition practices is heavily focused on GD&T. GD&T offers very real benefits not achievable with traditional rectangular tolerancing. GD&T provides a clear and precise methodology to characterize form and fit with how your manufacturing and tooling processes actually work, all while reducing scraps rates. The trouble is that all learning requires spending time and money and you must justify a training program in the company.
14
3
Identify normal procedures and solutions to problems
in engineering and manufacturing routines
Once we have explained the problems which appear using the 2D drawings and 3D CAD models is time to try to solve them. The use of all the information existing on drawings, PMIs and geometry, has to be supported by these solutions and allow a better exchange of information in an environment supporting collaborative engineering. We are going to propose different solutions for each problem we found in 2D drawings and 3D CAD model. First we will try to solve problems in the traditional way in 2D drawings adding some information and then we will do the same with the 3D CAD model. Some solutions also consist in mixing the best part of 2D drawings and 3D CAD models. Also we are going to identify which problems these solutions could have and why some of them could not be viable or have a professional acceptation.
3.1
Combination of 2D drawings and 3D model
15 the 3D CAD model or maybe they could put some of the information in 2D drawings and the rest in the 3D CAD model. In this way, what we try to do is make the information clear for all the groups which take part in the manufacturing process and what we are doing is mixing the information between both solutions. We could try to implement rules which decide what type of information is included in the 2D drawings and what is included in the 3D CAD model trying to solve this misinterpretation but it does not look a good solution for this problem. Mixing information between 3D and 2D would duplicate the information and it means a waste of time, misinterpretation and errors will appear. On the other hand instead of simplify the solution users would have to work with two different formats which is not advisable in the manufacturing process. In addition, if we put all the information in the 2D drawings the 3D CAD model is only useful to understand the design giving us no information more. There is no point in adding another different format in order to understand the design.
As it was explained this solution is not really a solution. All the possibilities users could have mixing 3D and 2D solutions at the same time were presented but any of them is solving the problem engineers had at the beginning.
3.2
3D CAD model with the 2D annotations:
16 in only one or two views, how can all the information be presented? One solution could be defining the minimum views required to represent the design and put the PMI information in this views. For simple designs could work because the number of required views will be little and it will not take too much time to understand the design and add all the information in few views, however most of the designs are really complicated, compound of many parts, doing impossible to represent the design in few views. Therefore, a solution which is not working in all cases is not a solution. At least, for simple designs we would have to check all the PMI information manually, looking all views and wasting tons of time. Another problem could be that the information can be represented in so many ways and one way could be better for one manufacturing group and another one for other manufacturing group, then a standard is needed in order to have only one way to add the PMI information in the views and how these views are taken. Finally, with this rule implemented, users have all the information clearly showed, but the different views of the design are all involved and have something in common which could be represent by notes in order to summarizing the design. If all views are taken previously, how can we make these notes for the common aspects? What we are doing is duplicate information and hinders the compression of the PMI.
Like the previous solution this one has problems to be implemented and does not make clear the information during the manufacturing process.
3.3
Dividing the design
17 design has been divided in many parts, users would have one file for each part of the design. This is not really advisable when we otherwise, have fewer files to make the check easier and faster. As clearer make this solution the PMI more files we will have to check, consequently wasting time and sometimes losing the idea of the global design of the product because we are working only with the small parts in which it is divided. There is no point in this solution for that reason, what we want is send to the manufacturing group the minimum possible number of files, preferably in the same format, and what the manufacturing wants is just take the file and be able to transfer it to the CAM software. Dividing the design in smalls parts make this impossible to implement.
During these three solutions a big problem has been found , users have to compile and work with more than one format.
3.4
3D model with other formats assigned
There is a lot of information of the different interdisciplinary groups of the process in a 3D model file. It looks like a good solution but it is not. The information is only useful when it is clearly presented. Having all the information together in the same file is not the best way to show each individual type of information to each interdisciplinary group. What it proposed here is to extract all the important information of each group in one file. In this way engineers could have a word or excel file related with the bills of materials, a 3D CAD file, in order to understand the design, and another file formats which can help the rest of interdisciplinary groups to understand the relevant information for them, without having to find it between all the information of the design. We could use typical file formats to write the information of each group.
18 file. On one hand the information has been cleared but in the other one we have made more files. The problem of having more than one file is that engineers have to compare all of these individual information files with the 3D Model in order to contrast the information and if it is right. If we had problems comparing 2D drawings with 3D CAD model, now we have more than two file formats so the time spent in comparing files has been multiplied. Another problem relevant to the time spent is that we have to make all of this different format files for each manufacturing group individually. This could assume a lot of time so maybe is better to have all the PMI information mixed in ones file than make more files because take less time to understand the mixed information in the 3D model than make a new file for each type of information.
3.5
Better solution
20
4
Tools and software packets solutions
4.1
MBE as a Professional Solution
The current situation in PCP (Product Creation Process) is marked by development of complex products. The requirements for the construction of new products in terms of quality, costs, time and innovation became extremely important.
Therefore, the ability to perform and to manage cooperative work efficiently as well as the exchange of product model data in all the phases of product life cycle, especially in product development, has become the major key factors. As it was presented before unidentified mistakes in early phases cause high expenses and time delays in late phases. A possible way to solve this problem is collaborative engineering based on digital mock-up (DMU). DMU is a basis for visualization based on complete and current 3D models, and used by product development teams as a communication method. During discussion of product geometry based on DMU, the visualization and the use of PMI in 3D models are fundamental points. PMI in DMU drives key activities like design or manufacturing: PMI in 3D models is not only text describing technical requirements, it has also to integrate non-technical information that has direct or indirect links with time, costs, quality or innovation aims. This chapter presents results and propositions concerning the visualization and the use of PMI in 3D models in collaborative engineering environments.
21 The opportunity to transform the handoff between engineering and manufacturing is highly beneficial during the development process. Nowadays the CAD software can create, view and interrogate documented 3D models. Furthermore, new devices like touch-enabled tablets offer a delivery platform that can survive the shop floor. However, technological advances are not enough to change the way of working, it is also need to make the effort to make a cultural change that must be planned and managed as well. This part explains the basics and advanced aspects of this initiative and which benefits could be expected by the organizations [4], [8].
Now is time to give the organization the first steps to transform his way of work to this new one.
So how does an organization get started with a PMI initiative? There are two important aspects to bear in mind when an organization gets started with the PMI information: enabling engineers to create annotated 3D models and showing others how to view and interrogate annotated 3D models.
Authoring engineering documentation: Modern CAD applications have been improved to offer the ability to specify a wide-range of capabilities that leverage the information already built into the CAD model as PMI requires. Some of these capacities are presented here:
• Showing Feature Dimensions: The first step to achieve PMI is building a feature-based 3D model. Dimensions are in charge of defining and modifying features. CAD applications are able to do it easier, reusing those dimensions as part of the model’s PMI.
22
• Drawing Interface Similarity: With the CAD software, adding PMI to a 3D model is very similar to creating a drawing, making faster and easier this task. The differences between the interfaces in these CAD applications have been minimized, allowing users to use a common interface to document the design.
• Automated Drawing Creation: Now it is known thatadding PMI to a 3D model is similar to create a drawing, how can users leverage this work and put it on a drawing? CAD software enables users to show the PMI information on drawings automatically, reducing the effort and time of the engineers.
• Validation of Compliance to Standards: The automated checking of PMI against various 3D annotated documentation standards is an advantage that allows engineers to do not worry about it because CAD applications assist them by acting as the digital drawing checker.
Viewing and Engineering Documentation: Having the PMI information added to a 3D model is not enough, there is more to do. Next, the software has to make it quick, easy and simple for everyone else, even non-technical users, to view and interrogate that documentation:
• Easy to Use Viewing Applications: 3D models viewers have existed for some time. Viewing applications let users quickly and smoothly switch between views and associated sets of PMI. They are able to interrogate the 3D model and allow the user to view and interrogate all the PMI information in the 2D drawings.
23 read and interrogate 3D and PMI data in a wide variety of formats, providing flexibility to an organization’s PMI efforts.
• Simple Apps on Ruggedized Tablets: Where the technological advances are relevant for PMI is in the possibility to use ruggedized tablets that are portable, easy to use and hardy enough to work in harsh environments. For the first time, digital drawings and annotated 3D models can be viewed and interrogated on the shop floor.
Getting the Most Out of Advanced: Now the tool is explained, is time to learn how to use it in all the different fields into the manufacturing process:
• Engineering documentation: Long ago, when CAD applications were first used, some organizations realized a 3D model could be used for far more than just creating engineering drawings. It could be used for tolerance analyses, verification of different product configurations as well as the generation of numerically controlled (NC) code for inspection and machining sequences. Today, the use of PMI can actually extend those use cases further than the use of a 3D model. PMI information is entered once and reused in the different downstream applications.
• PMI and variational analysis: One engineering activity enhanced with PMI is variational analyses. In this activity, engineer flexes the dimensions of the 3D model to the minimum and maximum values taking tolerances into account to identify issues like clashes, interferences and more. PMI automates this activity because as it is added to a 3D model, tolerances are already defined. When the model needs to be flexed to a maximum or minimum, the user simply uses the tolerances in the PMI instead of adding it.
24 often have to create their own engineering documentation of those models for manufacturing. PMI can be easily added to a 3D model, regardless of source or format, allowing the organization to use the 3D model or a quickly-created drawing as the deliverable.
• PMI and Products variants: Another advantage of the PMI comes when the organization wants to create engineering documentation for product variants and configurations. Users can create a single model and then define variants by excluding, including or switching parts and sub-assemblies. This master model approach allows a single model to represent many products.
Creating engineering documentation, however, is not always an easy task. Some notes must be included for some configurations, but not for others. Some dimensions and tolerances apply to certain variants and not for others. CAD applications allow users to define such logical conditions, which are applied in an automated and intelligent fashion, whether that is for PMI on 3D models or on 2D drawings.
25
The business impact of PMI: This chapter has covered a number of technical issues related to PMI. And while its use seems advantageous, the organization has to ask itself if the effort they did to learn how to use this tool provide benefits to the organization and the business:
• Cost reduction through less paper: Many organizations are pursuing a paper reduction initiative. While it is beneficial to the environment, it is also beneficial to the organization. Using less paper translates to spending less money on paper.
• Increased engineering productivity: With the use of PMI, some redundant tasks, like entering tolerance information on a drawing and generating inspection NC code, can be eliminated. The time saved translates into more time spent on designing and engineering products. In addition, entering the same information for multiple applications can be error prone. Reusing information entered correctly once can eliminate such costly problems.
In all, PMI can be leveraged for a wide variety of purposes throughout a manufacturer with hard benefits.
26
4.2
What is Visualization?
As it is commonly used in the manufacturing industry, visualization is used to perform any number of activities, like digital pre-assembly, human factors analysis, or being able to interrogate a design feature of one sort or another [9].
Visualization was defined above, but it is better to explain it with a picture and an example. Consider the part shown in Figure 1 below. This is a single part, with a number of machined features. The part is fully detailed, with the entire product manufacturing information data, such as datums, tolerances, and manufacturing support data, attached.
27 In this visualization application, users are able to navigate both visually by identifying features of interest, and using the product structure. The view is presented in 3D, and can be zoomed, panned, or rotated providing the user with the correct orientation. This is how a typical visualization application works.
However this is not useful without two conditions: the user has access to a licensed copy of the visualization application, and the user has the necessary training and skill to use the application to gain the information required to perform the task at hand.
Unfortunately, visualization applications typically are proprietary software which much be purchased, maintained, and users trained prior to deployment. All of this implies a cost, often significant, that limits the ability of the visualization application to deliver on the MBE benefits for many, but not all, during the downstream chain. In the cases where it is not the solution, one additional item is missing: the presentation of other information beyond just the Model Based Definition (MBD) data itself, to support the information required for the person in that job role to efficiently complete their task. This last point will help to define how visualization differs from communication.
Communication: Leveraging Visualization: The primary differentiators between a visualization-based use case, and a communication-based use case, are the following:
• Different data types such as 3D, 2D, text, PMI, metadata, audio, video, product structure, animations, etc. are required to completely inform the user of everything needed to execute the task described by that use case.
28 • Visual data is related to, and can be referenced to, the other data types present when delivered.
• The data as delivered can be archived or persistent to meet the regulatory or compliance needs of either or both the author and the consumer.
To illustrate this concept, let’s take the part with the PMI information from the previous section, and present it in a form that exemplifies communication:
Figure 2: An MBE-Ready 3DPDF Document Example
29 to provide the visualization data, the author of this PDF file has also included meta-data from an external business system, shown as a table on the right hand side of the PDF file. The main view window contains a fully interactive 3D model of the part above, but the representation is much clearer and easier to understand. In addition, the author of the MBD data (not the PDF rendition) created in the original MBE data “detail views” showing specific areas of interest. The various detail views are represented as “thumbnails” which can be viewed in a banner fashion in sets of five using the provided navigation buttons. If a detail view is selected, the main viewing window is replaced with that view, which is also fully interactive. For example, if the engineer only wants to see the datums, he simply selects the appropriate thumbnail.
While this example is simple, the range of communication solutions that can be deployed is extensive, and can be very complex. In a following section, it will be described, in more detail, why 3DPF is a powerful tool in this ability to address the communication needs of manufacturers, but first, let’s talk briefly about why both visualization and communication are needed.
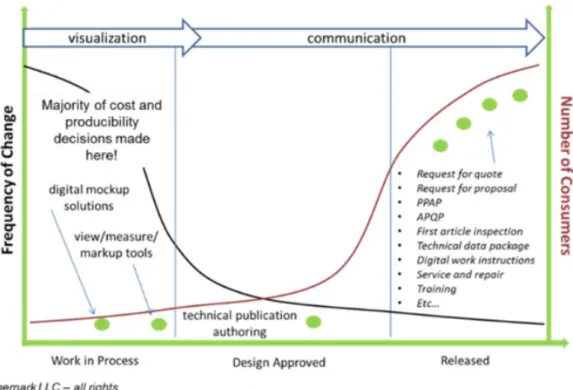
The value of communication and visualization
30 makes visualization tools not only necessary, but very well worth their cost of ownership in acquisition, implementation, training, and support. It is also true that visualization applications represent specialized needs and satisfy the requirements of few users.
Figure 3: Visualization in the design progress
31 he knows who is the person that will perform the task, and has control over their hardware and software configuration. On the contrary, the chances of knowing who is going to receive the work done, when the receptor is not in the same organization as the author of the data, are reduced and there is no visibility to what software assets might be available to consume the work product.
Figure 4: Down-stream use cases
4.3
Format files for data exchange
32 organizational strategies. The purpose of this part is to highlight why these formats are similar, how they are different, and what role should be considered in data architecture within an organization or set of relationships between organizations such as an OEM (Original Equipment Manufacturer) and its suppliers [10] .
Next international standards formats will be considered:
• STEP
• JT
Application Data Exchange
Looking at the generalized use model is a good way to explain the role that these various formats occupy. For example, the use of formats like STEP and JT, during the development process, has been in order to make easy the exchange of data between applications and interdisciplinary groups.
33 Figure 5 illustrates this concept. During the development of the product or object to be manufactured, the designer strives to create a model-based definition of the product. If the design owner has an advanced IT (Information Technology) strategy, they may be employing model-based enterprise practices to combine MBD data with other relevant data such as that found in a PLM (Product Lifecycle Management), ECM (Enterprise Content Management), or ERP (Enterprise Resource Planning) system. Other organizations, such as design partners, consume that data to facilitate their role in the manufacturing process. Frequently this consumption of data starts in an application. This case is explained in Figure 6.
Figure 6: Sending data to a machine
34
4.3.1
The Exchange Process using STEP
STEP is an international standard (ISO 10303) that has a multitude of parts organized into groups (description methods, implementation methods, application protocols, application modules, and many more). In total, STEP consists of several hundred parts and is the largest standard in the ISO community. The purpose of STEP is defined as a standard for the computer-interpretable representation and exchanges of product manufacturing information, in other words, it was born for make the application data exchange easy.
Unique in this industry, STEP is an international standard, containing no proprietary intellectual property. STEP was developed as a true community effort, which originated in the aerospace industry, as a means to exchange information between airframe manufacturers and their primary suppliers, such as turbine engine manufacturers, where dissimilar MBD applications are the norm. It has expanded to other industries, and beyond geometry to include other domains as well. Its verbosity and granularity make it ideally suitable for long-term archiving purposes. STEP can represent an enormous variety of data:
• Geometric information
• Product manufacturing information
• Product lifecycle support information
• NC manufacturing information
• Electrical systems information
The importance of STEP is his level of granularity in the kind of information it can represent which is not matched by other format in existence, proprietary, open or otherwise. This makes STEP ideal for archiving purposes, given the level of information captured, and the absence of any dependence on a particular application.
35
Figure 7: Data exchange using STEP
Some key points:
• The derivative data, without a consuming, conforming application, has no value.
• The data being exchanged can be simple geometry (via AP203), moderately complex MBD data (AP203, AP214, AP242), or considerably more complex (AP203, AP214, AP242, and AP239).
• This is only the exchange of data which is represented by the respective STEP parts, and may or may not represent the actual use of that data downstream.
• Although it is possible to use STEP data for the purposes of visualization, due to its verbosity it is not as well suited for such uses as is JT.
• To ensure that the derivative precisely matches the data authority, the employment of validation tools and processes needs to be considered.
36
4.3.2
The Exchange and Visualization Processes using JT
JT was originally developed by Engineering Animation, Inc. and Hewlett Packard as the DirectModel toolkit (initially Jupiter Toolkit). When EAI was purchased by UGS, JT became a part of UGS Corp.’s suite of products. Early in 2007 UGS announced the publication of the JT data format easing the adoption of JT as a master 3D format. Also in 2007, UGS was acquired by Siemens AG and became Siemens PLM Software.
JT is the common interoperability format in use across all of Siemens PLM Software product suites. JT is also used as both a data exchange format between design partners and manufacturers, as well as for visualization applications such as digital preassembly (also called DMU) and generalized visualization known as view/measure/mark-up (VMM). Siemens has supported the development of JT as an ISO standard; approval occurred in December 2012. When compared to STEP, JT is far less verbose, and focuses primarily on the geometric representation of the product or object to be built, as well as attribute information associated to the product, including product manufacturing information. JT also contains definitions of both exact geometry via non-uniform rational b-splines as well as faceted or tessellated data of varying levels of accuracy and compression. Unlike JT, STEP does not consider “lightweight” representations of a product or object, nor does it concern itself with compression. Therefore JT has advantages when being considered for downstream use.
37 certain uses cases such as digital mock-up, visualization, and limited forms of data exchange. It also has the ability to exchange. The graphic in Figure 8 shows this.
Figure 8: Using JT for exchange and visualization
38
4.3.3
The Exchange, Visualization and Publishing Processes using 3DPDF
The general use of 3DPDF has a completely different purpose than either STEP or JT. PDF is an international standard file format used to represent documents in a manner independent of application software, hardware, and operating systems. While Adobe made the PDF specification available free of charge in 1993, PDF remained a proprietary format, controlled by Adobe, until it was officially released as an open standard on July 1, 2008, and published by the International Organization for Standardization as ISO 32000-1. In 2008, Adobe published a Public Patent License to ISO 32000-1 granting royalty-free rights for all patents owned by Adobe that are necessary to make, use, sell and distribute PDF compliant implementations.
PDF is a standard which defines how renditions of data are to be made, such that they are universally consumable via Acrobat Reader, and can use all of the features of the standard which are unique amongst the various formats we are talking about, such as digital signatures, templates, forms, and rights management. PDF, in and of itself, does not define any 3D data format for representing manufactured products. Next part will explain this.
Background on U3D and PRC
39 In 2006 Adobe acquired Trade and Technologies France (TTF), the developers of a digital mock-up application called 3DReviewer. As part of the acquisition, Adobe obtained two other significant pieces of technology and intellectual property. These constituted a set of libraries which allowed a large number of data formats, including the major MBD applications such as Catia, NX, and ProEngineer, to be imported into a format called Product Representation Compact (PRC) 2. PRC provides support for both exact geometry and tessellated data, product structure, and product manufacturing information.
PRC is in the final stages of becoming an international standard in its own right, expected to be completed in the first part of 2013. Both U3D and PRC are specified by the ISO32000 standard, and are fully supported by the Acrobat platform.
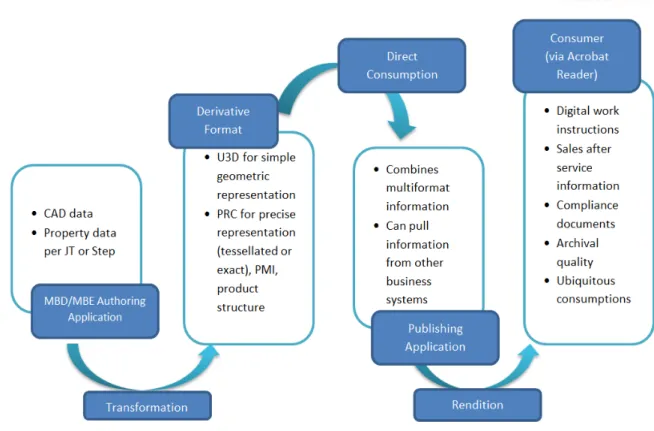
By now it should be clear that what sets 3DPDF apart from other formats is its unique ability to create rich renditions of all kinds of data, including in addition to what is represented in the way of 3D information, such data types as 2D drawings, audio, video, animations and images –all encapsulated in a ubiquitously consumable form that includes forms, templates, digital rights management and signatures. A very key point in addition to the ubiquity factor is the presence in virtually any organization of the infrastructure necessary to properly support the generation, delivery, consumption, and management of PDF documents. After all, it is used in every functional area of the company beyond engineering and manufacturing ,finance, human resources, purchasing, marketing and sales, to name a few. Figure 9 describes that publishing process.
40 In such cases, PRC can be used without any involvement or employment of PDF – as its own international standard; it can stand on its own, and from a functional perspective, is positioned very similarly to JT.
Figure 9: Using 3DPDF for exchange, visualization and publish
The option exists however to use PDF as a “transport container” to get PRC data through an exchange process or to a specialized visualization app, thereby leveraging the relevant infrastructure. This is yet another one of the very compelling benefits of adding support for 3DPDF to an organizations infrastructure stack.
41
Figure 10: Detailed publishing process using 3DPDF
As was mentioned previously, one of the distinct advantages of using PDF for publishing rich renditions of product data those are specific to certain use cases. Examples of such use cases are:
• Shop floor work instructions
• Inspection instructions and documentation
• Assembly instructions
• Maintenance and service
• Interactive catalogs
• Training documentation
• Request for Quote
42 There are advantages to adopting 3DPDF that are not present when using JT or STEP:
• Publishing is an established process in most, if not all organizations; adding 3D support leverages those processes and associated investment.
• The ubiquity of Acrobat Reader on almost any device delivers the potential of consumption without barriers; proprietary clients and controls for Office applications have significant issues with enterprise support and security.
• Renditions tailored to specific use cases, along with ubiquity, assures maximum ROI through common use by combing 3D data with virtually any other form of data needed to fulfil the purpose of the rendition.
43
4.4
Different CAD software packets
Once the professional solution with the PMI in the 3D model and the format possibilities to export it has been explained, is time to make a summary of the different CAD software packet which can provide it and how is the PMI embedded.
4.4.1
NX™ Siemens PLM software
Since PMI complies with industry standards for 3D product definition, product teams now have the ability to use 3D models as a sanctioned and legitimate method for fully documenting product and manufacturing information. Siemens NX™ PMI solution facilitates a comprehensive 3D annotation environment that allows product teams to capture and associate the component’s manufacturing requirements directly to the 3D model, as well as facilitate this information to downstream manufacturing applications. By associating PMI with a part, the environment facilitates information re-use throughout the product lifecycle [11], [12]. Figure 11 represents the downstream chain.
Siemens NX PMI solution has the next set of features:
• Comprehensive set of 3D annotation tools for capturing dimension, tolerance and product definition and manufacturing information.
• The same highly productive user interface as all other NX modules, including drafting which requires no significant learning curve to begin using the application.
• Fully re-usable in NX Drafting; viewable in JT data format-enabled viewers and integrated with Siemens validation tools.
44
Figure 11: Downstream chain
Siemens NX™ provides a comprehensive 3D annotation environment that not only captures and associates manufacturing requirements to the 3D model, but also allows the digital data to be re-used by downstream applications because the data lives with the product’s parts.
By using the NX™ PMI solution to embed 2D information directly within the 3D model, product teams have no need to create multiple, redundant data sets to define a given part. Instead, PMI allows product teams to capture and share engineering requirements within the 3D model, eliminating the need for 2D drawings and ensuring that the final product complies with its engineering specifications. Improved productivity through 3D product definition when created in a 3D CAD model and directly associated with objects in the part, NX™ PMI solution provides benefits during the development process.
45 • Directly from a CAD/CAM system
• In a standalone 3D product visualization tool
• In the portal viewer of a product data management (PDM) system NX™ PMI not only reduces the need to generate 2D drawings; it also enables downstream applications to directly access this information for automating tasks such as CNC programming, tolerance stack up analysis and CMM analysis using other Siemens PLM products as well as third party applications. NX™ PMI also enables “PMI Driven Machining”, which automatically selects the correct machining process and tools. As a result, product teams have enterprise-wide access to the right data at the right time with the right amount of detail and with reduced errors and greater speed because there is no need to re-enter data from a drawing. By understanding and communicating the values of 3D PMI throughout an enterprise, from engineering departments to the manufacturing floor and out to the supplier base, manufacturers are able to realize productivity, quality and efficiency gains throughout their upstream and downstream processes.
PMI can contain GD&T, weld symbols, text and dimensions, as well as the product definition and process notes. In addition, NX™ PMI gives you the ability to automatically check your GD&T for standards compliance. Figure 12 is an example of NX environment.
46
Figure 12: Siemens PLM NX™view
Teamcenter Manufacturing 3D PDF for NX™
The Teamcenter manufacturing 3D PDF documentation solution delivers rich, interactive 3D work instructions in a PDF format using preconfigured templates. The process of authoring and publishing these documents is tightly integrated with the enterprise CAD and the Teamcenter PLM platform to ensure that these documents are always up to date and any effects of change are immediately reflected downstream. Using this solution, manufacturers can now easily generate and distribute rich and interactive 3D PDF work instruction documents including PMI, mark-ups and other manufacturing information directly to the shop floor. Greater clarity for complex assembly instructions through rich and interactive 3D documents [13], [14].
47 are fully animated, describing the sequence of assembly steps generated directly from the manufacturing process plan in Teamcenter. Shop floors users can view these rich, interactive 3D work instructions with the free Adobe Reader, giving them full access to essential 3D tools such as pan, zoom, rotate and more. Figure 13 is an example of 3DPDF Siemens.
Figure 13: Siemens 3DPDF
Features:
• Reduce expensive shop floor errors by delivering accurate and highly visual work instructions.
48
• Quickly communicate impact of change to the shop floor and reduce waste and quality issues.
• Leverage an intuitive, familiar interface for authoring, publishing and viewing of 3D documents in the PDF format.
4.4.2
CATIA™ 3D Master software
CATIA - 3D Master is a new-generation CATIA product addressing the easy definition and management of tolerance specifications and annotations of 3D parts and products.
With CATIA – 3D Master solution 3D annotations can be extracted, using the annotation plane concept in CATIA GENERATIVE DRAFTING products. Besides syntactic and semantic verification command allows the user to check the correctness of all the annotations of the active product or part regarding to the standard used. The 3D annotations can be reviewed using ENOVIA which offers comprehensive tools for interpretation of annotations and tolerances on specific areas of the design or across the complete digital mock-up [8],[15], [16].
Key values of the 3D Master
49 user through the process of putting geometrical tolerances on the part while preventing the creation of an invalid tolerance. The tolerancing meaning is captured in the dataset to be directly reused by downstream applications such as tolerance analysis, manufacturing or inspection and to check the dimensioning and tolerancing validity throughout the design stage.
The 3D Master can be shared with people across the value chain by providing free or inexpensive lightweight viewing applications. The normal file format which is normally used for CATIA 3D Master is JT, with all the features explained in previous chapters. Virtual teams and communities can meet in a real-time environment to search, navigate, chat and collaborate on any aspect of a product related program. Figure 14 is an example of CATIA 3D Master environment.
50 Consolidating the solid model of the part geometry, tolerance and annotations and parts list into a single dataset offers major advantages. Working with a 3D model, the engineer can be absolutely certain that he or she is applying the tolerance to the desired feature and anyone using this information can be sure they are producing or measuring the correct feature. The 3D Master approach also provides considerable savings in re-use of product definition information in product families or future versions of the product. Product Lifecycle Management systems greatly enhance the ability to re-use geometric information. The 3D Master approach makes it just as easy to re-use the complete product definition, including tolerance and annotations and parts lists.
Incorporating the tolerances in a 3D Master model makes it much easier to use tolerance analysis tools that predict the assembly variations based on the tolerancing specified for individual parts while taking both deformation and the assembly process into account. Simulating the build variation determines if the product and process, as designed, meets the dimensional product requirements and determines the impact of individual tolerances on the assembly variation. This type of simulation often makes it possible to loosen tolerances, resulting in manufacturing cost reductions of up to 90%.
Some benefits which an organization can achieve using CATIA – 3D Master are the next:
• Define 100% of the product definition using a single 3D dataset.
• Reduce the cost and improve the quality of the product development process.
• Substantially increase the amount of design information that can be re-used in future variants.
51
4.4.3
Solidworks MBD
SOLIDWORKS MBD (Model Based Definition) is an integrated drawingless manufacturing solution for SOLIDWORKS 3D design software. With it is possible for companies to define, organize, and publish 3D Product Manufacturing Information, including 3D model data, in industry standard file formats such as 3D PDF and eDrawings.
SOLIDWORKS MBD allows add data such as product models, dimensions, geometric tolerances, surface finishes, welding symbols, bill of materials, callouts, tables, notes, meta properties, and other annotations within the SOLIDWORKS 3D environment in 3D PMI. Traditional 2D drawings are no more needed because of all the information is integrated with the 3D models. The intuitive and interactive 3D PMI provided by SOLIDWORKS MBD serves multiple operational use cases, such as part and assembly engineering drawings, Request for Quote (RFQ), and Inspection Reports. It also helps multiple departments and stakeholders across the operation, such as design, procurement, fabrication, assembly, quality, sales, marketing, clients, and suppliers [17], [18], [19].
Solidworks MBD features:
• Define PMI directly in 3D: SOLIDWORKS MBD defines PMI directly in 3D, avoiding the expense and time associated with developing 2D drawings. This helps speed up communication, cut supplier quoting time, and reduce errors.
• Present 3D data in a clean and structured fashion: Beyond 3D PMI definition, SOLIDWORKS MBD helps organize the rich data into clean and structured 3D presentations with different views and display settings.
52
existing processes. 3D PDF can be viewed using a variety of free tools including Adobe™ Reader. In addition to providing associative information such as engineering notes, Bill Of Materials (BOM), and rich Meta properties, you can also explore the model in 3D with Pan, Zoom, Rotate, Measure, Section, and other 3D tools.
• Comply with industry standards: SOLIDWORKS MBD helps companies comply with predominant industry standards, such as MIL-STD-31000A, ASME Y14.41, ISO 16792, DIN ISO 16792, and GB/T 24734.
53
Working with SOLIDWORKS MBD
Introduced the basic features of SOLIDWORKS MBD solution, an example could help to understand the tool in deep. This section presents how it is possible to add the PMI directly into the 3D model with SOLIDWORKS MBD solution. The part was previously designed in SOLIDWORKS CAD software in a SLDPRT extension, assigned to a part file, and a SLDDRW with the 2D drawing documents of the part [20], [21].
Let´s open the part file and take a view of the design. Figure 15 shows some views and the frontal section defining completely the part.
Figure 15: Bottom, Top and Frontal section views
57
With the information included into the 2D drawings and the 3D model the part is completely defined, symmetry axis, holes position, measurements and all information related to the geometry of the part. However, the PMI information needed for inspection and manufacturing is not there. In the 2D drawings there is no information about the speed and tools that a NC system could need to make the part with the necessary speed and quality. For this reason SOLIDWORKS MBD allows to add the PMI directly into the 3D model.
Opened the 3D model, is time to start the MBD solution of SOLIDWORKS and add the Product Management Information. In order to do this SOLIDWORKS MBD has an automatic tool called “DimXpert”, which allow the users to select the datums where the measurements will be referenced. In this case is enough selecting two datums because of the part symmetry. These datums are the flat bottom surface and the circular surface perpendicular to the first one. Selected the datums, the users have to select which operations of the part must be referenced to these datums. In this part concretely, all operations were selected in order to obtain completely the PMI of the design. In this step, SOLIDWORKS shows the 3D model with all the PMI annotation directly in the 3D model. Figure 16 is the result of this step:
58 Figure 16 shows much information into the 3D model, heights, holes instructions, measurements, final surfaces details, etc. Unfortunately, the way all this information is presented is not orderly and clear so it is useless to the user.
Next step consists in place each information added to the 3d model into different views in order to clarify all the PMI included in the last step. For this, SOLIDWORKS MBD has many standard views like top, bottom, front, back etc. Users are able to add a custom view in order to add a different point of view or just divide one in two views or just clarify the information. Each view presents all information related to that plane. Users also can decide which information will appear in each plane or views. With these tools is easy and fast to put all the information where it is needed and make a clear representation of all the PMI in the different views.
Related to the different views are needed to represent this part, five views were created. Bottom view was divided in two views called “Bottom” where the information about the principal
measurements of the circumferences is added and “Bottom-Holes” where is all the information related to the holes such as hole´s specifications and hole centre position. Figure 17 and Figure 18 shows these views: