Predicting the Phase Diagram of Two-Dimensional Colloidal Systems with Long-Range
Interactions
†Sergio J. Mejı´a-Rosales,‡Alejandro Gil-Villegas,§Boris I. Ivlev,|,⊥and Jaime Ruiz-Garcı´a*,|
Facultad de Ciencias Fı´sico-Matema´ticas, UniVersidad Auto´noma de NueVo Leo´n, Ciudad UniVersitaria, San Nicola´s de los Garza, NL 66450, Mexico, Instituto de Fı´sica, UniVersidad de Guanajuato, Leo´n, Guanajuato 37150, Mexico, Instituto de Fı´sica “Manuel SandoVal Vallarta”, UniVersidad Auto´noma de San Luis Potosı´, San Luis Potosı´, SLP 78000, Mexico, and Department of Physics, Astronomy and Nanocenter, UniVersity of South Carolina, Columbia, South Carolina 29208
ReceiVed: October 28, 2005; In Final Form: March 20, 2006
The phase diagram of a two-dimensional model system for colloidal particles at the air-water interface was determined using Monte Carlo computer simulations in the isothermic-isobaric ensemble. The micrometer-range binary colloidal interaction has been modeled by hard disklike particles interacting via a secondary minimum followed by a weaker longer-range repulsive maximum, both of the order of kBT. The repulsive part of the potential drives the clustering of particles at low densities and low temperatures. Pinned voids are formed at higher densities and intermediate values of the surface pressure. The analysis of isotherms, translational and orientational correlation functions as well as structure factor gives clear evidence of the presence of a melting first-order transition. However, the melting process can be also followed by a metastable route through a hexatic phase at low surface pressures and low temperatures, before crystalization occurs at higher surface pressure.
1. Introduction
Charge-stabilized colloidal particles systems have received considerable attention in the past decade due to a wide range of interesting structural behavior observed in these systems. For example, in a bulk colloidal suspension the mutual electrostatic repulsion among particles stabilizes the suspension against van der Waals attractive interactions,1 due to the formation of a potential barrier that prevents the aggregation of the particles. These suspensions are ideal systems for studying crystallization and the melting transition, since structural changes are easily accessible experimentally using light scattering and optical techniques.2
On the other hand, forces between colloidal particles are manipulated by controlling the properties of the aqueous solution. If salt ions are added to the suspension, the repulsive force between charged colloidal particles is screened and van der Waals attractive forces dominate. In this case, the colloidal particles fall in the so-called primary minimum, forming colloidal aggregates where the particles are in contact. The aggregation process is an area of intense research and is being understood throughout cluster-cluster aggregation models. However, for a clean bulk system, if the thermal energy is not sufficient to allow the particles to overcome the electrostatic potential barrier, a colloidal suspension can be made stable against particle aggregation. This behavior has been well
understood through the Derjaguin-Landau-Verwey-Overbeek (DLVO) theory.3
This is not the case for clean quasi-two-dimensional colloidal systems, however. Recent experimental evidence shows that charge-stabilized colloidal microspheres have attractive interac-tions with particle diameters in the micrometer range. This unexpected attraction has been observed in systems of latex spheres trapped between glass plates4 or at fluid-fluid interfaces.5-8
For colloidal systems trapped between glass plates, the particles repel each other electrostatically through a Yukawa-type potential. If the separation of the walls is small enough to restrict the movement of the particles to a plane, a secondary minimum in the micrometer range of the pair interaction potential is formed. The formation of this minimum indicates that an unknown attractive interaction in the micrometer range must be present. However, since glass plates become charged when they are in contact with water, any theoretical attempt for a full description of the experimental observations should take into account the electrostatic effects that the plates certainly exert on the particles.
On the other hand, the formation of two-dimensional (2D) colloidal mesostructures at the air-water interface, such as a colloidal foam, clusters, and labyrinth-like structures, has been taken as evidence of attractive interactions between particles.5-7,9,10 The formation of these patterns cannot be explained solely on the basis of repulsive interactions. We have recently measured the pair interaction potential at low particle surface density,11 and indeed the potential shows a secondary minimum in the micrometer range, similar to those found in colloidal systems trapped between glass plates. In addition, a shallow longer-range secondary maximum is observed for the lowest particle con-†Part of the special issue “Charles M. Knobler Festschrift”.
* To whom correspondence may be addressed. E-mail: jaime@ dec1.ifisica.uaslp.mx.
‡Universidad Auto´noma de Nuevo Leo´n. §Universidad de Guanajuato.
|Universidad Auto´noma de San Luis Potosı´.
⊥University of South Carolina.
22230 J. Phys. Chem. B 2006, 110, 22230-22236
centration. The formation of a secondary maximum have been theoretically proposed in order to explain the stabilization of colloidal mesostructures.9 Furthermore, measurements of the interaction potential showing a micrometer range attractive interaction have also been measured at the oil-water interface.8 For three-dimensional (3D) colloidal systems, Sciortino et al. have shown that the competitition between a short-range attractive potential and a long-range repulsive Yukawa potential can induce the clustering of particles into quasi-one-dimensional aggregates with interesting branching features obtained by a proper selection of the pair-potential parameters.12
The DLVO theory in combination with van der Waals interactions explains satisfactorily the existence of attractions between like-charged particles by the action of dispersion forces in bulk systems, but the range of the attractions at which the DLVO theory can be applied lies on distances close to contact. In contrast, while the origin of the repulsive interaction for a 2D colloidal system at the air/water or oil-water interface can be regarded as a dipole-dipole type,13the origin of the attractive interaction leading to the ultra-long-range potential well remains unknown. Ruiz-Garcı´a and Ivlev9assumed that the electrostatic interaction must be longer ranged, and this causes the interaction potential to oscillate as a function of the interparticle distance, producing a secondary maximum.9This long-range repulsion plays an important role in the formation of colloidal chains and clusters, even though the interaction is completely isotropic. Experimental evidence showing this oscillation is being re-ported.11
The amount of evidence showing ultra-long-range attractive interactions in quasi-two-dimensional colloidal systems has piled up and is well established, but its origin is puzzling. Further-more, despite differences in details between quasi-two-dimensional colloidal systems, they share a common feature: interactions lead to a potential well formation of the order of kBT, and perhaps a universal behavior for two-dimensional colloidal systems could be behind these observations.
The existence of this unexpected secondary attractive well in the pair potential of confined colloidal systems has received theoretical attention as well. Different models have been proposed in order to get a satisfactory explanation on the nature of the attraction between like-charged particles in quasi-two-dimensional systems, among which are the theory of attraction due to a redistribution of counterion clouds surrounding the spheres,15hydrodynamic mechanical effect,16the possibility of a van der Waals-type micrometer-long-range interactions,17and theories based on capillary interactions.8,18 Despite these at-tempts, a full theoretical understanding of this phenomenon has not been achieved to date, and further work on both theory and experiments is needed to reach a better understanding of the driving mechanisms for this interaction.
In a previous work,10 we presented a Monte Carlo (MC) computer simulation study for a model potential with the basic features of the interaction proposed by Ruiz-Garcı´a and Ivlev.9 The potential used in this study was a discrete model given by a hard-disk repulsion, combined with a first square shoulder (SS) representing the first repulsive barrier in real colloidal interactions, a square well (SW) to model the secondary minimum, and another SS to model the secondary maximum. The obtained results show that this model potential is able to reproduce the patterns of colloidal particles at the air/water interface, validating the theory.9 To compare the role played by the secondary maximum, we also presented results for a potential with no secondary maximum at all, showing that a
better qualitative agreement with the reported experimental observations is obtained when the potential has the second SS repulsion.
A potential as described above was conceived by Lebowitz and Penrose18 more than 30 years ago, for molecular fluids. They considered a system of particles interacting through a Kac potential,19 similar to the potential that can describe van der Waals isotherms, i.e., a short-range repulsion and a long-range attraction. However, when a repulsion interaction of a longer range than the attractive potential is present, the repulsion causes the distinct liquid and gas phases of a normal first-order transition to break into droplets or froth whose characteristic size is large relative to the particle diameter but small compared to the range of the repulsion. 2D colloidal droplets and froths have been observed experimentally with micrometer-size col-loidal particles at the air/water interface. Furthermore, Gelbart and collaborators,20 have observed the formation of similar patterns in 2D uncharged gold nanocolloid particles as those found with charge latex particles at the air-water interface, but the equilibrium distance between particles is in the nanometric range instead of micrometers. They have used Kac potentials to successfully show that these type of potentials can reproduce the experimental patterns.
In this work we focus our attention on investigating the effects of this long-range attractive interaction on the formation of different structural phases in a colloidal system. The phase diagram of a model system of hard disk particles with diameter σis obtained via Monte Carlo simulation. The potential contains the basic features of the interactions measured experimentally, i.e., a strong repulsive component of the potential close to contact, followed by an attractive contribution with a depth of the order of kBT that extends to 2.5σ, and a comparatively weak repulsive shoulder of longer range. Our results reproduce the appearance of different structural phases at low values in the density of the system and give strong evidence of a first-order phase transition before the freezing transition at higher densities. However, we have found that this liquid-solid transition can be prempted by a the appearance of a metaestable hexatic phase. An outline of this paper is as follows. In section II we describe details of our model, and details of the computer simulation method are explained in section III. Results are presented in section IV, where the phase diagram obtained is analyzed, as well as different structural quantities. Our conclusions are summarized in section IV.
2. Model
Colloidal particles are modeled as hard disks interacting via the following potential
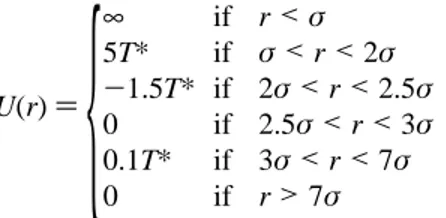
where T*)kBT. In this potential, the square shoulders (SSs) mimic the repulsive barriers in real colloidal interactions at short-and long-range interparticle separations, whereas the secondary minimum is described by a square-well (SW) potential. The range of the attractive potential was chosen from attractive potentials measured for micrometric colloidal latex particles.11 The profile of the interaction potential is shown in Figure 1.
3. MC Computer Simulations
We performed several series of Monte Carlo computer simulations in the isobaric-isothermal ensemble (NPT). Each simulation box contained N)504 monodispersed particles of diameterσ. The accessible area of the N particles is a rectangular box of sides (n1ax3, n2a), where a is the nearest neighbor distance of the particles arranged in a triangular lattice and n1 and n2are two integers chosen such that n1ax3/n2a≈1 and N)2n1n2. The rectangular box dimensions were chosen in such
a way that the particles arranged in a triangular lattice could approximately cover a square area, for a given area densityF. Standard periodic boundary conditions and minimum image convention were implemented.25At low values of the reduced density F* ) Fσ2
swhere F is the number densitysthermal equilibrium is reached after nτ ) 108 simulation cycles.
However, at higher densities, it was necessary to perform 109 cycles in order to get equilibrated states. Isotherms were obtained by compression, starting from a lattice configuration of the system at very low pressure. For the higher pressure states, we also studied the isotherms by expanding the system from a high-ordered state, to reproduce the isotherms obtained by compres-sion. Maximum displacements and volume changes were modified along the runs in order to obtain acceptance ratios between 0.30 and 0.45 for any value of pressure. Five isotherms were chosen, at the reduced temperature values T1* ) 0.5, T2* ) 0.8, T3* ) 1.0, T4* ) 1.2, and T5* ) 1.2. Once equilibrium was reached, we calculated for every value of pressure the pair correlation function g(r), to get a quantitative measure of the distribution of the particles. We also calculated the orientational correlation function and the structure factor, which are respectively given by
whereΘ(r) is the angle of the bond of the particle centered at r with each of their neighbors and gb(r) is the bond orientational function, and
where q is the wavenumber vector and rjis the position vector for particle j.
4. Results
Snapshots for the configurations of the simulated states are presented in Figure 2, for the case of very low densities (τ≈ 30, where τ )(2/x3Fσ2)), and also for densities in a liquid and solid phase structure regimes (τ ) 7.0 and τ ) 5.2, respectively). We can note from this figure the effect of the
Figure 1. Pair interaction potential model for 2D colloidal particles.
For 1<r/σ<2, the height of the potential is 5T*, not shown in the figure.
Figure 2. Snapshots of the system of 504 particles at different densities and temperatures. It can be noted the formation of clusters of particles at
low concentrations and temperatures. As the temperature rises, we find the formation of chainlike structures, in agreement with experimental results. For higher densities (τ)7), the chains close themselves to form arrays of voids that resemble the early stages of a two-dimensional cellular structure. At T*)0.5,τ)7, the weak repulsive shoulder promotes the appearance of voids embedded in the triangular lattice. At higher densities,
τ)5.2, the particles start arranging in a triangular-like lattice with clear defects. U(r))
{
∞ if r<σ
5T* if σ<r<2σ
-1.5T* if 2σ<r<2.5σ
0 if 2.5σ<r<3σ 0.1T* if 3σ<r<7σ 0 if r>7σ
(1)
gor(r))〈exp(i6Θ(r)) exp(i6Θ(0))〉
gb(r) (2)
S(q))1 N
∑
n∑
mlong-range SS part of the potential as a function of temperature. At the highest temperature, particles tend to be free although small chains, a few particles long, are present. As the temper-ature decreases, chains become longer and also some small clusters start to appear. At the lowest temperature, large cluster domains are formed and few particles remain free, resembling a coexistence region between a condensed, ordered phase and a gas phase. This behavior can be attributed to the long-ranged square shoulder in the potential. Due to their thermal energy, when two particles approach each other they can overcome the shallow SS and then fall into the secondary minimum. If more particles pass the SS, the lowest energy particle configuration is that of a chain. Since particles should have enough energy to pass back through the SS to move away from each other, chain formation at the higher temperatures must be a dynamic process; i.e., chains should form, disappear, and re-form at random. This process has been observed experimentally in colloid systems trapped at the air/water interface,11and it can be studied through a molecular dynamics simulation, a study that is beyond the scope of the present paper.
As temperature is lowered at low densities, the thermal energy is still enough for the particles to pass the SS, falling into the secondary minimum, but they cannot pass back through the SS to move away from each other. In consequence, clustering is enhanced. Clusters now act as bigger particles, but the thermal energy is not enough for them to pass the shallow SS of the interaction potential; thus clusters will not coalesce easily and will be long-lived structures. Both chain and cluster behavior have been observed experimentally.11As the density is increased to a value that typically corresponds to a liquid state, i.e.,τ) 7, the available area for the colloidal particles is not enough to allow clustering, but the effect of the long-range SS is still observed by the formation of hollow areas immersed in a triangular-like lattice of particles at the lowest temperature. The coexistence of a particle lattice with regions of lowsor zeros density has also been observed in several experiments with colloidal particles confined in two dimensions. As the temper-ature is increased at this constant density, the triangular particle lattice melts down into a liquidlike structure where chainlike particle formation is still observed at the highest temperature. However, chain direction seems to be random and there is no evidence of an anisotropic phase.
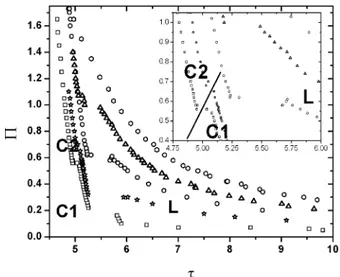
To characterize the ordering and phases observed for this system, we performed a detailed analysis of its behavior as a function of density and temperature. Several isotherms were studied in order to obtain the phase diagram, as shown in Figure 3, where the two-dimensional reduced pressure Π ) (x3/2)Pσ2is plotted against the inverse densityτ)(2/x3Fσ2), beingFthe average density of the system at thermal equilibrium. At low densities,τg10, the isotherms look continuous without slope changes; therefore we restrict our plot to the most interesting high-density regions,τe10. It can be observed that isotherms present two first-order phase transitions, the first one located betweenτ)5.25 and 6, and the second is a smaller discontinuity, aroundτ)4.8 and 5.1. This second transition is presented more clearly in the inset of the figure. The line drawn for the smaller discontinuity is just a guide to the eye.
There are two main points to address here about the results obtained in our study. First, the simulations at high densities and low temperatures require a very large number of MC cycles in order to reach equilibrated states. Near the transtition points the number of cycles required to define the phase transition was on the order of 106. In the case of the isotherms T*)0.5 and T* ) 0.8, metastable states can be present around the most
noticeable phase transition at low surface pressures. At the highest temperature isotherm, T*)1.5, we could not find any phase transition region, which apparently indicates the existence of a critical point. However, this does not seem to be the case, because at this temperature and at high surface pressures, the particles have enough energy to go over the primary maximum, i.e., in the first SS in our potential model, to get into contact and aggregate. Consequently, the density at this thermodynamic conditions is continuously changing, not only because the colloidal monolayer is being compressed but also because particles are aggregating, whipping out the phase transition. The void formation that is observed along the simulations are interesting structures that arise from the competing short- and long-range attractive and repulsive interactions, respectively. These structures are more noticeable at low temperatures. Their character as stable structures, however, requires to use molecular dynamics simulations, to understand their evolution in time. It is interesting to mention here that similar chain and ring structures also have been observed in quasi-two-dimensional systems, such as dipolar hard-spherocylinders forming smectic phases25 and in dipolar hard disks.26 In these systems, the competition mechanism is due to the attractive or repulsive nature of the dipolar interaction, depending on the relative orientation between a pair of dipoles.
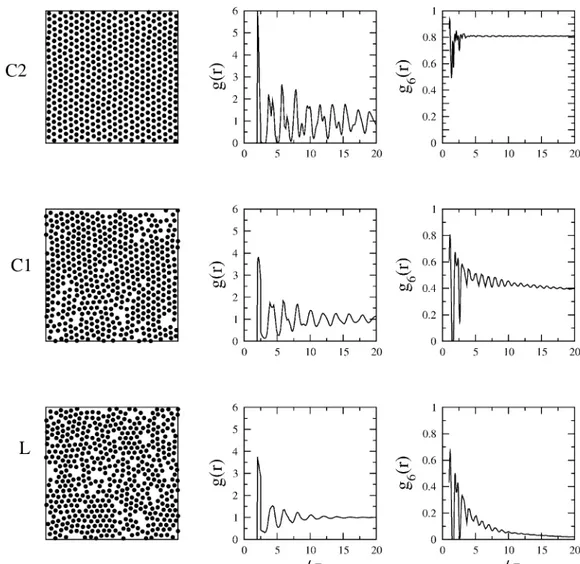
Three different phase regions can be identified at high densities, which we have denoted as L (liquid), C1 (crystal 1), and C2 (crystal 2) in Figure 3. To characterize these phases, we obtained the pair correlation function, g(r), the hexactic bond orientational function, g6(r), and the structure factor, for the different isotherms. For our discussion, we will focus our attention along the isotherm at T*)0.8. This isotherm is chosen because it has the L, C1, and C2 phase regions very well defined. Surface pressures and densities were chosen along this isotherm in such a way that their values lie at each phase region on Figure 3. Figure 4 shows snapshots for a given configuration for each phase region along their corresponding structural functions g(r) and g6(r). The letters on each configuration snapshot correspond to a thermodynamic state labeled with the same letters on the T* )0.8 isotherm of Figure 3. We can observe that for the point corresponding to the L phase, the correlations functions decay quite rapidly, exponentially, with distance, indicating that the translational and the orientational orders are short ranged.
Figure 3. Π-τisotherm curves for a system of 504 particles interacting via the potential shown in Figure 1, at five different temperatures: circles, T1*)0.5; squares, T2*)0.8; diamonds, T3*)1.0; triangles
up, T4*)1.2, hexagons, T5*)1.5. The thermodynamic states labeled
Therefore, the order of the L phase corresponds to that of a two-dimensional liquid.
On the other hand, both correlation functions obtained at points corresponding to phase regions C1 and C2 show more structural features with (quasi)long-range order. The pair correlation function of the C1 phase is much shorter ranged than that of phase C2. There is also a marked difference in the bond-orientational order, gB(r); for the C2 phase it remains constant at a value of 0.8, while it decays to a constant nonzero value, close to 0.4, for the C1 phase.
Further confirmation of the phase behavior is obtained from a detailed study of the structure factor, S(q), obtained for states in each of the phase regions L, C1, and C2. Figure 5 shows the structure factor along the T*)0.8 isotherm, determined at the
same thermodynamic positions as in Figure 3. We are plotting the wave vector components scaled with the diameter of the particles, qyσvs qxσ, in dimensionless units. In addition, the data plotted in these figures are the wave vector q, for which the value of the S(q) is larger than a threshold value. Figure 5a shows the structure factor of phase L. Here there are no sharp Bragg peaks and the isotropic rings confirm the fluid nature of this phase. In contrast, phases C1 and C2 show very well defined Bragg peaks with 6-fold symmetry, as shown in parts b and c of Figure 5, confirming the two-dimensional ordering.
However, a metastable state (H) can also be obtained before observing the L-C1 first-order transition. This H phase was obtained by compressing the liquid phase, whereas the C1 phase was reproduced by expanding the C2 system. The structure
Figure 4. Particle configuration, translational correlation function, g(r), and orientational correlation function, g6(r), for four different states of the
system at T2*)0.8. The labels correspond to those used in Figure 3. See text for discussion.
Figure 5. The structure factor S(q) of the colloidal system along the T2*)0.8 on each phase region, where the labels correspond to those used
factor of the H phase is given in Figure 6. As can be seen, diffuse Bragg peaks and the 6-fold symmetry are not very well defined. Since the positional order is inversely proportional to the half-width at half-maximum, the features shown for this phase indicate that its positional order is short ranged but the orientational order still remains quasi-long-ranged, a feature that characterizes hexatic ordering.
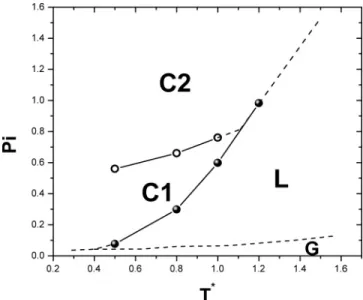
From theΠvsF projection of the phase diagram, we can obtain the Π vs T* projection. This is done by plotting the transition pressures on each isotherm versus its corresponding temperature. Such phase diagram projection is shown in Figure 7. Here, the data points and solid lines are coexistence lines obtained from the isotherms, and the dashed lines are either continuation of the solid lines or where we think a gas-phase region (G) could be. On this phase diagram projection, the L, C1, and C2 region are better defined.
The phase diagrams of Figures 3 and 7 indicate the different phases observed by our simulation study. The colloidal crystal has a crystal-crystal (C2-C1) weakly first order phase transi-tion. Then, as the surface pressure is decreased at constant temperature or the temperature is increased at constant pressure, the C1 phase transforms into a liquid throughout a clear first order phase transition. At higher temperature and surface
pressures, the 2D colloidal crystal melts directly into the liquid phase from the C2 phase. The formation of a triple point between the C1, C2, and L phases is inferred from the simulation data. The C1 phase can be preempted by a hexactic phase if the liquid phase is compressed. However, this H phase is not observed by expanding the system from the C2 phase, an indication of its metastability.
The phase diagram of Figure 7 resembles part of the phase of Langmuir monolayers (LM) of fatty acids, where in the LM the 2D liquid phase (LE phase) coexists with the so-called superliquid (LS) and L2 phases, which turn out to be two-dimensional analogues of hexatic smectic phases.28Even more, LM show more 2D smectic-like phases before showing a true 2D crystalline phase named CS. LM are formed by rodlike molecules and are expected to form various 2D hexatic-like phases between the 2D liquid and crystalline phases. This is due to the fact that they have two-order parameters such as the tilt and herringbone (TO and HO, respectively) that are not present in colloidal systems, which only have positional and bond orientational order parameters, PO and BOP, respectively. Then the colloidal system presents only two crystalline phases in coexistence with the liquid phase, but a metastable hexatic phase can be found on compression between the 2D liquid and the 2D C2 crystal, in contrast to several hexatic phases presented by rodlike molecules of LM.
This phase behavior is in agreement with experimental observations. Pieranski has shown that at high densities, colloidal particles at the air/water interface form a 2D colloidal crystal.13 Later, Armstrong et al. showed evidence of the existence of a hexatic phase for colloid monolayers also at the air/water interface.29 However, this later work has been questioned because of possible lack of enough equilibration time.29At low densities, the formation of colloidal mesostructures, such as colloidal cluster and froths, have been observed. Therefore, our potential model reproduces the main features observed in colloidal systems trapped at the air/water interface, from low to high density, including the melting transition from crystal to liquid, with the presence of a H phase that is not produced by expanding the system, only by compression. The appearance of a metastable H phase in the melting of a 2D Lennard-Jones system, using a molecular dynamics method,30has been reported previously.
5. Conclusions
Two-dimensional colloidal systems have generated a great amount of research in the past decade, mainly due to a series of interesting phenomena such as like-charge attraction both in colloidal systems trapped between glass plates and at the air/ water interface. Furthermore, the attractive potential well found in both systems is quite similar, of the order of kBT. Some differences arise between these systems due that at the air/water interface colloidal interaction led to the formation of meso-structures such as froths, voids, and clusters, which do not appear in colloids trapped between glass plates. This difference might arise from the different range of the electrostatic repulsive interaction, which in colloids between glass plates is of a Yukawa-type while in colloids trapped at the air/water interface is a longer range type of dipolar origin. However, the origin of the attractive part of the potential is not clear and to date there is not a theory that can successfully explain the attractive interactions of confined colloidal systems.
In this work, we have used computer simulations of colloidal system models trapped at the air/water interface, in the NPT ensemble. The spherical colloidal particles were simplified by
Figure 6. The structure factor S(q) of the colloidal system along the T2*)0.8 for the hexactic metastable phase.
Figure 7. Π-T* projection for the phase diagram of 2D colloidal
hard disks for a two-dimensional system. We modeled the potential interaction throughout a series of repulsive SS and attractive SW potentials, with the attractive SW between the two SS repulsive potentials. This kind of potential has been used successfully to describe the physicochemical behavior of nanoparticles at the air/water interface. Also, theoretical and experimental evidences show that this pair potential is adequate for micrometer-size colloidal particles at the air/water interface. Our results show that indeed our model potential is capable of reproducing equilibrium states, similar to those experimentally observed in colloidal systems at the air/water interface: cluster-ing of colloidal particles at low densities, liquid and crystalline stable phases at high densities, and also metastable hexatic colloidal arrangements at high densities. Furthermore, we obtained several isotherms from which we were able to construct the phase diagram both on the surface pressure vs density and surface pressure-temperature projections that clearly show three-phase regions.
Equilibrium points at each phase region were carefully analyzed throughout their pair and bond orientational correlation functions, and the structure factor was also determined within each phase region. These studies confirmed the order of each phase: liquid (L) and crystalline (C1 and C2). Our results show that the melting of a 2D colloidal crystal is a two-step process from moderate to low surface pressures and low temperatures. This is a weakly first order phase transition from the C2 to C1 phase and then a stronger first order transition from C1 to the fluid phase. If the temperature and pressure are increased, the C1 phase melts directly into the fluid phase. Further increse in temperature and pressure induces contact aggregation of the particles, in agreement with experimental observation of charged colloidal particles trapped at the air/water interface.
In summary, we have shown that a DP model with long-range attractive and a longer long-range repulsive interactions can be used to simulate the thermodynamic behavior of charged colloidal particles trapped at the air/water interface, with good agreement with experimental observations.
Acknowledgment. This work was supported under
CONA-CYT Grants 42439/A-1, 43772, and 45944, and FAI-UASLP.
References and Notes
(1) Israelachvili, J. Intermolecular and Surface Forces; Academic Press: San Diego, CA, 1991.
(2) Grier, D. G. Curr. Opin. Colloid Interface Sci. 1997, 2, 262. (3) Derjaguin, B. V.; Landau, L. Acta Physicochim. URSS 1941, 14, 633. Verwey, E. J. W.; Overbeek, J. Th. G. Theory of Stability of Lyophobic
Colloids; Elsevier: Amsterdam, 1948.
(4) Croker J. C.; Grier D. G. Phys. ReV. Lett. 1996, 77, 1897. Larsen
A. E.; Grier, D. G. Nature 1997, 385, 230.
(5) Ruiz-Garcı´a, J.; Gamez-Corrales R.; Ivlev, B. I. Physica A 1997,
236, 97.
(6) Ghezzi, F.; Earnshaw, J. C.; Finnis, M.; McCluney, M. J. Colloid
Interface Sci. 2001, 238, 433.
(7) Ruiz-Garcı´a, J.; Gamez-Corrales, R.; Ivlev, B. I. Phys. ReV. E 1998, 58, 660.
(8) Nikolaides, M. G.; Bausch, A. R.; Hsu, M. F.; Dinsmore, A. D.; Brenner, M. P.; Gay, C.; Weitz, D. A. Nature 2002, 420, 299.
(9) Ruiz-Garcı´a, J.; Ivlev, B. I. Mol. Phys. 1998, 95, 371.
(10) Mejı´a-Rosales, S. J.; Gil-Villegas, A., Ivlev, B. I., and Ruiz-Garcı´a, J. J. Phys.: Condens. Matter 2002, 14, 4795.
(11) Gomez-Guzman, O.; Ruiz-Garcı´a, J. J. Colloid Interface Sci. 2005,
291, 1.
(12) Sciortino, F.; Tartaglia, P.; Zaccarelli, E. arXiv:cond-mat 2005, 0505453 v2.
(13) Pieranski, P. Phys. ReV. Lett. 1980, 45, 569.
(14) Sogami, I.; Ise, N. J. Chem. Phys. 1984, 81, 6320.
(15) Squires, T. M.; Brenner, M. P. Phys. ReV. Lett. 2000, 85, 4976.
(16) Ivlev, B. I. J. Phys.: Condens. Matter 2002, 14, 4829.
(17) Kralchesvsky, P. A.; Paunov, V. N.; Ivanov, I. B.; Nagayama, K. J. J. Colloid Interface Sci. 1992, 151, 79.
(18) Lebowitz, J. L.; Penrose, O. J. Math. Phys. 1966, 7, 98. (19) Kac, M.; Uhlenbeck, G. E.; Hemmer, P. J. Math. Phys. 1963, 4, 216.
(20) Sear, R. P.; Gelbart, W. M. J. Chem. Phys. 1999, 110, 4582. Heath, J. R.; Knobler, C. M.; Leff, D. V. J. Phys. Chem. B 1997, 101, 189. Gelbart, W. M.; Sear, R. P.; Heath, J. R.; Chaney, S. Faraday Discuss. 1999, 112, 299.
(21) Debenedetti, P. G.; Raghavan, P. S.; Borick, S. S. J. Phys. Chem. 1991, 95, 4540.
(22) Benavides, A. L.; Gil-Villegas, A. Mol. Phys. 1999, 97, 1225. (23) Buenrostro-Gonzalez, E.; Lira-Galeana, C.; Gil-Villegas, A.; Jian-zhong, W. AIChE J. 2004, 50, 2552.
(24) Allen, M. P.; Tildeslay, D. J. Computer Simulation of Liquids; Oxford University Press: Oxford, 1987.
(25) Gil-Villegas, A.; McGrother, S. C.; Jackson, G. Chem. Phys. Lett. 1997, 269, 441.
(26) Weiss, J. J. J. Phys.: Condens. Matter 2003, 15, S1471. (27) Kaganer, V. M.; Mo¨hwald H.; Dutta, P. ReV. Mod. Phys. 1999, 71, 779.
(28) Armstrong, A. J.; Mockler, R. C.; O’Sullivan, W. J. J. Phys.:
Condens. Matter 1989, 1, 1707.
(29) Murray, C. A. In Bond-Orientational Order in Condensed Matter
Systems; Strandburg, K. J., Ed.; Springer: New York, 1991.