Hypovitaminosis D and its relation to demographic and
laboratory data among hepatitis C patients
Livia Melo-Villar,* Elisabeth Lampe,* Adilson J. de Almeida,* Letícia de P. Scalioni,* Lia L. Lewis-Ximenez,* Juliana C. Miguel,* José A. Del Campo,** Isidora Ranchal,**
Cristiane A. Villela-Nogueira,*** Manuel Romero-Gomez**
* Laboratory of Viral Hepatitis, Oswaldo Cruz Institute, FIOCRUZ, Rio de Janeiro, Brazil.
** Unit for the Clinical Management of Digestive Diseases and CIBERehd, Hospital Universitario de Valme, Sevilla, Spain. *** Hepatology Unit, Medical Clinic Department, Clementino Fraga Filho University Hospital, UFRJ, Rio de Janeiro, Brazil.
ABSTRACT
Background. The relationship between 25-hydroxyvitamin D [25(OH)D] serum levels and response to antivi-ral therapy and laboratory data in HCV infection remains unclear. The aim of this study was to determine pre-treatment 25(OH)D serum level among HCV infected individuals and to evaluate the association be-tween vitamin D status, virological response, and laboratory data. Material and methods. Baseline serum 25(OH)D levels were measured in 237 chronic HCV infected patients (139 female, age 53.7 ± 11.2 years) us-ing chemiluminescence immunoassay. Correlations between serum 25(OH)D levels, virological and laborato-ry data regarding HCV infection as well as sustained virological response (SVR) to antiviral therapy were evaluated. Results. Mean serum values of 25(OH)D was 26.2 ± 12 ng/mL and prevalence of vitamin D defi-ciency (< 30 ng/mL) was 66.2%. Advanced age (> 55 years), high mean values of LDL, total cholesterol, HDL and low mean values of alkaline phosphatase and hemoglobin were statistically associated to vitamin D defi-ciency. Antiviral treatment was underwent by 133 HCV patients and 44.3% of them achieved SVR. Most of individuals that presented SVR also presented 25(OH)D level higher than 30ng/mL (55.9%). SVR was associat-ed to low mean values of LDL, total cholesterol and platelets; high mean values of ALT, AST and low fibro-sis grade. Conclusions: In conclusion, low vitamin D levels were observed among HCV infected patients and was associated to laboratory findings, however baseline 25(OH)D level is not independently associated with SVR.
Key words. Vitamin D. Hepatitis C virus. Virological response. Treatment.
Correspondence and reprint request: Livia Melo-Villar, Ph.D.
Viral Hepatitis Laboratory, Helio and Peggy Pereira Pavillion-Ground Floor-Room B09, FIOCRUZ Av. Brasil, 4365-Manguinhos-Rio de Janeiro, RJ, Brazil Postal Code: 210360-040.
E-mail: [email protected]
Manuscript received: October 01, 2014. Manuscript accepted: December 01, 2014.
INTRODUCTION
Vitamin D, whose active form is 1,25-dihydroxy vitamin D3, is essential for calcium and bone home-ostasis, and its deficiency has been associated with a number of diseases, such as cancer, cardiovascular and autoimmune diseases, insulin resistance (IR), and infectious disease.1-5 Among patients with chronic
liver disease, vitamin D deficiency is often observed and that finding has been related to severe fibrosis, low responsiveness to interferon-based antiviral
therapy in genotype 1 chronic hepatitis C (CHC) and the presence of mixed cryoglobulinemia and sys-temic vasculitis among CHC patients.6-9
Hepatitis C virus (HCV) infection affects more than 130 million of individuals10 and its treatment is
usually based in pegylated interferon (PEG-IFN) and ribavirin (RBV) for 24 weeks for patients infect-ed with HCV genotypes 2 or 3, or 48 weeks for those infected with HCV genotype 1, with rates of sus-tained virological response (SVR) ranging from 60-70% among CHC patients with genotypes 2 and 3, but lower than 50% in patients with genotype 1 us-ing conventional IFN therapy.11 In order to increase
SVR rates, the influence of genetic and metabolic factors have been studied, and, in the context, inter-leukin-28B (IL28B) polymorphism and IR are found to be associated to SVR.12-14 In addition, Nimer, et
al.15 and Abou-Mouch, et al.16 have shown that
The aim of our study was to determine serum lev-els of 25(OH)D in a cohort of CHC patients from Brazil, and to investigate the potential relationships between 25(OH)D levels and laboratory and virolog-ical parameters.
MATERIAL AND METHODS
Patients
The study population included CHC patients, res-ident in Rio de Janeiro and recruited at Viral Hepa-titis Ambulatory (Viral HepaHepa-titis Laboratory, Oswaldo Cruz Institute, FIOCRUZ), Hepatology Unit (Clementino Fraga Filho University Hospital, UFRJ), and General Medicine Department (Gaffrée Guinle University Hospital, UNIRIO). Patients were included if they had a virological diagnosis of CHC [anti-HCV and HCV RNA reactive serum sam-ple, with persistently abnormal alanine aminotrans-ferase (ALT), for at least 6 months]. The infecting HCV genotypes were the following: 1, 2, 3, and 5. Exclusion criteria were advanced cirrhosis (Child-Pugh B and C), presence of hepatocellular carcino-ma, human immunodeficiency virus (HIV) and/or hepatitis B co-infection, autoimmune liver disease, genetic liver disease (Wilson’s disease, hemochroma-tosis), previous HCV antiviral treatment, excessive alcohol consumption, concomitant use of drugs known to affect serum vitamin D concentration and intravenous drug use.
This study was conducted following the principles of the Declaration of Helsinki and their appendices. Approval was obtained from FIOCRUZ Ethics Com-mittee, and written informed consent was obtained from all subjects.
Clinical and laboratory assessment
Clinical and anthropometric data were collected simultaneously from all patients. Body mass index (BMI) was calculated on the basis of weight in kilo-grams and height (in meters). Waist circumference (cm) was measured at the midpoint between the low-er bordlow-er of the rib cage and the iliac crest. A 12-h overnight fasting blood sample was drawn to deter-mine serum levels of ALT, gamma-glutamyltrans-ferase (GGT), total cholesterol, high-density lipoprotein (HDL) and low-density lipoprotein cho-lesterol (LDL), triglycerides, ferritin, plasma glu-cose concentration, and platelet count. Serum insulin was determined by a chemiluminescence im-munoassay (LIASON Insulin assay, Diasorin, Italy).
IR was determined with the homeostasis model as-sessment method.17
The analysis of serum 25(OH) D was performed using a chemoluminescent immunoassay on a Liai-son automatic analyzer (LiaLiai-son 25 OH Vitamin D, DiaSorin). Data were expressed as nanograms per milliliter. In accordance with the manufacturer’s in-structions, serum 25(OH)D concentration of 30 ng/ mL was considered the threshold value for identify-ing low levels of vitamin D. Individuals were classi-fied as vitamin D deficient when serum 25(OH)D concentration was below 30ng/mL.
All patients were tested for HCV RNA by qualita-tive polymerase chain reaction (Cobas Amplicor HCV Test version 2.0, Roche, Austria; limit of de-tection: 50 IU/mL). HCV RNA positive samples were quantified by COBAS TaqMan HCV Test (Roche) and expressed as IU/mL. HCV genotyping was per-formed with INNO-LIPA HCV II kit (Innogenetics, Zwijnaarden, Belgium), which were used according to the manufacturer’s instructions or using geno-type-specific primers for entire core region and a part of 5’ noncoding region (5’NCR).18
Hepatic fibrosis was assessed using serum bio-chemical markers.19 Fib-4 index [age (years) x AST
(IU/L)]/[platelet count (109/L) x ALT (IU/L)1/2]
and FORNS index [7.811-3.131 X ln platelet count + 0.781 x ln GGT (IU/L) + 3.467 x ln age (years) -0.014 x cholesterol (mg/dL) were used. If FIB-4 was less than 1.45, individual was considered as low fibrosis and if FIB-4 was ≥ 1.45, Forns was consid-ered. Forns lower than 4.2 was classified as low fibrosis and Forns ≥ 4.2 was classified as high fibrosis.
Statistical analysis
Continuous variables were summarized as mean (±SD) and categorical variables as frequency and percentage. Nonparametric tests such as Mann-Whitney and Kruskal-Wallis tests were used to com-pare continuous variables that were not normally distributed (Kolmogorov-Smirnov test). Continuous variables with normal distribution were compared by using unpaired Student t-test. χ2 test was used
for comparison of categorical variables.
blood glucose, insulin, homeostasis model assess-ment score, fibrosis, SVR, HCV genotype, HCV RNA levels. Univariate regression analysis was also done to identify predictors of SVR as a category depend-ent variable among HCV individuals who underwdepend-ent antiviral therapy. Variables associated with the de-pendent variable in the univariate regression analy-ses (probability threshold, P < 0.05) were included in the multivariate logistic regression models 20. We used SPSS software, version 20.0 (IBM, USA) for all statistical analyses.
RESULTS
Patient characteristics
A total of 237 CHC patients were included in the study and the baseline features are shown in table 1. Mean age of HCV patients was 53.7 ± 11.2 years and most of them were female (58.6%). Mean BMI was 28.1 ± 3.8 kg/m2 and 79.6% of them were in the
overweight to obesity range.
HCV patients presented mean values of biochemi-cal parameters (ALT, AST, GGT, alkaline phos-phatase, ferritin) above normal values, while mean lipid values (HDL, LDL, triglycerides) were classi-fied as normal values. Mean blood glucose values were considered elevated (104.9 ± 45.5 ng/mL) as well as mean HOMA score value (3.6 ±3.7). Using HOMA score, IR was found among 59.9% of CHC patients. Mean hemoglobin values was 14.0 ± 1.3 ng/mL and 17 (7.1%) were classified as anemic (he-moglobin values < 12 ng/mL for women and < 13 ng/mL for men). HCV genotype 1 was the most prev-alent (87%), and mean HCV RNA was considered high (9.4 ± 85.0 x 10⁶ UI/mL). Using non invasive
methods, most of individuals presented high fibrosis grade (70.04%).
Serum 25(OH)D levels
Mean serum values of 25(OH)D in CHC patients were 26.2 ± 12.0 ng/mL Table 1. One hundred and fifty seven (66.2%) patients had vitamin D deficiency (< 30 ng/mL). Table 2 shows the results of compara-tive analysis of demographic and clinical variables and serum vitamin D concentration, categorized ac-cording to previously defined cutoff values.
Age (P = 0.003), high total cholesterol (P = 0.001), high LDL cholesterol (P = 0.023), high HDL cholesterol (P = 0.049), low alkaline phos-phatase (P = 0.009) and low hemoglobin levels (P = 0.018), were associated with lower 25(OH)D levels
Table 1. Baseline demographic, laboratory, metabolic and his-tological features of 237 chronic hepatitis C (CHC) patients.
Variable* CHC patients* (n = 237)
Age, years 53.7 ± 11.2
Sex
Male/Female (n) 98/139
Body mass index, kg/m2 28.1 ± 3.8 Platelet count x 103/mm 185.3 ± 79.6 HCV RNA, x 106 IU/mL 9.4 ±85.0
ALT, IU/L 72.0 ± 56.3
AST, IU/L 76.4 ± 53.4
Phosphatase alkalin, IU/L 140.1 ± 102.4
γ-GT, IU/L 105.6 ± 116.0
Cholesterol, mg/dL 198.7 ± 125.8 HDL cholesterol, mg/dL 51.8 ± 17.9 LDL cholesterol, mg/dL 125.5 ± 125.2 Triglycerides, mg/dL 105.1 ± 54.4
Ferritin, ng/mL 210.5 ± 118.6
Blood glucose, ng/mL 104.9 ± 45.5
Insulin, μU/mL 13.1 ± 11.8
Haemoglobin, ng/mL 14.0 ± 1.3
HOMA score 3.6 ±3.7
HOMA index, n (%)
< 2 95 (40.1%)**
≥ 2 142 (59.9%)**
Serum 25-Hydroxyvitamin D, n (%) 26.2 ± 12.0
< 30 ng/mL 157 (66.2%)**
≥ 30ng/mL 80 (33.8%)**
HCV genotypes, n (%)
1 206 (86.9%)**
Non 1 31 (13.1%)**
Hepatic fibrosis, n (%)
Low 71 (29.9%)**
High 166 (70.1%)**
* Continuous variables are expressed as mean value ± standard deviation. ** Percentages in parenthesis referred to the total of patients (n = 237). ALT: alanine aminotransferase. AST: aspartate aminotransferase. γ-GT, gamma glutamyltransferase. HDL: high-density lipoprotein. LDL: low-density lipoprotein. HOMA: homeostatic model assessments.
in CHC at univariate regression analysis. At multi-variate analysis, age (P = 0.019) and haemoglobin levels (P = 0.017) were found independent factors in multiple linear regression analysis (Table 2).
presenting vitamin D deficiency also presented high fibrosis grade (71.4%) and IR (61.1%).
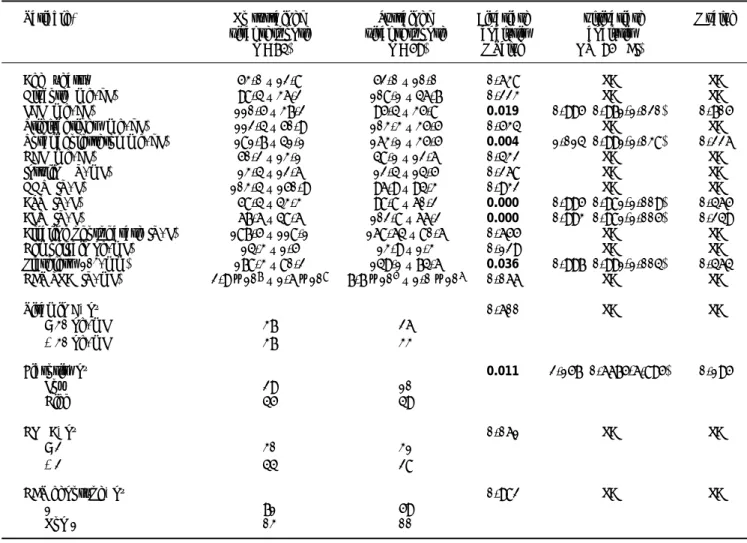
Factors associated with SVR
One hundred and thirty three HCV patients un-derwent and completed the antiviral treatment pro-gram. SVR was achieved in 59 individuals (44.2%) and all of them belonged to genotype 1. Low LDL (P = 0.019), low total cholesterol (P = 0.004), high AST (P = 0.000), high ALT (P = 0.000), low plate-lets (P = 0.036) and low fibrosis (P = 0.011) were
associated with SVR (Table 3) in the univariate analysis, but none of them were associated to SVR at multivariate analysis. SVR was more prevalent in those patients without IR (52.5%) presenting high 25(OH)D levels (55.9%). However, these variables were not statistically significant.
DISCUSSION
In the present study, serum 25(OH)D levels were evaluated in HCV infected patients according to an-tiviral therapy response and clinical-biochemical
Table 2. Univariate and multivariate regression analysis of factors associated with serum 25(OH)D levels in 237 chronic hepatitis C patients.
Variable* 25 (OH) Vitamin D levels Bivariate Multivariate P value < 30 ng/mL ≥ 30 ng/mL analysis analysis
(n = 157) (n = 80) P Value OR (95% CI)
Age (years) 55.2 ±10.6 50.6 ±11.8 0.003 0.958 (0.929-0.987) 0.005
Sex 0.07
Female 99 40
Male 58 40
Body mass index (kg/m2) 28.1 ±3.8 28.3 ±4.1 0.896 NA NA
Glucose (mg/dL) 108.2 ±50.7 99.1 ±33.7 0.494 NA NA
LDL (mg/dL) 139.5 ±152.4 100.7 ±37.9 0.023 0.999 (0.980-1.020) 0.956
Triglycerides (mg/dL) 104.7 ±59.6 105.8 ±43.6 0.431 NA NA
Total cholesterol (mg/dL) 214.5 ±151.3 169.5 ±40.9 0.001 0.992 (0.973 – 1.011) 0.41
HDL (mg/dL) 53.6 ±19.2 48.6 ±14.9 0.049 0.995 (0.969 – 1.022) 0.716
Insulin (mU/mL) 13.7 ±12.4 12.2 ±10.9 0.577 NA NA
GGT (IU/L) 110.2 ±125.0 96.6 ±96.3 0.62 NA NA
AST (IU/L) 80.2±56.7 69.1 ±45.8 0.062 NA NA
ALT (IU/L) 69.3 ±55.9 77.3 ±56.9 0.206 NA NA
Alkaline phosphatase (IU/L) 134.2 ±109.1 151.8 ±87.7 0.009 1.001 (0.998-1.004) 0.386
Hemoglobin (ng/mL) 13.9 ±1.3 14.3 ±1.3 0.018 1.328 (1.053-1.675) 0.017
Platelets (103/mm) 186.7 ±76.1 182.8 ±86.1 0.739 NA NA
Ferritin (ng/dL) 210.0 ±115.9 214.0 ±144.9 0.926 NA NA
HCV RNA (lU/mL) 1.2 x 10⁷ ± 1.0 x 10⁸ 1.6 x 10⁶ ± 2.7 x 10⁶ 0.289 NA NA
Sustained virological response,§ n 0.6 NA NA
Yes 26 33
No 37 37
Fibrosis, n NA NA
Low 45 26 0.638
High 112 54
HOMA, n 0.35 NA NA
< 2 61 34
≥2 96 46
HCV genotype, n 141 65 0.134 NA NA
1 16 15
Non 1
features of HCV infection. To our knowledge, this is the first study that describes vitamin D levels among HCV infected individuals from South America giv-ing some new insight about this parameter in tropi-cal regions. The major findings of this study were:
• High prevalence of hypovitaminosis D in HCV infected patients.
• The association between low serum 25OHD levels and some demographic (age) and laborato-ry data (LDL, cholesterol, HDL, alkaline phos-phatase, hemoglobin ).
• Lack of association between serum 25OHD levels and SVR to IFN-based therapy.
High prevalence of hypovitaminosis D (66.3%) was observed in Brazilian HCV infected individuals
similar to that observed among European and Amer-ican HCV patients. Prevalence of hypovitaminosis D varying from 46.4 to 73% among monoinfected HCV patients from Italy1,14,21 and 86% among HIV-HCV
infected individuals from France.9 A recent
metanal-ysis also showed that 71% of HCV infected individu-als from Europe and North America had low vitamin D levels.22 In the present study, low serum
25OHD levels was associated to higher values of mean age, LDL, total cholesterol, HDL, and low mean values of alkaline phosphatase, hemoglobin in the univariate regression analysis, although only age was statistically significant in the multivariate analysis. Petta, et al.1 have also demonstrated that
age and HDL cholesterol are independently associat-ed to low vitamin D levels, however the reason for this finding it is not explained.
Table 3. Univariate and multivariate regression analysis of risk factors associated with sustained virological response (SVR) in 133 chronic hepatitis C patients.
Variable* No sustained Sustained Bivariate Multivariate P value
viral response viral response analysis analysis
(n = 74) (n = 59) P Value OR (95% CI)
Age (years) 53.0 ± 12.8 52.0 ± 10.0 0.638 NA NA
Glucose (mg/dL) 98.4 ± 36.2 108.1 ± 46.7 0.223 NA NA
LDL (mg/dL) 110.5 ± 37.2 95.4 ± 35.8 0.019 0.995 (0.971-1.020) 0.705
Triglycerides (mg/dL) 112.4 ± 50.9 103.3 ± 35.5 0.534 NA NA
Total cholesterol (mg/dL) 181.7 ± 41.1 163.1 ± 35.5 0.004 1.014 (0.991-1.038) 0.226
HDL (mg/dL) 50.2 ± 13.1 48.1 ± 12.6 0.432 NA NA
Insulin (μU/mL) 13.4 ± 12.6 12.4 ± 14.5 0.268 NA NA
GGT (IU/L) 103.4 ± 150.9 96.9 ± 94.3 0.932 NA NA
AST (IU/L) 58.4 ± 43.3 98.8 ± 60.2 0.000 0.995 (0.981-1.009) 0.465
ALT (IU/L) 67.6 ± 48.6 102.8 ± 66.2 0.000 0.993 (0.981-1.005) 0.249
Alkaline phosphatase(IU/L) 187.5 ± 118.1 168.64 ± 80.6 0.655 NA NA
Hemoglobin(ng/mL) 14.3 ± 1.5 13.9 ± 1.3 0.129 NA NA
Platelets (103/mm) 178.3 ± 80.2 149.1 ± 74.6 0.036 0.997 (0.991-1.004) 0.464 HCV RNA (IU/mL) 2.9 x 10⁷ ± 1.6 x 10⁸ 7.7 x 10⁵ ± 1.0 x 10⁶ 0.066 NA NA
Vitamin D, n§ 0.600 NA NA
< 30 ng/mL 37 26
≥ 30 ng/mL 37 33
Fibrosis, n§ 0.011 2.157 (0.6675-6.895) 0.195
Low 29 10
High 45 49
HOMA, n§ 0.061 NA NA
< 2 30 31
≥2 44 28
HCV genotype, n§ 0.982 NA NA
1 71 59
Non 1 03 00
* Continuous variables data are expressed as mean value ± standard deviation. § Total values were not 237 individuals, since only 133 underwent antiviral
This study also demonstrated that low vitamin D levels were not associated to fibrosis grade as ob-served by Kitson, et al.23 and Bitetto et al.14 among
HCV infected individuals from Australia and France, respectively. The differences observed in these studies could be due to different reasons:
• Absence of data regarding the season when blood sampling was performed; during the summer in-dividuals could be more exposed to sun and con-sequently they could present higher levels of vitamin D24.
• High frequency of high fibrosis grade (88%) in the present study and
• Different methods for vitamin D determination (HPLC for Petta, et al.7 and Kitson, et al.23 and
electroquimioluminescence at Bitetto, et al.14 and
in the present study).
Vitamin D levels were not associated to SVR in the present study, as previously observed among CHC patients from Australia23 and among HIV/HCV
coinfected individuals.14,24 This fact could be due to
the large number of individuals included in the present study or some genetic characteristics of Bra-zilian population, such as, miscegenous population. In the present study, SVR was statistically associat-ed with low mean values of LDL and total cholester-ol, high mean values of AST, ALT and platelets and low fibrosis grade. Berg, et al.25 found that LDL
lev-els (≥ 2.6 mmol/L) are associated with SVR for tel-aprevir-based therapy in HCV genotype 1 patients. Low fibrosis grade have been associated to high SVR rates, as demonstrated among patients infected with HCV genotypes 2 or 3 receiving PEG-IFN and ribavirin (Niederau, et al.26). In addition, Ferreira,
et al.27 showed that high ALT values are associated
with SVR among HIV/HCV infected patients in Brazil. The data found in the present study would be useful for defining successful strategies for PEG-IFN plus ribavirin treatment.
The main limitation of this study lies in its cross-sectional nature and its inability to dissect the tem-poral relation between 25(OH)D and laboratory data. Another limitation of this study is the lack of data on the potential confounders that may influ-ence the levels of vitamin D, such as exposure to sunshine, dietary intake, and the prevalence of oste-oporosis. Therefore, all patients involved in this study lived in Rio de Janeiro, where sunshine is abundant throughout the year. The absence of data on polymorphisms of vitamin D hydroxylating en-zymes, and on other variables involved in vitamin D
metabolism, such as parathyroid hormone, and in vitamin D signaling regulation also could affect the interpretation of our results.
CONCLUSION
Vitamin D deficiency was common among Brazil-ian HCV infected patients and it was no associated with SVR; however a relationship of vitamin D sta-tus and some laboratory data that could potentially influence the response to therapy was observed.
FINANCIAL SUPPORT
This research was supported by Fundação de Amparo a Pesquisa do Estado do Rio de Janeiro (FAPERJ), Brazilian National Counsel of Techno-logical and Scientific Development (CNPq), Coordi-nation of Improvement of Higher Education Personnel (CAPES) and Oswaldo Cruz Foundation (FIOCRUZ).
ACKNOWLEDGEMENTS
The authors wish to thank Brunna Lemos Crespo Marques, Elisângela Ferreira da Silva, Gabriela Car-doso Caldas, Moyra Machado Portilho for technical assistance in collecting and processing blood samples.
REFERENCES
1. Petta S, Cammà C, Scazzone C, Tripodo C, Di Marco V, Bono A, Cabibi D, et al. Low vitamin D serum level is relat-ed to severe fibrosis and low responsiveness to interfer-on-based therapy in genotype 1 chronic hepatitis C. 15.
Hepatology 2010; 51: 1158-67.
2. Steinvil A, Leshem-Rubinow E, Berliner S, Justo D, Finn T, Ish-shalom M, Birati EI, et al. Vitamin D deficiency preva-lence and cardiovascular risk in Israel. Eur J Clin Invest
2011; 41: 263-8.
3. Fleet JC, DeSmet M, Johnson R, Li Y. Vitamin D and can-cer: a review of molecular mechanisms. Biochem J 2012; 441: 61-76.
4. O’Brien MA, Jackson MW. Vitamin D and the immune sys-tem: Beyond rickets. Vet J 2012; 194: 27-33.
5. Sung CC, Liao MT, Lu KC, Wu CC. Role of vitamin D in insu-lin resistance. J Biomed Biotechnol 2012; 2012: 634195. 6. Stokes CS, Krawczyk M, Reichel C, Lammert F, Grünhage
F. Vitamin D deficiency is associated with mortality in pa-tients with advanced liver cirrhosis. Eur J Clin Invest
2014; 44(2): 176-83.
7. Petta S, Grimaudo S, Marco VD, Scazzone C, Macaluso FS, Cammà C, Cabibi D, et al. Association of vitamin D serum levels and its common genetic determinants, with severity of liver fibrosis in genotype 1 chronic hepatitis C pa-tients. J Viral Hepat 2013; 20: 486-93.
vari-ants on fibrosis progression rate in HCV patients. Liver Int 2012; 32: 635-43.
9. Terrier B, Jehan F, Munteanu M, Geri G, Saadoun D, Sène D, Poynard T, et al. Low 25-hydroxyvitamin D serum levels correlate with the presence of extra-hepatic manifesta-tions in chronic hepatitis C virus infection. Rheumatology (Oxford) 2012; 51: 2083-90.
10. Lavanchy D. Evolving epidemiology of hepatitis C virus.
Clin Microbiol Infect 2011; 17: 107-15.
11. Klenerman P, Gupta PK. Hepatitis C virus: current con-cepts and future challenges. QJM 2012; 105: 29-32. 12. Eslam M, Aparcero R, Kawaguchi T, Del Campo JA, Sata M,
Khattab MA, Romero-Gomez M. Meta-analysis: insulin re-sistance and sustained virological response in hepatitis C.
Aliment Pharmacol Ther 2011; 34: 297-305.
13. de Rueda PM, López-Nevot MÁ, Sáenz-López P, Casado J, Martín-Casares A, Palomares P, Quiles R, et al. Importance of host genetic factors HLA and IL28B as predictors of re-sponse to pegylated interferon and ribavirin. Am J Gas-troenterol 2011; 106: 1246-54.
14. Bitetto D, Fattovich G, Fabris C, Ceriani E, Falleti E, For-nasieri E, Pasino M, et al. Complementary role of vitamin D deficiency and the interleukin-28B rs12979860 C/T poly-morphism in predicting antiviral response in chronic hepa-titis C. Hepatology 2011; 53: 1118-26.
15. Nimer A, Mouch A. Vitamin D improves viral response in hepatitis C genotype 2-3 naïve patients. World J Gastro-enterol 2012; 18: 800-5.
16. Abu-Mouch S, Fireman Z, Jarchovsky J, Zeina AR, Assy N. Vitamin D supplementation improves sustained virologic response in chronic hepatitis C (genotype 1)-naïve pa-tients. World J Gastroenterol 2011; 17: 5184-90.
17. Eslam M, Kawaguchi T, Del Campo JA, Sata M, Khattab MA, Romero-Gomez M. Use of HOMA-IR in hepatitis C. J Viral Hepat 2011; 18: 675-84.
18. Idrees M. Development of an improved genotyping assay for the detection of hepatitis C virus genotypes and sub-types in Pakistan. J Virol Methods 2008; 150: 50-6. 19. Martínez SM, Crespo G, Navasa M, Forns X. Noninvasive
assessment of liver fibrosis. Hepatology 2011; 53: 325-35.
20. Harrell FE Jr, Lee KL, Mark DB. Multivariable prognostic models: issues in developing models, evaluating assump-tions and adequacy, and measuring and reducing errors.
Stat Med 1996; 15: 361-87.
21. Ladero JM, Torrejón MJ, Sánchez-Pobre P, Suárez A, Cuen-ca F, de la Orden V, Devesa MJ, et al. Vitamin D deficiency and vitamin D therapy in chronic hepatitis C. Ann Hepatol
2013; 12: 199-204.
22. Villar LM, Del Campo JA, Ranchal I, Lampe E, Romero-Gomez M. Association between vitamin D and hepatitis C virus infection: A meta-analysis. World J Gastroenterol
2013; 19: 5917-24.
23. Kitson MT, Dore GJ, George J, Button P, McCaughan GW, Crawford DH, Sievert W, et al. Vitamin D status does not predict sustained virologic response or fibrosis stage in chronic hepatitis C genotype 1 infection. J Hepatol 2013; 58: 467-72.
24. Guzmán-Fulgencio M, García-Álvarez M, Berenguer J, Jiménez-Sousa MA, Cosín J, Pineda-Tenor D, Carrero A, et al. Vitamin D deficiency is associated with severity of liv-er disease in HIV/HCV coinfected patients. J Infect 2014; 68: 176-84.
25. Berg T, Andreone P, Pol S, Roberts S, Younossi Z, Diago M, Lawitz EJ, et al. Low-density lipoprotein and other predic-tors of response with telaprevir-based therapy in treat-ment-experienced HCV genotype 1 patients: REALIZE study. Liver Int 2014.
26. Niederau C, Mauss S, Schober A, Stoehr A, Zimmermann T, Waizmann M, Moog G, et al. Predictive factors for sustained virological response after treatment with pegylated interferon α-2a and ribavirin in patients in-fected with HCV genotypes 2 and 3. PLoS One 2014; 9: e107592.
27. Ferreira PR, da Silva MH, Brandão-Melo CE, Rezende RE, Gonzalez M, Reuter T, Urbaez JD, et al. The clinical ef-fectiveness of pegylated interferon and ribavirin for the treatment of chronic hepatitis C in HIV-infected patients in Brazil: a multicentric study. Braz J Infect Dis