of the Cuban rodent
Capromys pilorides
(Rodentia: Capromyidae)
"
Alejandro Silva
1, Adriana Artiles
2,3, William Suárez
4, Gilberto Silva
4 1Grupo de Tecnología, Empresa de Gestión del Conocimiento y la Tecnología, GECYTCalle 20 e/ 41 y 47 #4110, Playa, La Habana, Cuba 2Laboratorio de Genética Molecular, Hospital Hermanos Ameijeiras San Lázaro 701 esq. Belascoaín, Centro Habana, CP 10 300, La Habana, Cuba 3Laboratorio de Sanidad Acuícola, Centro de Investigaciones Pesqueras, CIP 5ta. Avenida y 246, Barlovento, Santa Fe, Playa, CP 19100, La Habana, Cuba 4Departamento de Paleogeografía y Paleobiología, Museo Nacional de Historia Natural de Cuba, MNHNCu Obispo 61, Plaza de Armas, Habana Vieja, CP 10100, La Habana, Cuba E-mail: [email protected]
ABSTRACT The complete mitochondrial DNA (mtDNA) control region from Capromys pilorides, an autochthon Cuban rodent, was sequenced and compared to two other species of hystricognath caviomorph rodents, in order to know patterns of variation and to explore the existence of previously described domains and other elements in rodents. The results revealed that the complete D-loop region of this species is 1336 base pairs long. Our data were compatible with the proposal of three domains [extended terminal associated sequences (ETAS), central (CD), and conserved sequence blocks (CSB)] within the control region, as well as the subsequences ETAS1, ETAS2, CSB1, CSB2, and CSB3. Likewise, a repetitive DNA region between the subsequences CSB1 and CSB2 was observed. The most conserved domain in the mitochondrial control region was the CD domain followed by ETAS and CSB domains in that order. The comparative analysis on base composition and genetic distance support the rationale of using the mitochondrial control region as a source of useful markers for population genetic studies with application to the conservation of this and other related Cuban rodent species, some of them under severe extinction risk.
Keywords: Capromys pilorides, D-loop structure, rodents Biotecnología Aplicada 2011;28:136-141
RESUMEN
Secuencia y estructura de la región control mitocondrial del roedor cubano Capromys pilorides (Rodentia: Capromyidae). Con el objetivo de explorar los patrones de variación y la presencia de los dominios y subsecuencias se secuenció la región control mitocondrial (D-loop) completa de Capromys pilorides, un roedor autóctono cubano, y se comparó con la descripción de otros dos roedores hystricognathos caviomorfos. Los resultados mostraron que la región control mitocondrial completa de esta especie tiene con 1336 pares de bases, y se verificó la presencia de los dominios y las secuencias extendidas asociadas a la terminación (ETAS), central (CD), y bloque de secuencias conservadas (CSB) y las subsecuencias ETAS1, ETAS2, CSB1, CSB2, y CSB3. A su vez, se observó una región de ADN repetitivo entre las subsecuencias CSB1 y CSB2. La región más conservada resultó ser la correspondiente al dominio CD, a la que siguen los dominios ETAS y CSB. El análisis comparativo de la composición de bases entre dominios y de la distancia genética, apoya el propósito de utilizar estas secuencias como fuentes de marcadores útiles para los estudios de genética poblacional, con aplicación a la conservación de esta y otras especies de roedores cubanos afines, algunas de ellas en severo riesgo de extinción.
Palabras clave: Capromys pilorides, estructura D-loop, roedores
I
ntroduction
The maternal inheritance pattern of vertebrate mito-chondrial DNA, together with the presence of ortholo-gous genes in single copies, an extremely low recom-bination rate [1], high mutation rates [2] and number of copies that facilitates its amplifi cation, have made this biomolecule an essential tool for studies in ge-netics, taxonomy, systematics and evolution, as well as the ideal target for genetic research on biodiversity conservation. Mitochondrial DNA has been the most recurrent source of molecular markers during the last three decades [3].
Mammalian mitochondrial genomes are closed double-stranded circular molecules containing 13
protein-coding genes, 2 ribosomal RNA genes and 22 tRNA genes. Non-coding regions are circumscribed to two areas, called the control region or D-loop, in-volved in the replication and transcription of these molecules, and the OL region, involved in replication initiation [4]. Studies have revealed that the most rap-idly evolving part of the mitochondrial genome is the control region or D-loop [5]. Research on the mam-malian D-loop [6]show that can be divided into 3 do-mains: Extended Termination-Associated Sequences (ETAS; from the proline tRNA to the central domain), the central domain (CD), and Conserved Sequence Blocks (CSB) (from the CD to the phenylalanine
Hurst GDD, Jiggins FM. Problems 1.
with mitochondrial DNA as a marker in population, phylogeographic and phylo-genetic studies: the effects of inherited symbionts. Proc R Soc Lond B Biol Sci. 2005;272:1525-34.
Nabholz B, Glémin S, Galtier N. Strong 2.
variations of mitochondrial mutation rate across mammals the longevity hypothesis. Mol Biol Evol. 2008;25(1):120-30.
Galtier N, Nabholz B, Glémin S, Hurst 3.
GD. Mitochondrial DNA as a marker of molecular diversity: a reappraisal. Mol Ecol. 2009;18(22):4541-50.
tRNA). Comparative studies of the mitochondrial control region (MCR) of mammals have demonstrat-ed that each domain has a different pattern of varia-tion, as ETAS and CSB evolve rapidly, whereas CD is strongly conserved between species [6, 7].
The analysis of 25 full-length MCR sequences from 23 species of the Sciurognathi and Hystricognathi sub-orders of the Rodentia order, plus one of Lagomorph
order [8], suggested that the only sequence elements of this region that is conserved across all rodent spe-cies is the central domain (CD), a conserved region of the ETAS domain adjacent to CD called ETAS1, and the conserved sequence block 1 (CSB1) from do-main CSB. The sample used in this study, however, included only 4 species of the Hystricognathi rodent suborder.
Efforts to map world biodiversity have uncovered around 2000 species of rodents; of which, more than 40 species and 12 genera have been discovered in neo-tropical zones alone since 1992 [9]. This mammalian group is increasingly vulnerable, as illustrated by the extinction of 50 to 51% of its species in the last 500 years [10]. There are 388 living species of island ro-dents, classifi ed into 127 genera and 10 families. The
Capromyidae family, endemic to the Antilles, belongs to the hystricognath caviomorphrodents of the New World, and represents the only endemic family exclu-sively composed of island dwellers [11].
Capromyinae, one of the subfamilies grouped into the Capromyidae family, contains all living and ex-tinct species of hutia. Five genera with 26 species are currently recognized in this subfamily; of them, 17 (66%) are extinct. There are 7 living species in Cuba [12], fi ve of which currently face the risk of extinction to certain degrees [13]. In addition, the living species of hutia represent the only examples of Cuban indig-enous land mammals still observable in the wild, as the rest are either extinct or have not been sighted re-cently, as in the case of Solenodon cubanus [12].
Capromys pilorides (CP)is the most abundant and widely distributed capromid species in the Cuban ar-chipelago, occupying widely dissimilar habitats and exhibiting an extensive phenotypic variability [14-17]. It therefore represents a prime candidate for stud-ies of the sequence and structure of the D-loop region that may contribute to genetic research for conserva-tion efforts targeted at these species.
To fulfi ll this objective, we have sequenced and determined the structure of the D-loop region of CP, which was then compared to those of two other hystricognath caviomorph rodents: Cavia porcellus
(CV) and Octodon degus (OD).
M
aterials and methods
Species included in the study
Table 1 contains relevant data on the species of this study, including their taxonomic classifi cation at the family and suborder levels within the Rodentia order, as well as the GenBank accession number for the se-quences used in the comparisons.
Extraction and amplification of DNA
Total DNA from two CP specimens belonging to the collection of frozen biological materials of the
Nation-al Museum of NaturNation-al History of Cuba was obtained from liver samples, using the DNeasy Tissue system
(Qiagen, USA) and the protocol recommended by the manufacturer. This material was used to amplify a mi-tochondrial DNA fragment of approximately 2.3 kb long, containing the sequences for the 3’ end of the cytochrome b gene, threonine and proline tRNA, the MCR, phenylalanine tRNA, and a portion of the 12s gene, using primers O-009 (5’-GCCTATGCCATC-CTACGCTC-3’) and O-012 (5’-GGTGTGCTTGA-TACCCGCTC-3’) (Figure 1). Both primers were de-signed based on published sequences of mitochondrial cytochrome b and 12s genes from CP [18, 19], using the FastPCR software application [20] (Figure 1).
The amplifi cation reactions (PCR) were set up in a volume of 50 μL, using the components of the GoTAQ Core system and 2.5 U of Taq polymerase, both
ob-tained from Promega (USA). The amplifi cation used an initial denaturation step at 94 oC for 5 min, fol-lowed by 35 cycles of a denaturation step at 94 oC for 45 s, an annealing step at 58 oC for 45 s, and an extension step at 72 oC for 2.5 min, followed by a fi nal single extension step at 72 oC for 10 min.
Amplifi cation products were examined in 8% aga-rose gel in TBE buffer (Tris base 54 g/L, boric acid 27.5 g/L, 20 mL of 0.5 M EDTA pH 0.8), and the 2.3 kb product was purifi ed with the Wizard SV Gel and PCR Clean-Up System from Promega (USA).
Cloning and sequencing
The purifi ed fragments were ligated into pGEMT-easy, using the conditions and components of the pGEM-T and pGEM-T Easy Vector Systems (Promega, USA). XL-1 Blue competent cells [21], obtained from the Center for Genetic Engineering and Biotechnology of Cuba, were transformed with the ligation mixture and the positive clones were selected on LBA plates (tryptone 10 g/L, yeast extract 5 g/L, NaCl 10 g/L, pH 7.2, agar 15 g/L, ampicillin 100 μg/mL) to which 40 μL of both 100 mM IPTG and X-gal at 20 mg/mL Table 1. Rodent species included in this study
Species
aGenBank/EMBL.
bNE: Sequence does not exist in the database.
ND: Not determined.
Specimen Family Capromys pilorides Capromys pilorides Octodon degus Cavia porcellus Mus musculus Rattus norvegicus MNHNCCu-25.0066 MNHNCCu-25.0067 ND ND ND ND FR686471 NEb AY007362 AJ222767 AJ512208 NM181627 Hystricognathi Hystricognathi Hystricognathi Hystricognathi Sciurognathi Sciurognathi Capromyidae Capromyidae Octodontidae Caviidae Muridae Muridae Accession Numbera Suborder
CYTB-3’ D-loop 5’-12S
Phenylalanine
ARNt
Proline ARNt
Threonine ARNt
0-009 0-048 0-049 0-012
Figure 1. Sketch of the amplified region of the mitochondrial genome of Capromys pilorides, displa-ying the approximate position of primers O-009 and O-012, used for initial amplification and later sequencing, and primers O-048 and O-049, used only during sequencing.
Shadel GS, Clayton DA. Mitochondrial 4.
DNA maintenance in vertebrates. Annu Rev Biochem. 1997;66:409-35.
Saccone C, Lavane C, Pesole G, 5.
Sbisa E. Peculiar features and evolution of mitochondrial genomes in mammals. In: DiMauro S, Wallace DC, editors. Mito-chondrial DNA in human pathology. New York: Raven Press;1993. p. 27-37.
Sbisà E, Tanzariello F, Reyes A, Pesole 6.
G, Saccone C. Mammalian mitochondrial D-loop region structural analysis: identi-fication of new conserved sequences and their functional and evolutionary implica-tions. Gene. 1997;205(1-2):125-40.
Pesole G, Gissi C, De Chirico A, Sac-7.
cone C. Nucleotide substitution rate of mammalian mitochondrial genomes. J Mol Evol. 1999;48(4):427-34.
Larizza A, Pesole G, Reyes A, Sbisà 8.
E, Saccone C. Lineage specificity of the evolutionary dynamics of the mtDNA D-loop region in rodents. J Mol Evol. 2002; 54(2):145-55.
Amori G, Gippoliti S. A higher-taxon 9.
approach to rodent conservation priorities for the 21st century. Anim Biodivers Con-serv. 2003;26(2):1-18.
Macphee RDE, Flemming C. Requiem 10.
Aeternam. The last five hundred years of mammalian species extinctions. In: MacPhee RDE, editor. Extinctions in near time. New York: Kluwer Academic / Plenum Publisher. 1999; p. 333-71.
Amori G, Gippoliti S, Helgen KM. 11.
Diversity, distribution, and conservation of endemic island rodents. Quat Int. 2008; 182:6-15.
Silva T G, Duque S W, Diaz-Franco 12.
S. Mamíferos terrestres autóctonos de Cuba. Ciudad de la Habana: Ediciones Boloña; 2007.
International Union for the Con-13.
were added to facilitate the identifi cation of recombi-nant clones.
Four white colonies and one blue colony obtained from the amplifi cation of DNA from each CP speci-men were submitted to colony PCR [22] to corrobo-rate the presence of the 2.3 kb insert. Positive plas-mids were purifi ed with the Wizard Plus SV Minipreps DNA Purifi cation System (Promega, USA), following the manufacturer’s instructions.
Plasmid DNA samples were shipped to Macrogen (South Korea) for sequencing both strands with uni-versal primers, and also primers O-048 (5’-TCTG-GTTCTTTCTTCAGG-3’), and O-049 (5’-GAGAT-GTCTTATTTAAGGG-3’), binding to a subsequence of the central domain (Figure 1). They were designed based on the MCR from CV, using the FastPCR soft-ware application [20].
Sequence analysis
MCR sequences from both CP specimens were aligned to their corresponding orthologs in CV and OD using Clustal X 2.0.10 [23], analyzing nucleotide composition with DAMBE v5.0.48 [24] and PAUP 4.10 beta [25]. Genetic distance values used to esti-mate sequence homology between the three species were calculated with MEGA 4.0 [26], using Kimura’s 2-parameter evolution model (K2P) [27].
The presence or absence of the main subsequences (ETAS, CD and CSB) reported for mammalian [5, 6] and, specifi cally, rodent MCR [8], was ascertained by visual inspection, since they exhibited an acceptable level of homology. The absence or presence of the ETA2 subsequence was corroborated with a separate alignment that included rodent species Mus musculus
and Rattus norvegicus which, unlike CV and OD, do have this subsequence previously identifi ed.
R
esults and discussion
Sequence and characterization of the MCR from C. pilorides
Both CP specimens had an MCR that was 1336 bp long. As shown in previous studies of this region us-ing mammals, and specifi cally rodents [5, 6, 8], it was also divided into a highly conserved central domain fl anked by ETAS and CSB domains. There was also a repetitive DNA segment within the CSB domain (Fig-ure 2). Given the high sequence identity (98%) of the two CP specimens included in this study, the results of their analysis will not be reported individually, but to the species in general.
ETAS domain
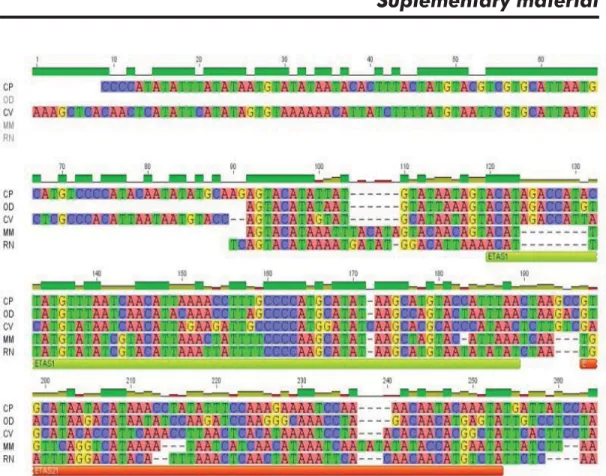
The ETAS domain is 350 bp long in CP. Two conserved subsequences have been described within this region; they are named ETAS1 and ETAS2. While ETAS2 is conserved across different mammalian species [5, 6, 28, 29], it is reportedly absent in certain rodents [8]. Using comparisons with MCRsequences from CV, OD, M. musculus,and R. norvegicus, it was possible to corroborate the presence of both subsequences in CP (Figure 1, supplementary material). Likewise, an ongoing phylogenetic study (Silva A, unpublished observations), using ETAS sequences from 20 spe-cies of hystricognath rodents, has also confi rmed the
presence of ETA2 subsequences. Although a previous study reported a repetitive region within this domain in rodents [8], we did not fi nd it in CP.
Central Domain
This domain is 309 bp long in CP. Subsequences A, B and C (Figure 2), involved in the binding of cytoskel-etal elements associated to the mitochondria [30], were confi rmed.
CSB domain
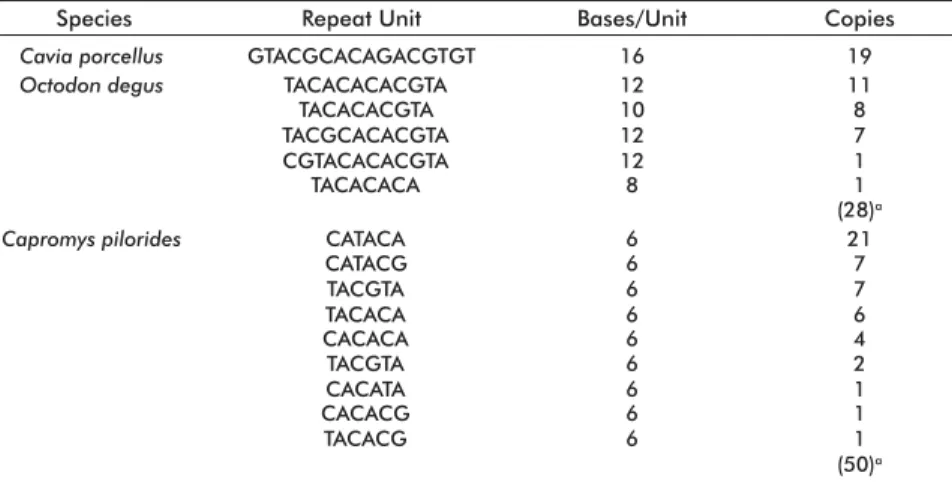
The CSB domain was 676 bp long in CP, structured into the three canonical sequence blocks of this region (CSB1, CSB2 and CSB3). Additionally, CSB from CP has a 300 bp-long repetitive DNA region between CSB1 and CSB2 (Figure 2), in agreement with previ-ously published data for other mammals and, espe-cially, rodents [5, 6, 8, 29, 31, 32]. In CP the repetitive DNA region is composed of 50 hexamers, not all of which are identical (Table 2).
Comparison to CV and OD
The fundamental goal of this study was to deter-mine the sequence and structure of the mitochondrial control region of a representative species of Cuban rodents from the Capromyinae subfamily to apply
molecular genetic tools to future efforts for their con-servation. It was therefore necessary to compare the MCR sequence from CP to that from phylogenetically close rodents to evaluate the feasibility of using our results as the basis of future population, inter-species and supra-species studies.
The species chosen for the comparison, CV and OD, are also New World hystricognath rodents. OD is evo-lutionarily closer to CP than CV [33-36]; it is therefore expected to cluster with CP and away from CV on the basis of sequence similarity alone. Results shown on Table 3 confi rm these expectations regarding both do-main length and genetic distance (homology).
When comparing domain length (Table 3), howev-er, there is an important disparity in the case of ETAS in OD. This is not a contradictory fi nding in itself, however, as the length of this domain is known to vary in rodents [8], although this is clearly not a con-clusive structural and functional explanation. Apart from this exception, the remaining domains have sim-ilar lengths across all three species compared.
An examination of the calculated genetic distance values (Table 3) indicates that the homologies of do-mains ETAS and CD (Table 3) are similar to those described for other mammalian families [37, 38]. In the specifi c case of domain CD in the CP/OD pair, the computed genetic distances are even close to the average for genera within the same rodent family [39], although both species belong to different fami-lies (CP to Capromyidae and OD to Octodontidae).
This confi rms the close phylogenetic relationship of these families, which, not coincidentally, are grouped together in superfamily Octodontoidea.
CV, on the other hand, belongs to family Caviidae
belonging to the Cavioidea superfamily.
Consequent-ly, its genetic divergence (inverse of homology) is larger when compared to the other two species, be-cause they are not so closely related from an evolu-tionary viewpoint [37].
Berovides AV, Alfonso SMA, Cama-14.
cho PA. Variabilidad de la jutía conga
Capromys pilorides (Rodentia, Capro-myidae) de Cuba. Doñana Acta Vertebr. 1990;17(1):122-7.
Berovides AV, Camacho PA, Comas 15.
GA, Borroto PR. Variación ecológica en poblaciones de la jutía conga Capromys pilorides (Rodentia, Capromyidae). Cienc Biol. 1990;23:44-58.
Berovides AV, Gutiérrez AA. Grado 16.
de heterocigocidad y peso corporal de la jutía conga Capromys pilorides ( Ro-dentia, Capromyidae). Rev. Biol .1999; 13(1):59-60.
Berovides AV.Variaciones morfofisi-17.
ológicas en poblaciones de jutía conga
Capromys pilorides (Rodentia, Capro-myidae) en hábitats de bosques y manigua costera. Cubazoo 2006;13:11-5.
Nedbal MA, Allard MW, Honeycutt 18.
RL. Molecular systematics of hystricognath rodents: evidence from the mitochon-drial 12S rRNA gene. Mol Phylogenet Evol. 1994;3(3):206-20.
Leite YL, Patton JL. Evolution of 19.
South American spiny rats (Rodentia,
Echimyidae): the star-phylogeny hypoth-esis revisited. Mol Phylogenet Evol. 2002; 25(3):455-64.
Kalendar R, Lee D, Schulman AH. 20.
FastPCR Software for PCR Primer and Probe Design and Repeat Search. In: Mansour A, editor. Focus on Bioinformatics. Genes, Genomes and Genomics. 2009;3(Special Issue 1):1-14.
Tu Z, He G, Li KX, Chen MJ, Chang 21.
J, Chen L, et al. An improved system for competent cell preparation and high efficiency plasmid transformation using different Escherichia coli strains. Electron J Biotechnol. 2005;8(1):113-20.
Zon LI, Dorfman DM, Orkin SH. The 22.
polymerase chain reaction colony mini-prep. Biotechniques. 1989;7(7):696-8.
Larkin MA, Blackshields G, Brown NP, 23.
Chenna R, McGettigan PA, McWilliam H,
et al. Clustal W and Clustal X version 2.0. Bioinformatics. 2007;23(21):2947-8.
Xia X. Data analysis in molecular 24.
biology and evolution. Boston/Dordrecht/ London: Kluwer Academic Publishers; 2000.
Swofford DL. PAUP: Phylogenetic 25.
analysis using parsimony (and other methods). Version 4. Sunderland: Sinauer Associates; 2000.
Tamura K, Dudley J, Nei M, Kumar S. 26.
MEGA4: Molecular Evolutionary Genetics Analysis (MEGA) software version 4.0. Mol Biol Evol. 2007;24(8):1596-9.
Kimura M. A simple method for 27.
estimating evolutionary rates of base substitutions through comparative stud-ies of nucleotide sequences. J Mol Evol. 1980;16(2):111-20.
Reyes A, Nevo E, Saccone C. DNA 28.
sequence variation in the mitochondrial control region of subterranean mole rats, Spalax ehrenbergi superspecies, in Israel. Mol Biol Evol. 2003;20(4):622-32.
Matson CW, Baker RJ. DNA sequence 29.
Figure 2. Complete sequence of the mitochondrial control region of Capromys pilorides, showing the ETAS, Central and CSB domains and subsequences ETAS1, ETAS2, A, B, C, CSB1, CSB2, CSB3 and repetitive DNA.
10 20 30 40 50 60 70 80 90
CCCCATATATTTATATAATGTATATAATACACTTTACTATGTACGTCGTGCATTAATGCATGTCCCCATACAATATATGCAAGAGTACAT
100 110 120 130 140 150 160 170 180
ATTATGTATAATAGTACATAGACCATACTATGTTTAATCAACATTAAACCTTTGCCCCATGCATATAAGCATGTTACCATTTAACTAAGC
190 200 210 220 230 240 250 260 270
CGTGCATAATACATAAACCTATATTTCCAAAGAAAATCCAAAACAATACAAATATGATTATCCAAAAACAATCTATTGATTTTACATAAG
280 290 300 310 320 330 340 350 360
ACATACAATGTGTTATTATACATTAGTACATGTAATTAAATTATCCTTGTCAACACGTCTATTACTAACCATTAGAAATCTATTAATAAC
370 380 390 400 410 420 430 440 450
CATCCTCCGAGAAACCATCAACCCGCCAAGCAGGTGTCCCCCTCCTCGCTCCGGGCCCATTAAATGTGGGGGTAGCTAGAGTGAAACTTT
460 470 480 490 500 510 520 530 540
AACAGACATCTGGTTCTTTCTTCAGGGCCATAAAATTCAAATTGCTCATTCGTTCCCTATAAATAAGACATCTCGATGAAATTGGGTCTA
550 560 570 580 590 600 610 620 630
CTGGAAAGAAACCAGCAACAACCTTACTAAATACATTTGGTAACTATTTAATTTTAGGGATGCTGTGACTCAGCATAGCCGTCAAGGCAT
640 650 660 670 680 690 700 710 720
GAACGCTTCCAACTTAACTGTAGTCGGACTTATTAGTCAGTACCCTTAGCCCGCATAATAAAATCCTTGTAATGAATTCTTTTAATGCTA
730 740 750 760 770 780 790 800 810
GGAGGACATAAGAAAAATTATACACATACACGCATACACACACACATACACACACGCATACATACACACACATACACACACATACGCATA
820 830 840 850 860 870 880 890 900
CGCACACACATACACATACACATACACATACACATACACATACACATACGCATACACATACACATACACATACACATACACATACACATA
910 920 930 940 950 960 970 980 990
CGCATACGCATACGCATACACATACGCATACACATACACATACACATACACATACACACACATACGCATACACATACACATACACATACA
1000 1010 1020 1030 1040 1050 1060 1070 1080
CATACGCATACGCATACGCATACGCATACGCATACGCATACGTACGTACGTATTAATTACCAATAATTATCTTTTAACAAACCCCCCTTA
1090 1100 1110 1120 1130 1140 1150 1160 1170
CCCCCCCATAAAATTACAAATTTAATACATAGGCATTTAATCCCATGTACCGTACTTGATATCCTGCCAAACCCCAAAAACAAGAGGGAC
1180 1190 1200 1210 1220 1230 1240 1250 1260
AAGCACAAAAATGTAATATTTTACGATCTTCCTGATACTGTATCATAGAGTGCAAAAAATAAAATTTAACCCTCATGTCAGTACAATATG
1270 1280 1290 1300 1310 1320 1330 1336
TGCCCAACTGTTCACAGAGTGCATTTATTTGCACTTGCCTATGTAATATTTTTCACGTCTAATACAGCCCTCTTTC
DOMINIO ETAS
ETAS 1 DOMINIO ETAS
ETAS 2 DOMINIO ETAS
DOMINIO ETAS
SECUENCIA A
DOMINIO CENTRAL
SECUENCIA B
DOMINIO CENTRAL
DOMINIO CENTRAL
DOMINIO CSB
DOMINIO CSB
DOMINIO CSB
DOMINIO CSB
DOMINIO CSB
DOMINIO CSB
DOMINIO CSB
DOMINIO CSB
DOMINIO CSB
SECUENCIA C
CSB 1
CSB 1
CSB 2
CSB 2 CSB 3
ADN REPETITIVO
ADN REPETITIVO
ADN REPETITIVO
ADN REPETITIVO
ETAS DOMAIN
ETAS DOMAIN
ETAS DOMAIN
ETAS DOMAIN
CENTRAL DOMAIN
CENTRAL DOMAIN
CENTRAL DOMAIN
REPETITIVE DNA
REPETITIVE DNA
REPETITIVE DNA REPETITIVE DNA
CSB DOMAIN
CSB DOMAIN
CSB DOMAIN
CSB DOMAIN
CSB DOMAIN
CSB DOMAIN
CSB DOMAIN
CSB DOMAIN CSB DOMAIN
CSB DOMAIN
SEQUENCE A
The above results are confi rmed on examining the alignments for domains ETAS (Figure 1, supplemen-tary material), CD (Figure 2, supplemensupplemen-tary material) and CSB (Figure 3, supplementary material; exclud-ing the repetitive DNA region from each species) as well as Table 3.
The three alignments demonstrate a greater simi-larity between domain sequences from CP and OD, evidencing that the incidence of insertions and dele-tions between these two species is much lower to that of these two and CV.
The largest genetic distance, largest numbers of insertions and deletions, and highest proportion of in-sertions and deletions larger than 1 bp (parentheses in Table 3, insertions/deletions) are observed in the specifi c case of domain CSB, confi rming the greater variability of this domain compared to ETAS and CD. This is even more evident in CV in respect to the other two species, underscoring once again the degree of evolutionary divergence between these species.
A repetitive DNA region was also observed in domain CSB for the three species, located between subsequences CSB1 and CSB2. This region, how-ever, had inter-species differences for the number of repeats and their composition (Table 2). For instance, CV had several copies of a single repeat, whereas CP and OD were heterogeneous in repeat sequence and numbers.
The presence of repetitive DNA in mammalian CSB domains has been well documented. This re-petitive region is highly variable, and may even be entirely absent [5, 6, 8]. In any case, its role within the context of the mitochondrial control region is still unknown.
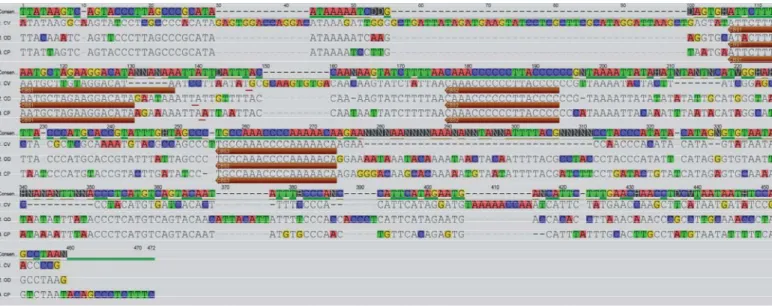
The alignments for domain CSB (Figure 3, supple-mentary material) demonstrate the presence of se-quence blocks CSB1, CSB2, and CSB3, with a high degree of sequence conservation except for small variations in CSB1 (Figure 3). These three blocks are not a conserved, general feature in rodents or in mammals, in general, since out of the 7 hystricognath with published full-length sequences of the mitochon-drial control region, only those examined here have all three blocks present.
In summary, despite the availability of previous sequences from CP and other capromids published in the literature in studies of intra- and supra-species phylogenetic relationships within the Capromyidae
family [18, 19, 40], this is the fi rst published full-length D-loop sequence for a member of this taxon, and does not only enhance the knowledge on the
ge-netic resources of our country, but it is a starting point for exploring this region in mitochondrial DNA of other Cuban capromid species.
Results indicate that the sequence and structure of the MCR in CP correspond to those published for other rodents, in complete agreement with already established phylogenetic relationships within the Hystricognathi suborder.
The strong homology between the two full-length MCR CP specimens sequences (98%), and the co-herence of the values obtained from comparisons of ETAS and CD domains between species, regarding their length, genetic distance and number of insertions and deletions with those obtained for these domains in other rodents [41-43]in population genetics stud-ies, lead to the conclusion that these sequences may be useful for population studies of Cuban capromids focused on their conservation.
Table 2. Composition of the repetitive DNA region in the three studied species
aTotal number of copies. Cavia porcellus Species GTACGCACAGACGTGT Repeat Unit 16 Bases/Unit 19 Octodon degus TACACACACGTA
TACACACGTA TACGCACACGTA CGTACACACGTA TACACACA 12 10 12 12 8 11 8 7 1 1 (28)a Capromys pilorides CATACA
CATACG 66 217
TACGTA TACACA CACACA 6 6 6 7 6 4 TACGTA
CACATA 66 21
CACACG 6 1
TACACG 6 1
(50)a Copies
Table 3. Comparison of Capromys pilorides (CP), Octodon degus (OD), and Cavia porcellus (CV) in domain length, sequence homology and deletions
aK2P homology. Numbers in parenthesis refer to the number of insertions and deletions longer than 1 bp. bETAS: Extended termination-associated sequences.
cCD: Central domain.
dCSB: Conserved sequence block.
*Excluding the repetitive DNA region.
OD CV 266 351 310 315 679 684
1 2
73 -49 50
1 2
84 -60 68
1 2
69 -54 60
1 2
2 -5 7
1 2
0 -7 -7
1 2 CP 350 309 677 - - - - - - - - - - - -
8(2) -16 15 (12) (11)
Domain length (bp)
Species ETASb CDc CSBd Homology (%) ETASInsertions/deletionsCD CSB* a
ETAS CD CSB*
Figure 3. Alignment of sequence blocks CSB1, CSB2 and CSB3 from domain CSB in Capromys pilorides (CP), Octodon degus (OD) and Cavia porcellus (CV). CSB2 and CSB3 are highly conserved, whereas CSB1 differentiates between the three species. Each subsequence was colored so as to highlight differences compared to the consensus (Cons.).
Mol Biol Evol. 2001;18(8):1494-501. Jackson DA, Bartlett J, Cook PR. Se-30.
quences attaching loops of nuclear and mi-tochondrial DNA to underlying structures in human cells: the role of transcription units. Nucleic Acids Res. 1996;24(7):1212-9.
Gemmell NJ, Western PS, Watson JM, 31.
Graves JA. Evolution of the mammalian mitochondrial control region-comparisons of control region sequences between monotreme and therian mammals. Mol Biol Evol. 1996;13(6):798-808.
Stewart DT, Baker AJ. Patterns of 32.
sequence variation in the mitochondrial D-loop region of shrews. Mol Biol Evol. 1994;11(1):9-21.
Huchon D, Douzery EJ. From the Old 33.
World to the New World: a molecular chronicle of the phylogeny and
biogeogra-Cons.
CV
CSB1 CSB2 CSB3
OD CP
1 10 20 25 1 10 17 1 10 18
ATTCTTTTAATGCTAGAAGGACATA CAAACCCCCCTTACCCC TGCCAAACCCCAAAAACA
A
cknowledgements
The authors wish to thank the direction of the Mo-lecular Genetics Laboratory of Hermanos Ameijeiras Hospital, its specialists and the hospital management
for the use of their facilities and their constant support during the experimental stage of this study. This was a project funded by the World Wildlife Fund (WWF) of Canada.
phy of hystricognath rodents. Mol Phylogenet Evol. 2001;20(2):238-51.
Honeycutt RL, Rowe DL, Gallardo MH. 34.
Molecular systematics of the South American caviomorph rodents: relationships among spe-cies and genera in the family Octodontidae. Mol Phylogenet Evol. 2003;26(3):476-89.
Opazo JC. A molecular timescale for cav-35.
iomorph rodents (Mammalia, Hystricognathi). Mol Phylogenet Evol. 2005;37(3):932-7.
Galewski T, Mauffrey JF, Leite YL, Patton JL, 36.
Douzery EJ. Ecomorphological diversification among South American spiny rats (Rodentia; Echimyidae): a phylogenetic and chrono-logical approach. Mol Phylogenet Evol. 2005; 34(3):601-15.
Johns GC, Avise JC. A comparative sum-37.
mary of genetic distances in the vertebrates from the mitochondrial cytochrome b gene. Mol Biol Evol. 1998;15(11):1481-90.
Castresana J. Cytochrome b phylogeny 38.
and the taxonomy of great apes and mam-mals. Mol Biol Evol. 2001;18(4):465-71.
Bradley RD, Baker RJ. A test of the genetic 39.
species concept: Cytocrhome b sequences and mammals. J Mammal. 2001;82(4):960-73.
Woods CA, Borroto R, Kilpatrick CW. 40.
Insular patterns and radiations of West Indian rodents. In: Woods CA, Sergile FE, editors. Biogeography of the West Indies: patterns and
perspectives. 2nd ed. Boca Raton: CRC Press, 2002. p. 335-53.
Ojeda AA. Phylogeography and genetic 41.
variation in the South American rodent Tym-panoctomys barrerae (Rodentia: Octodonti-dae). J Mammal. 2010;91(2):302-13.
Meshchersky IG, Feoktistova NY. Intraspe-42.
cific organization of dwarf hamsters Phodopus campbelli and Phodopus sungorus (Rodentia: Cricetinae) based on mtDNA analysis. Dokl Biol Sci. 2009;424:35-8.
Trucchi E, Gentile G, Sbordoni V. De-43.
velopment of primers to amplify mitochon-drial DNA control region of Old World por-cupines (subgenus Hystrix). Mol Ecol Resour. 2008;8(5):1139-41.
Suplementary material
Figure 1. Alignment of the ETAS domain sequences of Capromys pilorides (CP), Octodon degus (OD), Cavia porcellus (CV), Mus musculus (MM) and Rattus norvegicus (RN), showing the ETAS1 and ETAS2 sequence blocks.