A rapid multiplex assay for nucleic acid-based diagnostics
Alina Deshpande
a,⁎
, Jason Gans
b, Steven W. Graves
c, Lance Green
b, Laura Taylor
b, Heung Bok Kim
b,
Yuliya A. Kunde
b, Pascale M. Leonard
d, Po-E Li
b, Jacob Mark
b, Jian Song
b,
Momchilo Vuyisich
b, P. Scott White
ba
Decision Applications Division, Mail Stop K551, Los Alamos National Laboratory, Los Alamos, NM 87545, United States
bBioscience Division, Mail Stop M888, Los Alamos National Laboratory, Los Alamos, NM 87545, United States c
Center for Biomedical Engineering, Department of Chemical and Nuclear Engineering, MSC01 1140, 1 University of New Mexico, Albuquerque, NM 87131, United States
d
Scientific Laboratory Division, New Mexico Department of Health, 700 Camino de Salud NE PO Box 4700 Albuquerque NM 87196-4700, United States
a b s t r a c t
a r t i c l e i n f o
Article history:
Received 17 August 2009
Received in revised form 23 November 2009 Accepted 2 December 2009
Available online 16 December 2009
Keywords:
Ligation-based assay Luminex
MOL-PCR
Multiplex diagnostics Surveillance Microsphere array
We have developed a rapid (under 4 hours), multiplex, nucleic acid assay, adapted to a microsphere array detection platform. We call this assay multiplex oligonucleotide ligation-PCR (MOL-PCR). Unlike other ligation-based assays that require multiple steps, our protocol consists of a single tube reaction, followed by hybridization to a Luminex microsphere array for detection. We demonstrate the ability of this assay to simultaneously detectdiversenucleic acid signatures (e.g., unique sequences, single nucleotide polymorph-isms) in a singlemultiplex reaction. Detection probes consist of modular components that enable target detection, probe amplification, and subsequent capture onto microsphere arrays. To demonstrate the utility of our assay, we applied it to the detection of three biothreat agents,B. anthracis, Y. pestis,andF. tularensis. Combined with the ease and robustness of this assay, the results presented here show a strong potential of our assay for use in diagnostics and surveillance.
Published by Elsevier B.V.
1. Introduction
Rapid diagnosis of disease is essential to timely mitigation and treatment. An ideal diagnostic assay should: 1) be rapid, 2) not require multiple rounds of confirmatory testing, 3) have low setup and operational costs and 4) identify the cause of disease and also allow additional characterization. For example, if the causative agent is a pathogen, an ideal assay should perform detection and identification, strain typing, detect antibiotic resistance determination, virulence pre-diction, etc. Such an assay would enable a“rule-in”approach, where multiple pathogens or genetic causes are simultaneously screened and characterized, as opposed to a“rule out”approach that uses multiple serial or parallel assays. Few existing assays combine all these traits, and typically involve trade-offs.
Nucleic acid-based assays are ideal for diagnostics due to their high specificity, the ease with which they can be configured to detect almost any target, their requirement for minimal quantities of sample (high sensitivity), and their ability to be automated. In addition, recent ad-vances allow such assays to be configured in a multiplex format, enabl-ing simultaneous screenenabl-ing for multiple causative agents. Another feature of nucleic acid-based assays is that they can be performed on inactivated or sterilized samples, an important safety advantage com-pared to culture-based or immunoassays.
Multiplex ligation-based assays have been used to detect human genetic diseases.Schouten et al. (2002)introduced multiplex ligation-dependent probe amplification (MLPA), which has been routinely used to detect human genetic diseases based on copy number variation (Jalali et al., 2008; Kozlowski et al., 2008; Sørensen et al., 2008). MLPA is a ligation-based assay that uses fragment sizing by electrophoresis to discriminate amplified, ligated probes that are used to detect spe-cific signatures. The application of MLPA has been recently shown for the detection of drug resistantM. tuberculosis(Bergval et al., 2008), detection of oralflora in dental biofilms (Terefework et al., 2008) and respiratory viruses (Reijans et al., 2008). However, the entire process is relatively laborious and requires multiple steps, including an over-night hybridization procedure. Due to these draw backs, this assay chemistry is not as widely accepted as highly sensitive and rapid real time-PCR-based assays in the area of infectious disease diagnostics. However, disadvantages of real time-PCR include its limited ability for multiplexing and high cost per marker. Ligation-based assays can over-come both these drawbacks.
We have developed a rapid, high throughput, multiplex assay called multiplex oligonucleotide ligation-PCR (MOL-PCR;Mark et al., 2007) that can be read using microsphere arrays andflow cytometry. This assay enables direct detection of multiple nucleic acid signatures, such as unique sequences, single nucleotide polymorphisms (SNPs), insertions, deletions, repeats, etc., from complex mixtures. As a result, MOL-PCR can be used tosimultaneouslydetect a disease causing patho-gen using one type of signature and characterize its strain or determine
⁎Corresponding author. Tel.: +1 505 665 9143, +1 505 667 2751.
E-mail address:[email protected](A. Deshpande).
0167-7012/$–see front matter. Published by Elsevier B.V. doi:10.1016/j.mimet.2009.12.001
Contents lists available atScienceDirect
Journal of Microbiological Methods
antibiotic resistance using a different type of signature such as a SNP (Lindler et al., 2001; Price et al., 2003). This facilitates the“rule-in” approach for diagnostics. Our assay is performed as a single tube re-action, followed by hybridization to a Luminex microsphere array for detection, unlike MLPA adapted to microsphere arrays (Dawson and Lundquist, 2006), which requires 3 steps and takes over 16 h before hybridization to microsphere arrays. MOL-PCR can also be adapted to other detection platforms (fixed microarrays, gel-based formats). Importantly, as MOL-PCR probes are designed to be similar in length, the assay is not susceptible to the amplification bias commonly seen in multiplex PCR (Vora et al., 2004) or even MLPA. MOL-PCR can be also performed in a microplate format, enabling automation and high throughput.
To demonstrate the feasibility of the MOL-PCR assay, we devel-oped a multiplex assay for the simultaneous screening for three bio-threat agents,B. anthracis, Y. pestisandF. tularensis.Pathogen-specific probes were computationally designed and experimentally screened for specificity, sensitivity, and reproducibility in a multiplex approach. The best-performing probes for each pathogen were then combined into one multiplex panel, and tested for their ability to detect their targets. The assay panel was also tested on DNA extracts from com-plex matrices (specimens) obtained from the New Mexico Depart-ment of Health (NMDOH). Results demonstrate the potential of this assay to be used as a tool in surveillance and diagnostics.
2. Materials and methods
2.1. Assay description
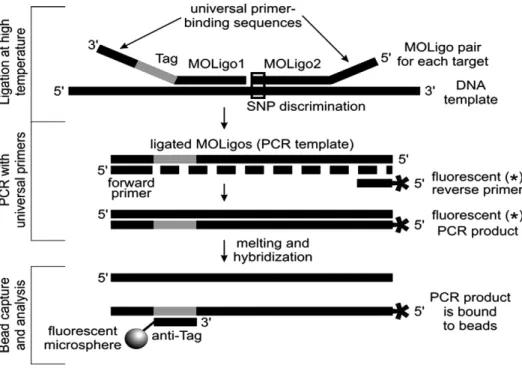
MOL-PCR uses multiplex ligation (Fig. 1) for the simultaneous detection of many specific signatures. Detection probes contain mod-ular components that allow 1) detection of target sequences, 2) uni-versalamplification and labeling of successfully ligated probes, and
3) capture of amplified products onto a microsphere array. A“ uni-versal”set of capture probes allows a wide variety of assays to utilize the same array elements (e.g. commercially available Luminex xTAG® beads). The assay comprises three steps:
• Detection
• Signal amplification • Hybridization and readout
2.1.1. Detection
Detection is achieved by using modular, 40–70 nucleotide-long, single-stranded DNA probes called MOLigo pairs (MOL-PCR oligonu-cleotide pairs).Fig. 1shows the functional components of a MOLigo pair (MOLigo1 and MOLigo2) in the panel titled“Ligation at High Tem-perature”. When the target for a particular MOLigo pair is present in a reaction, the MOLigo pairs will anneal adjacent to each other on the target. If annealing occurs, DNA ligase recognizes this structure and covalently links MOLigo1 and MOLigo2. This step creates single-stranded DNA molecules of approximately 100–120 nucleotides long that serve as PCR templates for signal amplification and labeling. Ligation only occurs if the terminal bases of MOLigo1 and MOLigo2 at the junction site are complementary to the target sequence, and this property confers SNP discrimination. Ligation is performed using a thermostable ligase that is functional at higher annealing temper-atures of the MOLigo pairs, conferring specificity. The ligation of MOLigo1 and MOLigo2 is the actualdetection eventand will only occur if MOLigo1 and MOLigo2 both anneal next to each other in the pres-ence of the cognate target.The ligation reaction can be multiplexed to allow the simultaneous screening for many signatures in the same reac-tion tube.
2.1.2. Signal amplification
As shown inFig. 1, in the panel titled“PCR with universal primers”, the ligation products undergo PCR amplification with a universal
primer pair. If the ligation reaction is multiplex, use of a universal primer pair allows the amplification ofmultipleligated products in the same reaction tube. In the absence of a target, ligation willnotoccur, the forward and reverse primer sites willnot be linked, and the un-ligated MOLigo pairs willnot produce geometrically amplified and labeled fragments that contain tags.
2.1.3. Hybridization to microsphere arrays and readout on luminexflow cytometer
The reverse PCR primer is tagged with afluorescent dye (e.g., Alexa Fluor®532) at the 5′end (depicted as a * inFig. 1), which allows the detection of the amplified ligation products. This also saves money due to the need for a label on only one primer that labels all success-fully ligated probes during the PCR process. The PCR products are hybridized to a microsphere array using tag sequences complemen-tary to anti-tags covalently linked to the microspheres. The micro-spheres are then analyzed by aflow cytometer (e.g. Luminex), which identifies each bead type and measuresfluorescence intensity emitted by the bead-(PCR product) complex. A microsphere in the array will only showfluorescence if it is hybridized to a labeled PCR product amplified from ligated MOLigo pairs, thus confirming the presence of the target DNA in the sample.
The method for performing MOL-PCR is described in the para-graphs below.
Ligation and PCR were conducted in a single reaction in afinal volume of 10μl, consisting of, 4 units/μl of Ampligase®DNA ligase (Epicentre), 5 nM of each MOLigo pair (Sigma-Genosys), 4 mM Mg++, 1X AmpliTaq Gold®Buffer II, 200μM dNTPs (Amersham), 0.04 units of Amplitaq Gold®DNA polymerase (Roche Molecular Systems), 500μM NAD+(New England Biolabs), 0.125μM forward PCR primer (Sigma-Genosys), 0.5μM Alexa Fluor®532 (Life Technologies) labeled reverse PCR primer, and water in a 9μl volume, combined with 1μl of template DNA. MOLigo1 (shown inFig. 1) was phosphorylated at its 5′end to allow covalent linkage to MOLigo2 in the presence of ligase. During ligation, Amplitaq Gold®was activated through a slow release mech-anism and therefore ready to perform the amplification of successfully ligated MOLigo pairs following the ligation step. The thermal cycling profile for the ligation-PCR reaction was 94 °C for 1.5 min, 30 ligation cycles at 50 °C for 30 s, and 94 °C for 25 s. The profile continues with 45 cycles (PCR) at 94 °C for 20 s, 58 °C for 20 s, and 72 °C for 20 s. The reaction was held at 4 °C until further processing. A separate reaction was set up for each template/sample to be screened, and all samples were processed in parallel on a 96-well (or 384-well) plate. This cor-responds to one plate of a singleplex assayper probein the MOL-PCR assay.
A microsphere mix consisting of anti-tag-conjugated Luminex xTAG®microspheres of each set specific to each MOLigo pair used in the assay was prepared and contained 1000 microspheres/μl of each set, 800 mM NaCl and 50 mM MES buffer (Fisher Bioreagents). 5μl of this mix was added to the MOL-PCR reaction (10μl) and the reaction was heated to 94 °C for 1 min, followed by a slow ramp down in perature to 25 °C with a hold of 1 min at 5 °C decrements in tem-perature. The reaction was held at 4 °C until further processing. For analysis on the Luminexflow cytometer, the reaction volume was increased to 50μl by adding 35μl of buffer that contained 10 mM Tris–Cl (pH 8.0), 0.1 mM EDTA, 90 mM NaCl and 0.02% Tween®20. The reaction was transferred to a 96-well round bottomed plate (Costar) and analyzed on a Luminexflow cytometer.
For each experiment, two controls were used for the calculation of the signal-to-noise ratio. 1) A bead-only control to report background fluorescence obtained from the microspheres alone. 2) A no template control to report cross reactivity of MOLigo pairs in the absence of any template. Medianfluorescence intensity (MFI) was used to calculate signal-to-noise. The MFI for this control was also the“noise”used for calculating the signal-to-noise ratio. MFI values for all samples and controls are imported into an Excelfile. The signal-to-noise ratios
were calculated byfirst subtracting the MFI of the bead-only control from all MFIs, and then dividing the MFI obtained for a sample by the MFI for the no template control. A signal-to-noise ratio of 4 and a MFI of 50 were criteria used to determine“positive samples”. MFI values were obtained from the analysis of 100 microspheres of each bead region for each sample.
2.2. Computational MOLigo pair design
MOLigo pairs were computationally designed to be highly specific to their intended targets and not cross react with any known non-target sequences. The inputs for the design algorithm were the avail-able, sequenced genomes, including all target and closely related non-target sequences. Specificity was defined by the MOLigo pair melting temperatures to target and non-target sequences. All melting temper-atures were computed using DNA hybridization-based sequence align-ment and melting temperature calculations (Gans and Wolinsky, 2008). The MOL-PCR design algorithm used four steps, summarized below:
1. All possible DNA sequences from each target genome that could serve as the target-complement sequence component of MOLigo2 were identified. This component was required to be 20 to 27 nucleo-tides long, have a G + C content between 20% and 80%, bind to its perfect match sequence with a melting temperature between 60 °C and 70 °C and have hairpin and homodimer melting temperatures less than 10 °C.
2. All potential MOLigo2 target-complement components were screened against all non-target genomes. Any component that bound to a non-target sequence with a melting temperature of 40 °C or higher, was discarded. All components that survived this subtraction process were predicted to beuniqueto the target genomes. This thermodynamic uniqueness criterion was used to confer target specificity to MOL-PCR assays that incorporated a unique fragment.
3. The number of MOL-PCR assays required to detect all targets was minimized. Any of the unique MOLigo2 components produced in step 2 that were predicted to bind a given target genome between 60 and 70 °C with at least three perfect match bases at the 3′end were candidates for detecting that target. The task offinding the minimal set of unique components to detectalltarget sequences is a set coverage problem, and was solved by Metropolis Monte Carlo-based simulated annealing (Valiant and Vazirani, 1986). 4. The minimal set of unique MOLigo2 components were
incorporat-ed into valid MOLigo pairs suitable for experimental testing. For each unique MOLigo2 component, aflanking MOLigo1 component that could bind to the same set targets (with the same thermody-namic constraints from step 1) was generated. If no valid MOLigo1 component was found, another unique MOLigo2 component was selected. The universal PCR primers and tag sequences were ap-pended to the MOLigo target sequences to form complete MOLigo pairs. All pairs were screened against the entire Genbank nucleo-tide database using the program thermonucleonucleo-tideBLAST (Gans and Wolinsky, 2008) to identify potential false positive matches to non-target sequences that might not have been included in step 2. The thermonucleotideBLAST program identifies MOL-PCR matches using both a thermodynamic binding criterion as well as a ligation-based requirement of perfect matches for the basesflanking the ligation site. Surviving MOLigo pairs were then synthesized for experimental testing.
3. Results
3.1. Development of a biothreat agent probe panel
3.1.1. Screening and selection of computationally designed MOLigo pairs for optimal performance in the detection of B. anthracis, Y. pestis and F. tularensis
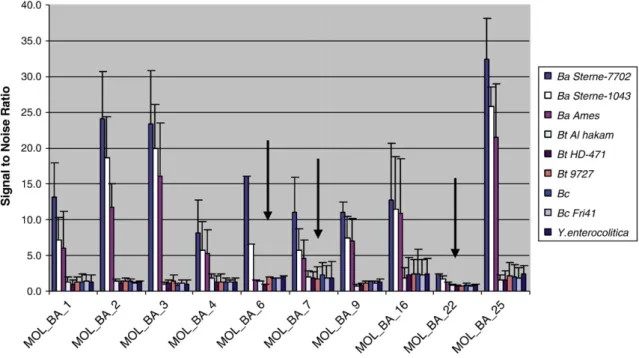
A panel of DNA samples assembled from the target, near neighbors and unrelated organisms was used to test each computationally de-signed pathogen-specific set of MOLigo pairs. The screening of MOLigo pairs was conducted in amultiplex formatusing MOL-PCR. The speci-ficity of MOLigo pairs was tested against the DNA panels, and sensi-tivity was tested using a range of target genome copies (10–106) diluted in HPLC grade water.Fig. 2shows the multiplex screening for specificity of 10 MOLigo pairs that targetedB. anthracissignatures. Arrows in thefigure point to examples of MOLigo pairs that would not be selected for the probe panel because they could not detect the various strains ofB. anthracis(MOL_BA_6), had a poor signal-to-noise ratio (MOL_BA_22), or exhibited high cross reactivity (MOL_BA_7).
The sensitivity of all MOLigo pairs ranged from 103to 104target genome copies per reaction, as shown in the example ofF. tularensis
MOLigo pair screening (Fig. 3). As this was an initial screen, tests were only performed on pure DNA in water rather than a relevant matrix such as blood or nasal secretions. Only MOLigo pairs that showed the highest specificity and sensitivity were selected for inclusion in the final probe panel. To evaluate the specificity of an individual MOLigo pair, we calculated the ratio of the target-specific signal-to-noise, and the highest non-target signal-to-noise. A ratio of≥4 in target/ non-target signal-to-noise indicated that the MOLigo pair had high specificity.
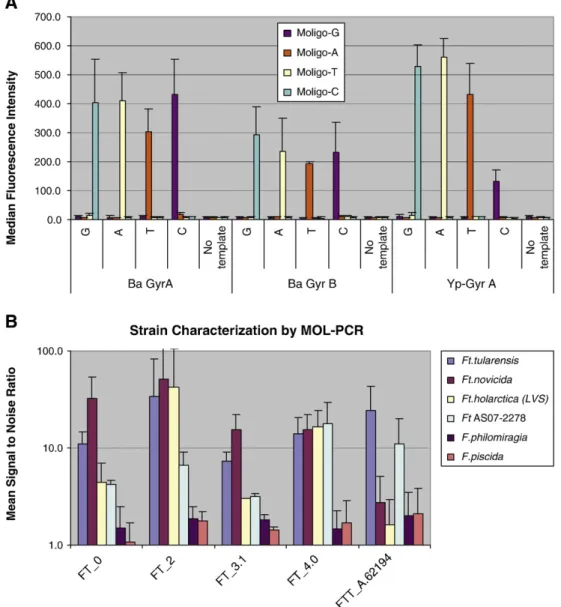
In addition to unique (“signature”) sequences, MOL-PCR can use SNPs for target discrimination.Fig. 4A shows the ability of four MOLigo pairs to correctly identify their complementary targets on synthetic templates that differ by a single base at the ligation junction. MOLigo pairs were designed to detect an A, G, C or T at codon 89 (SNP position A266G) in theGyr Agene and codon 475 (SNP position A1423G) in theGyr Bgene,forB. anthracis,and codon 81 (SNP position G242A) in the Gyr A gene forY. pestis. SNPs in these codons have been shown to Fig. 2.A 10-plex assay to screen forin-silicodownselected MOLigo pairs for the detection ofB. anthracis. MOLigo pairs were tested on DNA from the specific target, near neighbors and unrelated organisms. Black arrows point to examples of probes that would not be included in an assay panel either because they could not detect the various strains of
B. anthracis(MOL_BA_6) or because of a poor signal-to-noise ratio (MOL_BA_22), or because of higher cross reactivity with non-specific DNA that approached the threshold value for a“positive”signal shown by the horizontal red line (MOL_BA_7). A signal-to-noise ratio of 4 was determined to be the threshold for a“positive signal”. Error bars represent standard deviations for the mean signal-to-noise ratio obtained from experiments conducted at least three times.
confer resistance to Ciprofloxacin in these organisms (Price et al., 2003forB. anthracis,Lindler et al., 2001forY. pestis). The ability to discriminate base pair mismatchesflanking the ligation site is con-ferred by the ligase used in the reaction. The primary goal of this experiment was to test the SNP discrimination capability of MOL-PCR and we could have done so using artificial sequences. However, we chose to test it using relevant SNPs, such that antibiotic resistance char-acterization could be added to our detection probe panel to enhance the information content of our multiplex assay.
A unique feature of MOL-PCR is the ability tosimultaneouslydetect
diversesignatures such as unique sequences, SNPs, indels, and repeats. Fig. 4B shows the performance of probes that used multiple unique sequences to detectF. tularensis, and a single SNP-based probe that detectedF. tularensis tularensis, a strain of most concern for human health (Svensson et al., 2005). This probe was designed to detect a SNP present in the gene that codes for prolyl t-RNA synthetase, and is present only inFt tularensis. The results show that all panF. tularensis
probes (FT 0.0, 2.0, and 4.0) except FT_3.1, show a signal-to-noise
ratio above 4 for theF. tularensisstrains tested in this experiment, and values of signal-to-noise ratio below the cut off value for the near neighborsF. philomiragiaandF. piscida. In case of FT_3.1, cross reacti-vity was observed and this probe was eliminated from the panel. The
F. tularensis tularensis specific probe (FTT_A.62194) is specific for
F. tularensis tularensisand showed below cut off signal-to-noise ratios for DNA from other strains and near neighbors. Note: Sample Ft AS07-2278 is an isolate obtained from NMDOH (F. tularensisinfected rabbit bone). It showed a clear signal-to-noise ratio above 4, suggesting that it may beF. tularensissubspeciestularensis, however, the strain typing for this isolate has not been performed. These results demonstrate that MOL-PCR can provide both high-level (species) detection and low-level (strain) typing with asingletest.
3.1.2. Testing of the probe panel against three biothreat agents
The probe panel that combined the best-performing MOLigo pairs was assembled and validated using DNA panels that included
DNA from organisms found in the same class, but more genetically distant.Fig. 5shows an example of specificity testing for a 13-plex probe panel using near neighbors of the three targets. All DNA samples were tested between 106and 3 × 10⁶genome copies per reaction. As can be seen, the pathogen-specific probes clearly showed above cut off signal-to-noise ratios for the specific targets and almost no cross reactivity to non-targets. MOLigo pairs BA_9 and YP_1 did show cross
reactivity with DNA fromB. cereusFRI41. However, when tested at an order of magnitude lower concentration, the cross reactivity was not seen, while the signal-to-noise ratio for the targets of these probes remained higher than the cut off value. The redundancy built into the biothreat panel allows such probes to be removed from the panel, while maintaining the specific detection capability. The biothreat panel also did not cross react with 23 members of the gamma proteobacteria
class and 19 members of thefirmicutes class (data not shown, listed in Table 1). The panel of near neighbors and unrelated organisms was assembled through consultation with the NMDOH. Many of the DNA samples for this panel were also obtained from NMDOH.Table 1lists all the organisms whose DNA was used to test the specificity of the biothreat panel, and the estimated target copy number used in testing. This value was computed only for organisms whose genome size was known. The panel was divided into an“Inclusivity”set that comprised multiple strains of available target organisms, and an“Exclusivity”set that comprised the near neighbors for each target, and members of the firmicutes and gamma proteobacteria classes to which the target organisms belonged. All samples were pure DNA dissolved in water.
3.1.3. Testing probe panel on complex matrix samples
The ability of the probe panel to detect specific targets in clinical samples was evaluated by applying MOL-PCR to DNA extracted from either infected rodent liver and spleen extracts, or human whole blood, pleuralfluid, and pus samples, all spiked with pathogen DNA. Table 2shows the ability of the probe panel to correctly identify 9 out
Table 1
List of organism DNA used to test specificity of biothreat panel. Inclusivity panel Concentration range tested
(genome copy number per reaction)
Exclusivity panel Highest concentration tested (genome copy number per reaction)
DNA concentration (ng/reaction)
B. anthracis Ames 1 × 101–
1 × 10⁶
B. cereus 1,011,760 6
B. anthracis Sterne 1043 1 × 101–
1 × 10⁶
B. cereus. FRI 41 1,042,943 6
B. anthracis Sterne 7702 1 × 101–
1 × 10⁶
B. thuringiensis Al Hakam 1,041,536 6
Y. pestis A1122 1 × 101–
1 × 10⁶
B. thuringiensis kurstaki 1,700,000 10
Y. pestis CO92 1 × 101–1 × 10⁶ B. thuringiensis konkukian 1,045,396 6
F. tularensis novicida 1 × 101–1 × 10⁶ B. thuringiensis israelensis 1,700,000 10
F. tularensis tularensis 1 × 101
–1 × 10⁶
B. thuringiensis HD571 1,042,943 6
F. tularensis holarctica 1 × 101–
1 × 10⁶
B. circulans Genome size not available 10
B.firmus 2,281,439 10
B. laterosporus Genome size not available 10
B. megaterium 1,983,860 10
B. pumilus 2,463,448 10
B. anthracis(Ames) 1,571,211 9
G. haemolysans 4,884,752 10
S. aureus 3,242,044 10
S. pyogenes 4,926,341 10
S. pneumoniae 2,111,625 5
V. parvula Genome size not available 10
Y. pestis (A1122) 2,353,148 12
Y. pseudotuberculosis 2,885,055 15
Y. enterocolitica 2,372,433 12
Y. rukeri 1,797,195 9
Y. molaretti 4,837,268 24
Y. fredriksenii 1,883,317 10
Y. kristensenii Genome size not available 10
F. philomiragia 2,226,108 5
F. piscida Genome size not available 5
E. tarda Genome size not available 10
E. gergoviae Genome size not available 10
K. pneumoniae 1,716,943 10
K. cryocresens Genome size not available 10
L. adecarboxylata Genome size not available 10
L. pneumophila 2,727,618 10
M. wisconsensis Genome size not available 10
M. morganii Genome size not available 10
P. hemolytica Genome size not available 10
P. peneri Genome size not available 10
P. stuartii 1,982,326 10
P. aeruginosa 1,456,764 10
S. marcesens Genome size not available 10
F. tularensis (novicida) 2,388,903 5
The table presents a list of all the organisms used to test specificity of the 13-plex Biothreat Panel. The column titled“Inclusivity Panel”lists the strains of targets agents used test the ability of the probe panel to detect the three targets it was designed for,B. anthracis, Y. pestisandF. tularensis. The column to its right identifies the range of concentration used to test the sensitivity of the assay. The column titled“Exclusivity Panel”lists the near neighbors and more distantly related organisms of the targets that were used to test the cross reactivity of the biothreat panel. These included members of the Firmicutes class to whichB. anthracisbelongs, and the Gamma proteobacteria class to whichY. pestisandF. tularensisbelong. The subsequent column identifies the highest estimated genome copy number used per reaction in the experiments. Note that estimates could not be made for some of the organisms tested because the genome size is not known. However, the column titled“DNA concentration per reaction”provides the amount of DNA tested for each sample in ng/reaction.
Table 2
Validation of biothreat panel using DNA samples extracted from complex matrices. NMDOH
sample ID
Matrix Pathogen identified by MOL-PCR
Pathogen identified by NMDOH SLD 1 Pleuralfluid Y. pestis Y. pestis
SLD 2 Swab from ulcer B. anthracis B. anthracis
SLD 3 Blood B. anthracis B. anthracis
SLD 4 Blood Unidentified F. tularensis
SLD 14 Rodent spleen/liver F. tularensis F. tularensis
SLD 15 Rodent spleen/liver F. tularensis F. tularensis
SLD 16 Blood Y. pestis Y. pestis
SLD 17 Rodent spleen/liver F. tularensis F. tularensis
SLD 18 Rodent spleen/liver Y. pestis Y. pestis
SLD 20 Rodent spleen/liver F. tularensis F. tularensis
Results of MOL-PCR on DNA extracted from complex matrices. The column titled
of the 10blindedsamples. One sample could not be identified by this probe panel, although the pathogen was identified by TaqMan PCR with a Ct value of 32–34 (estimated to be about 10–100 copies in a 5μl sample), and confirmed by culturing performed at NMDOH. Experi-ments were conducted at least three times. It is likely that the pathogen DNA could not be identified in this sample because the concentration was below the detection limits of our assay in its current configuration, which uses only 1μl of sample.
4. Discussion
As nucleic-acid based detection and diagnostics become widely accepted, there is a need to develop more robust, cost-effective, and rapid assays that provide high confidence results and are easy to perform. Despite the wide variety of nucleic acid assays currently available, most require trade-offs among these features. An assay that would combine most or all of these features would be advantageous for a wide variety of applications. MOL-PCR combines all of these features, and has additional advantages, described below:
1. Ability to detect a broad range of target types
Multiplex ligation enables simultaneous detection of diverse genomic features and enables assays that target unique sequences (signatures), SNPs (Fig. 4B), indels, and some repeats, because MOL-PCR requires only that the gene-specific regions of the MOLigo pairs recognize a target and are successfully ligated. This increases the options for assay design and configuration. In contrast, multiplex PCR products captured onto beads or a microarray surface via a probe sequence, are not robust for SNP discrimination.
2. Low operational cost per molecular target
In MOL-PCR, unique reagents (MOLigo pairs) are unlabeled and inexpensive, driving down costs associated with setup of new assays, and reconfiguration of existing ones. For example, the same PCR primers (including thefluorescently labeled reverse primer) have been used in all optimization and test panels for this project.
3. Ease of multiplexing
MOL-PCR achieves higher-level multiplexing by performing detec-tion and amplification in separate steps. A pre-PCR ligation step per-forms the detection, followed by PCR with a pair of universal primers that serves only to amplify and label the products of the ligation step. During the development of the biothreat assay panel, greater than 10-plex assays were routinely re-configured for screening and testing MOLigo pairs. We have also tested a 27-plex assay that includes the three biothreat agents and three other common respiratory pathogens (S. aureus, S. pyogenes, S. pneumoniae,data not shown), and a 50-plex assay for the detection of plant pathogens (Mark et al., 2007).
4. Amenable for use with degraded samples
Given that the detection event in MOL-PCR is oligonucleotide ligation, gene-specific regions of MOLigo pairs are very short, requir-ing DNA targets of only 40–50 nucleotides, and allowing detection of DNA targets with abasic sites. This allows detection of degraded targets, which are common in environmental, forensic, and clinical samples (Potter, 2004). On the other hand, standard PCR methods (real time and multiplex PCR) require much longer DNA targets (∼100–250 nucleotides).
5. Ease of reconfiguration
MOLigo pairs include universal PCR primer sequences and use a set of universal tags for capture onto commercially available micro-spheres. Any new MOLigo pairs added to an existing assay incorporate a different tag sequence, but use the same PCR primer sequences and multiplex microsphere set, making inclusion of new targets straight-forward. We routinely add markers to existing assays, usually with
little effect on the performance of the other MOLigo pairs within the assay. For example, although each pathogen-specific panel of MOLigos wasfirst developed independently, their performance was unaffected after they were combined together to make the 13-plex Biothreat panel.
4.1. Advantages over multiplex PCR
MOL-PCR is more specific than multiplex PCR. While both PCR and MOL-PCR have the same base complementarity constraints for primer annealing, MOL-PCR has two additional constraints: MOLigo pairs must annealadjacentto each other on the target, and the basesfl ank-ing the ligation site must form canonical Watson–Crick base pairs.
MOL-PCR is not prone to an amplification bias like multiplex PCR is, because ligated MOLigo pairs are roughly the same length (∼100– 120 nucleotides). In contrast, multiplex PCR, such as that used for the detection of Foot and Mouth Disease Virus and related pathogens, where target sizes range from 95 to 349 nucleotides (Hindson et al., 2008), can have significant amplification bias.
Tag sequences on the MOL-PCR products can be chosen for maxi-mum performance, such as efficient hybridization to anti-tags and no cross reactivity with other sequences (Kaderali et al., 2003). Multiplex PCR tags are constrained by the natural sequence residing between the two primer-binding sites (Hindson et al., 2008; Wilson et al., 2005). Finally, MOL-PCR uses a universal primer pair, requiring only a single primer to befluorescently labeled. To achieve the same result,
multiplex PCR would require the same number of fluorescently
labeled primers as the number of targets, which would significantly increase the assay cost as the plex level increases.
4.2. Comparison to similar approaches
It is important to note that Illumina has a similar approach (Golden-Gate assay) (Fan et al., 2003). However, their assay includes additional steps (7–9), resulting in higher costs, more reagents used (DNA acti-vation reagents, DNA elution reagents), and significantly longer assay time (28 h), as compared to MOL-PCR.
Baner et al. (2007)have developed a multiplex assay for FMD, swine vesicular virus and vesicular stomatitis virus that uses padlock probes and a microarray detection platform that can be performed in less than 4 h. The assay chemistry is similar to our approach, but uses circular oligonucleotide ligation probes as opposed to linear probes. The microsphere array used in MOL-PCR offers easier assay reconfi g-uration than standard microarray-based approaches.
Perhaps the closest similarity of MOL-PCR is to the MLPA assay, which uses fragment sizing to discriminate amplified detection sig-nals from multiplex reactions (Schouten et al., 2002). There are three main differences between MOL-PCR and MLPA; a) MOL-PCR is per-formed in a single reaction mix and takes under 3 h to complete, whereas MLPA requires three steps—hybridization, ligation and PCR, which take about 20 h to complete. b) MOLigos are similar in length, which minimizes amplification bias, and c) MOL-PCR detection is by flow cytometry, as opposed to fragment sizing by electrophoresis. MLPA adapted to microsphere arrays (Dawson and Lundquist, 2006) uses the same detection platform as MOL-PCR, but is still more tedious to perform due to the number of steps in MLPA and the assay time.
sensitivity achieved by target amplification methods like multiplex PCR or TaqMan chemistry assays (Fox, 2007), while maintaining its simplicity and ease of probe design. These features, together with MOL-PCR's potential for high levels of multiplexing make this assay a powerful alternative for application to disease surveillance and diagnostics.
Acknowledgments
This work was supported by the Department of Homeland Security Science and Technology Directorate (award # HSHQDC-07-X-00907 to PSW); The National Flow Cytometry Resource (award # NIH RR001315); and LANL-Laboratory Directed Research and Develop-ment (award # DRX9HG to SG). The material in this paper represents the position of Deshpande et al., and not necessarily that of DHS.
References
Baner, J., Gyarmati, P., Yacoub, A., Hakhverdyan, M., Stenberg, J., Ericsson, O., Nilsson, M., Landegren, U., Belak, S., 2007. Microarray-based molecular detection of foot-and-mouth disease, vesicular stomatitis and swine vesicular disease viruses, using padlock probes. Journal of Virological Methods 143, 200–206.
Bergval, I.L., Vijzelaar, R.N.C.P., Dalla Costa, E.R., Schuitema, A.R.J., Oskam, L., Kritski, A.L., Klatser, P.R., Anthony, R.M., 2008. Development of multiplex assay for rapid char-acterization ofMycobacterium tuberculosis. Journal of Clinical Microbiology 46, 689–699.
Dawson, D.B., Lundquist, P. 2006. FlexMAP-MLPA identifies copy number changes in the NPC1 gene for four patients with Niemann–Pick type C. HGVS/HGNC Helsinki Meeting: May 31, 2006; Helsinki.
Fan, J.B., Oliphant, A., Shen, R., Kermani, B.G., Garcia, F., Gunderson, K.L., Hansen, M., Steemers, F., Butler, S.L., Deloukas, P., Galver, L., Hunt, S., Mcbride, C., Bibikova, M., Rubano, T., Chen, J., Wickham, E., Doucet, D., Chang, W., Campbell, D., Zhang, B., Kruglyak, S., Bentley, D., Haas, J., Rigault, P., Zhou, L., Stuelpnagel, J., Chee, M.S., 2003. Highly Parallel SNP Genotyping. Cold Spring Harbor Symposia on Quanti-tative Biology. Cold Spring Harbor Laboratory Press 68, 69–78.
Fox, J.D., 2007. Nucleic acid amplification tests for detection of respiratory viruses. Journal of Clinical Virology 40 (Suppl 1 S), 15–23.
Gans, J.D., Wolinsky, M., 2008. Improved assay-dependent searching of nucleic acid sequence databases. Nucleic Acids Research 36, e74.
Hindson, B.J., Reid, S.M., Baker, B.R., Ebert, K., Ferris, N.P., Bentley Tammero, L.F., Lenhoff, R.J., Naraghi-Arani, P., Vitalis, E.A., Slezak, T.R., Hullinger, P.J., King, D.P., 2008. Diagnostic evaluation of multiplex reverse transcription-PCR microsphere array
assay for detection of foot-and-mouth and look-alike disease viruses. Journal of Clinical Microbiology 46, 1081–1089.
Jalali, G.R., Vorstman, J.A., Errami, A., Vijzelaar, R., Biegel, J., Shaikh, T., Emanuel, B.S., 2008. Detailed analysis of 22q11.2 with a high density MLPA probe set. Human Mutation 29, 433–440.
Kaderali, L., Deshpande, A., Nolan, J.P., White, P.S., 2003. Primer-design for multiplex genotyping. Nucleic Acids Research 31, 1796–1802.
Kozlowski, P., Jasinska, A.J., Kwiatkowski, D.J., 2008. New applications and develop-ments in the use of multiplex ligation-dependent probe amplification. Electropho-resis 29, 4627–4636.
Lindler, L.E., Fan, W., Jahan, N., 2001. Detection of Ciprofloxacin-resistantYersinia pestis
byfluorogenic PCR using the Lightcycler. Journal of Clinical Microbiology 39, 3649–3655.
Mark, J.A., Green, L.D., Deshpande, A., White, P.S., 2007. System Integration and Development for Biological Warfare Agent Surveillance. Optics and Photonics in Global Homeland Security III. Defense and Security, Proceedings of SPIE. Potter, A.B., 2004. The genetic affinities of the prehistoric people of San Clemente Island,
California: an analysis of ancient DNA. University of Oregon Doctoral Thesis AAT 3136440, 1–168.
Price, L.B., Vogler, A., Pearson, T., Busch, J.D., Schupp, J.M., Keim, P., 2003. In Vitro selection and characterization ofBacillus anthracismutants with high-level resistance to Ciprofloxacin. Antimicrobial Agents and Chemotherapy 47, 2362–2365.
Reijans, M., Dingemans, G., Klaassen, C.H., Meis, J.F., Keijdener, J., Mulders, M., Eadie, K., van Leeuwen, W., van Belkum, A., Horrevorts, A.M., Simons, G., 2008. RespiFinder: a new multiparameter test to differentially identifyfifteen respiratory viruses. Journal of Clinical Microbiology 46, 1232–1240.
Schouten, J.P., McElgunn, C.J., Waaijer, R., Zwijnenburg, D., Diepvens, F., Pals, G., 2002. Relative quantification of 40 nucleic acid sequences by multiplex ligation-dependent probe amplification. Nucleic Acids Research 30, e57.
Sørensen, K.M., Andersen, P.S., Larsen, L.A., Schwartz, M., Schouten, J.P., Nygren, A.O.H., 2008. Multiplex ligation-dependent probe amplification technique for copy number analysis on small amounts of DNA material. Analytical Chemistry 80, 9363–9368. Svensson, K., Larsson, P., Johansson, D., Mona Byström, M., Forsman, M., Johansson, A.,
2005. Evolution of subspecies ofFrancisella tularensis. Journal of Bacteriology 187, 3903–3908.
Terefework, Z., Pham, C.L., Prosperi, A.C., Entius, M.M., Errami, A., van Spanning, R.J.M., Zaura, E., ten Cate, J.M., Crielaard, W., 2008. MLPA diagnostics of complex microbial communities: relative quantification of bacterial species in oral biofilms. Journal of Microbiological Methods 75, 558–565.
Valiant, L.G., Vazirani, V.V., 1986. NP is as easy as detecting unique solutions. Theoretical Computer Science 47, 85–93.
Vora, G.J., Meador, C.E., Stenger, D.A., Andreadis, J.D., 2004. Nucleic acid amplification strategies for DNA microarray-based pathogen detection. Applied and Environ-mental Microbiology 70, 3047–3054.