5
T
h
e
ore
tical
and
E
mp
ir
ical
Rese
arch
e
s i
n Ur
b
an Ma
na
ge
men
t
Vo
lu
me 7
Issue
2
/
Ma
y
2
0
1
2
DETAILED ANALYSIS OF
URBAN-ENVIRONMENTAL ASPECTS IN AN URBAN
LIFE QUALITY MODEL
Jesica B. ESPARZA
La Plata National University, La Plata C.P. 1900, Argentina
jesicaesparza@hotmail.com
Luciano DICROCE
La Plata National University, La Plata C.P. 1900, Argentina
dicroce_luciano@yahoo.com.ar
Irene MARTINI
La Plata National University, La Plata C.P. 1900, Argentina
irene_martini@yahoo.com.ar
Carlos A. DISCOLI
La Plata National University, La Plata C.P. 1900, Argentina
discoli@rocketmail.com
Abstract
The problems in both urban and environment are those that originate from the increase of urban growth and are the result of the deterioration of environmental conditions. As a place of population growth, commercial and industrial activity, cities concentrate energy and resources use and waste generation, to the point where both manmade and natural systems are overloaded and capacity to handle are overwhelmed. Therefore intends to develop a methodology to analyze the urban-environmental aspects in detailed scale and subsequent verification and justification in the different spatial scales of the city. This type of approach will enable the integration of information in each of the levels of study. The development of this research allows to verify and to substantiate homogeneous areas with different levels of vulnerability at different spatial scales of the city and detailed information and qualified at the time of making it possible to propose policies and actions for urban planning today.
Keywords:urban-environmental aspects – homogeneous areas of vulnerability.
1. INTRODUCTION
In the last years, different societal, economical and political changes that have occurred in the main
Latin American urban areas, and in particular in Argentina, have transformed the urban territory and
turned it into a disintegrated and degraded place to live in. In this sense, as an answer to this situation,
6
T
h
e
ore
tical
and
E
mp
ir
ical
Rese
arch
e
s i
n Ur
b
an Ma
na
ge
men
t
Vo
lu
me 7
Is
sue 2
/
Ma
y
2
0
1
2
transformation of these cities, avoiding social imbalance and providing life quality to their habitants. In
consequence, population´s needs, such as health, housing, education, recreation and safeties have to
be faced by the local governments. Therefore, it is important to count on different mechanisms which
allow recognizing habitant´s satisfaction and insatisfaction. Accordingly, it is necessary to establish a
conceptual and empirical methodology which allows identifying the social satisfaction and its inclusion in
the scope of public policies.
The population`s life quality (PLQ) is closely linked to the inhabitants` satisfaction, which is reflected into
the group of needs that must be covered by the government`s policies. (Leva, G. 2005). Thus, we believe that if the inhabitants’ basic needs are not satisfied, from the access to basic health, sanitation, recreation, etc., the population will be unsatisfied and in disadvantage. The balance between the
ecological, biological, economic, productive, socio-cultural, technological and aesthetic aspects
suggests the existence of a healthy habitat capable of meeting the needs which we have already
mentioned.
Understanding the urban-environmental relationship allows us to consider a number of components as
part of the city: air pollution and noise, water quality, sanitation, transport conditions, preservation of
green spaces, that is to say, thinking about the deteriorating conditions of life of its inhabitants.
(Metzger, 1996).
ULQ also depends on the relationship between specific urban groups (habitants / users) and
institutional-political system that combines territory and the activities which are carried out by people who are involved in urban metropolitan processes. Critical and “basic” variables, with a considerable influence on ULQ, are included on this relationship.
ULQ comprises three components:
The demand consists of two groups that represent objective people´s needs, housing or
population sectors characterized within a cultural context, and the subjective needs
represented by social preferences and personal wishes,
The supply comprises material and non- material resources that represent regional urban
properties and services, objective needs and symbolic resources,
The relationship between the above mentioned needs and the supply.
In consequence, this work presents the development of a methodology and a model gathering different
7
T
h
e
ore
tical
and
E
mp
ir
ical
Rese
arch
e
s i
n Ur
b
an Ma
na
ge
men
t
Vo
lu
me 7
Issue
2
/
Ma
y
2
0
1
2
of an evaluation methodology, which is synthesized in a model that interprets and integrates housing
and urban systems, critical resources, environment, urban life quality concepts and their territorial
localization.
The design of an Urban Life Quality Model (ULQM)1 has allowed to obtain the population Unsatisfied
Basic Needs (UBN) where the integration of the urban services (infrastructure and basic services), the
environmental aspects and the relationship between demand and supply allow to obtain quantitative
and qualitative data and its urban territorialisation.
This work was carried out on the basis of a multidimensional conceptual model. Its methodology has
been presented at scientific and academic meetings and projects (Rosenfeld, 2002).
The present analysis correspond to medium urban centers of different scales and consolidations, in
particular, La Plata city, capital of Buenos Aires province which was chosen as a model. This city has a
consolidated urban central area, and a suburb of low dwelling density, and its population is over
700.000 inhabitants. This study was designed to deepen into some operative and conceptual aspects
with the aim of improving several components of the model.
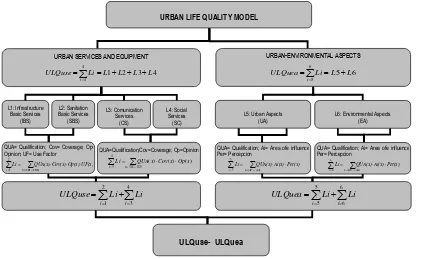
Urban Life Quality Model is structured from different components which are disaggregated in urban
services and equipment (ULQuse) and urban-environmental aspects (ULQuef). Each of them is
composed by different levels of integration, corresponding to: L1, infrastructure services; L2, sanitation
services; L3, communication services; L4, social services; L5, urban aspects and L6, environmental
aspects. This rank is analyzed from three dimensions: Qualification, Coverage / Influence Area and
Opinion / Perception (Figure 1). Unlike some other models (Leva, G., 2005) energetic and
environmental variables related to urban dynamics, urban-regional efficiency of services and
users/habitants opinion/perception are incorporated in the ULQM.
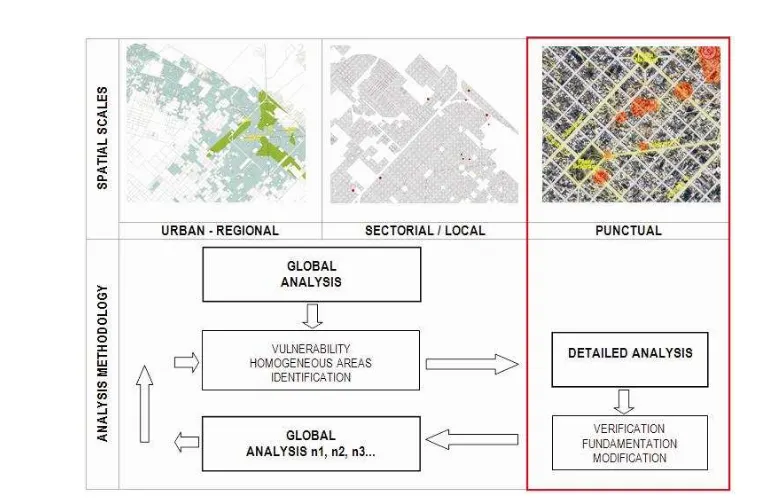
Different urban scales are defined in ULQM which allow incorporating several analysis levels. In this
sense, Urban, Sectorial, Local and Punctual scales can be studied simultaneously, taking into account
the complementarities between different analysis levels (Global, Particular and Detailed).
The city as a physical support includes different spatial scales (block, neighborhood, etc.) where several
urban consolidations (High, Medium and Low) can be studied. These spatial scales can be defined as:
1. Urban-Regional Level (urban areas integration and its variables); 2. Sectorial Level (high, medium
8
T
h
e
ore
tical
and
E
mp
ir
ical
Rese
arch
e
s i
n Ur
b
an Ma
na
ge
men
t
Vo
lu
me 7
Is
sue 2
/
Ma
y
2
0
1
2
and low areas classification); 3. Local Level (neighborhood and particular items); 4. Punctual Level
(specific locations).
URBAN LIFE QUALITY MODEL
URBAN SERVICES AND EQUIPMENT
4 3 2 1 4 1 L L L L Li ULQuse i URBAN-ENVIRONMENTAL ASPECTS 6 5 6 5 i L L Li ULQuea L1: Infrastructure Basic Services (IBS)
L5: Urban Aspects (UA) L2: Sanitation Basic Services (SBS) L3: Comunication Services (CS) L4: Social Services (SC)
L6: Environmental Aspects (EA)
QUA= Qualification; Cov= Coverage; Op= Opinion; UF= Use Factor
2
1 i x(SBISBS)
UF(x) Op(x) Cov(x) QUA(x) Li
4 3 2 1 i i Li Li ULQuse QUA=Qualification;Cov=Coverage; Op=Opinion ) ( 4 3 ) ( ) ( ) ( SS SC x i x Op x Cov x QUA LiQUA= Qualification; Ai= Area ofe influence; Per= Percepcion 5 5 i x(AUAA)
Per(x) Ai(x) QUA(x) Li
QUA= Qualification; Ai= Area ofe influence; Per= Percepcion 6 6 i x(AUAA)
Per(x) Ai(x) QUA(x) Li
6 6 5 5 i i Li Li ULQueaULQuse- ULQuea
FIGURE 1-ULQM METHODOLOGICAL AND CONCEPTUAL STRUCTURE.
Related to analysis levels, it is necessary to precise the scope of each one in order to understand their
complementarily: i. Global Analysis: urban components; ii. Particular Analysis: node / residential user
identified in a sector or network; iii. Detailed Analysis: particularity of each node from its specific
characteristics. The study of punctual scale from a detailed analysis is carried out in this work(Figure 2).
This work pretends to analyze urban-environmental aspects (See Figure 2) in a ULQM framework related to habitants “perception” variable. From a theoretical-methodological approach, environmental pathologies qualification, influence areas and habitants type of perception, are evaluated. As an
example, dumps and flood areas and air and sound pollution are exposed. Each pathology is developed
at a punctual scale from a detailed analysis.
The perception dimension is studied from different information tools. In consequence a survey was
developed, which allowed recognizing each pathology perception level related to the specific territory
localization where it was performed.
The urban-regional perception results were obtained from a previous work (Discoli, C., 2007). The study
of the pathologies at global analysis allowed recognizing representative criticality values and its
[image:4.595.35.462.157.416.2]9
T
h
e
ore
tical
and
E
mp
ir
ical
Rese
arch
e
s i
n Ur
b
an Ma
na
ge
men
t
Vo
lu
me 7
Issue
2
/
Ma
y
2
0
1
2
FIGURE 2-OUTLINE OF THE PROPOSED METHODOLOGY.IDENTIFICATION AND VERIFICATION OF URBAN-ENVIRONMENTAL PROBLEMS
2. DATA COLLECTION TOOLS FOR THE EVALUATION OF HABITANTS OPINION/PERCEPTION
To deepen into a methodological data collection tool for habitant’s opinion/perception evaluation, previous works were studied to analyze the systematization and normalization of the information.
(Esparza, J., 2008).
Opinion can be defined as the belief about a particular matter. In ULQM framework, urban and equipment services are measured from the real situation (users’ opinion). Unlike opinion, perception is a psychological process through senses which allow people to receive and to interpret their environment
information. In ULQM, urban-environmental aspects are analyzed in an intangible way which is
incorporated into one of the model dimensions. In this sense, different ways of perceiving the mentioned
pathologies are a significant participation into the model algorism and its final results.
Assessment tools led us recognize opinion/perception relevance into ULQM framework in its
geo-referred situation, where habitant’s territorial representation is recognized and measured. Qualification
and Coverage information which comes from data collecting tools are compared and verified in this
procedure.
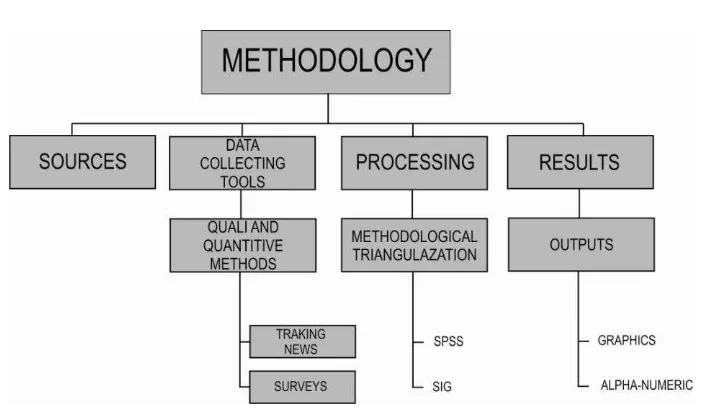
The Opinion/Perception model structure is graphically and conceptually synthesized in Figure 3.
Information sources, information data collecting tools, their processing and its possible results are
[image:5.595.147.529.92.341.2]10
T
h
e
ore
tical
and
E
mp
ir
ical
Rese
arch
e
s i
n Ur
b
an Ma
na
ge
men
t
Vo
lu
me 7
Is
sue 2
/
Ma
y
2
0
1
2
FIGURE 3-OPINION/PERCEPTION DATA COLLECTION TOOLS.METHODOLOGICAL STRUCTURE
During information processing, methodological triangulation is carried out. As every method, it presents
advantages and disadvantages in relation to the data collecting. This method led us study the same
phenomenon through different tools, where several aspects are studied at the same time.
Methodological triangulation as a research strategy, presents different characteristics. In this work,
several information sources, which generate quantify and non-quantify data, are presented.
The development and deepening of the presented data tools as collection sources led us recognize
different information utilities to measure the observed reality. Quality and quantity methods are
approached and analyzed from sample surveys.
3. DETAILED ANALYSIS OF THE URBAN-ENVIRONMENTAL ASPECTS PERCEPTION
In previous works (Discoli, 2007) graphic outputs were obtained from the urban-environmental aspects
of the ULQM at an urban-regional scale. These graphics outputs allowed us to recognize representative
homogeneous areas in relation to the convergence of the mentioned pathologies. The obtained results,
justifies the need of deepening in the detailed analysis of the punctual scale, where these pathologies
are identified in a detailed way.
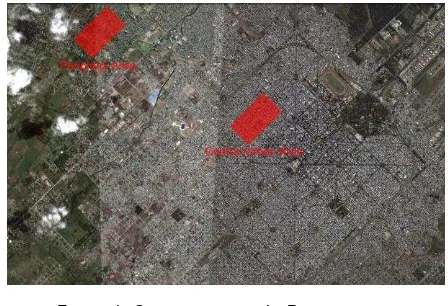
For this work, two areas from the surrounding of La Plata were identified. One, belonging to the Central
Urban Area (CUA) and the other to the Periphery Area (PA). In both areas, different pathologies
converge. (See Figure 4). A survey sample was developed to verify the problems which were
previously identified. The systematization of the obtained information was discriminated into: Very
Evident (VE), Evident (E), Little Evident (LE) and Do not Perceive (DP) and re-coded as: 0.1, 0.3, 0.5
[image:6.595.68.421.98.304.2]11
T
h
e
ore
tical
and
E
mp
ir
ical
Rese
arch
e
s i
n Ur
b
an Ma
na
ge
men
t
Vo
lu
me 7
Issue
2
/
Ma
y
2
0
1
2
An unbundled diagnosis of real urban situation was established and homogeneous areas maps were
presented from surveys results as an evaluation mechanism and as input to the model framework. Representative situations in the studied area related to habitants’ dissatisfaction were recognized. Of the 84 surveys, 44 belong to CUA and 45 to PA. Some surveyed variables are shown in Table 1.
FIGURE 4-STUDIED AREAS AT LA PLATA CITY
TABLE 1.SURVEYED VARIABLES FROM THE DETAILED ANALYSIS AT THE PUNCTUAL SCALE.
ADRESS OCCUPATION GENDER AGE OP_DUMPS OP_FLOOD A OP_AIR POLL OP_SOUND POLL
39 s bet 5s and 6s merchant female 35 0.5 0.3 1.0 1.0
39s bet 3s and 4s merchant male 65 1.0 0.5 0.3 1.0
3s and 41s merchant female 60 0.5 0.1 1.0 1.0
3s and 43s employee male 52 0.5 0.1 1.0 1.0
44s bet 6s and 7s employee male 34 0.5 0.3 0.5 0.5
Once the surveys are georreferenced, an interpolation method (GIS) (Arc View 9) is used to identify the
proximity between surveys results. Each territorialized point (survey) is incorporated, to be analyzed, by
this method, which calculates the value of that point depending on its neighboring point’s values. In this
sense, the determination of the point to interpolate will be higher as nearest to another point with similar
characteristics. (Dicroce, L., 2008). From the surveyed evaluation and its homogeneous areas
identification, this work presents the detailed analysis of the habitant’s perception at a punctual scale in:
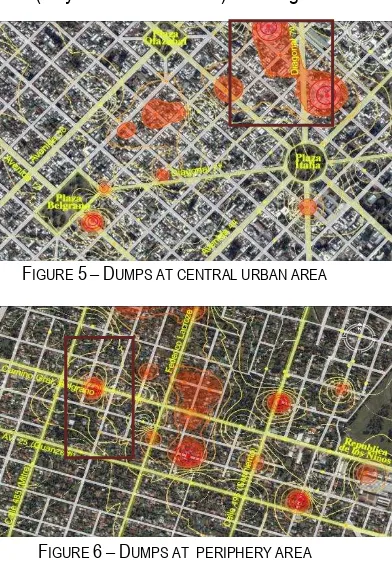
dumps and flood areas and air and sound pollution.
a. Dumps Areas
At an urban-regional level, the ULQM maps, in relation to the dumps areas allows to recognize the
affection areas, taking into account the constitutive classification of its volume and its presence in time.
In relation to the detailed analysis, it was observed that complaints about dumps existence (VE, E and
LE) are homogeneously distributed throughout the studied area, both the central urban and periphery
[image:7.595.246.470.192.345.2]12
T
h
e
ore
tical
and
E
mp
ir
ical
Rese
arch
e
s i
n Ur
b
an Ma
na
ge
men
t
Vo
lu
me 7
Is
sue 2
/
Ma
y
2
0
1
2
between 4 (four) street and 5 (five) street in central urban area and 490 street between 20 street and 21
street at periphery area. See Figures 5 and 6.
Obtained results in relation to graphics and numerical outputs led us distinguish that dumps existence is
recognized by the 45 % of respondents at urban center and periphery areas. Concerning VE, E and FE
perceptions at urban center area (those answers where dumps existence is recognized) only 15 % of
respondents is considering that is very evident. Unlike, at periphery area, that percentage rises to 23 %,
due to habitual garbage collection (only three time a week). See Figures 7 and 8.
FIGURE 5–DUMPS AT CENTRAL URBAN AREA
FIGURE 6–DUMPS AT PERIPHERY AREA
Concerning dumps existence perceptions in both city areas, the answers were referred to garbage
accumulation related to visual pollution, with 50 % of results bellowing to central urban area and 75 % at
periphery area. Moreover, garbage collection company performance and sweepers workers were
considerate as the causes of accumulation garbage by the responders. See Figures 9 and 10.
3
9
8
24
DUMPS
Very Evident Evident Little Evident Do not perceive
[image:8.595.156.352.244.532.2] [image:8.595.144.347.607.731.2]13
T
h
e
ore
tical
and
E
mp
ir
ical
Rese
arch
e
s i
n Ur
b
an Ma
na
ge
men
t
Vo
lu
me 7
Issue
2
/
Ma
y
2
0
1
2
5
13
4
23
DUMPS
Very evident Evident Little Evident Do not perceive
FIGURE 8-DUMPS PERCEPTION AT PERIPHERY AREAS
15
3
2
PERCEPTION
Visual Smell Others
FIGURE 9-DETAILED ANALYSIS IN DUMPS AREAS AT CENTRAL URBAN AREA
11 11
PERCEPTION
Visual Others
FIGURE 10-DETAILED ANALYSIS IN DUMPS AREAS AT PERIPHERY AREA
It must be pointed out that this rate of affection is not perceived by a considerable number of
responders, probably because of the habituallity of living en a degraded environmental.
b. Flood areas
To evaluate flood areas at urban-regional level, results were identified from water risk maps (CISAUA,
2006).
In the detailed analysis at local level, we can observe that the unfavorable perception results, as well as
in dumps areas, they are homogeneously distributed throughout the studied area, with small
14
T
h
e
ore
tical
and
E
mp
ir
ical
Rese
arch
e
s i
n Ur
b
an Ma
na
ge
men
t
Vo
lu
me 7
Is
sue 2
/
Ma
y
2
0
1
2
77 diagonal. In periphery area, we can visualize them on General Belgrano road, 485 street and 25
avenue. (See figures 11 and 12).
FIGURE 11-FLOOD AREAS AT CENTRAL URBAN AREA
FIGURE 12-FLOOD AREAS AT PERIPHERY AREA
In both studied areas, we can observe that the 45 % of respondents recognize the existence of flood
areas. In central urban area, a “Very Evident” perception reaches 24 %, while in periphery area it
increases to 32 %. This problem affection is not perceived by a considerable number of responders,
although problems actually exist. See Figures 13 and 14.
In central urban area, flood is the result of the bad functioning of the drainage system for waste
acumulation in public places. It must be pointed out that the converse of the two patologies (dumps and
flood areas) are identified. mIn periphery area, many habitants think that flood areas are related to
streams mainterance and stormwater infraestructure (ditches, gutters and storms drains). See Figures
15 and 16.
In this sense, the origin of each problem in every studied area is recognized by pathologies congruence
and their territorial location. While, failure in drainage system is an urban problem (at high
15
T
h
e
ore
tical
and
E
mp
ir
ical
Rese
arch
e
s i
n Ur
b
an Ma
na
ge
men
t
Vo
lu
me 7
Issue
2
/
Ma
y
2
0
1
2
5
11
5
23 FLOOD AREAS
Very Evident Evident Little Evident Do not perceive
FIGURE 13-FLOOD AREAS PERCEPTION AT CENTRAL URBAN AREA PERIPHERY
7
9
6
23 FLOOD AREAS
Very Evident Evident Little Evident Do not perceive
FIGURE 14-FLOOD AREAS PERCEPTION AT PERIPHERY AREA
17
4
PERCEPTION
Stormwater infras Overcrowding
FIGURE 15-DETAILED ANALYSIS IN flood AREAS AT CENTRAL URBAN AREA
14
5
3 PERCEPTION Maint of streams Stormwater infras Others
FIGURE 16-DETAILED ANALYSIS IN FLOOD AREAS AT PERIPHERY AREA
c. Air Pollution
To evaluate air pollution at an urban-regional level, PM2,5 particles emissions in transport fuel
16
T
h
e
ore
tical
and
E
mp
ir
ical
Rese
arch
e
s i
n Ur
b
an Ma
na
ge
men
t
Vo
lu
me 7
Is
sue 2
/
Ma
y
2
0
1
2
emissions from industrial sector are located in our studied area. This information, led us recognize the
affection homogeneous areas. (Discoli, C., 2007).
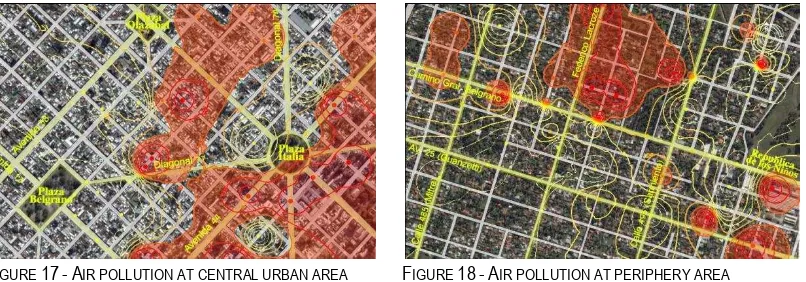
In the detailed analysis at punctual scale, the results in relation to air pollution were identified on main
roads and access in both studied areas (central urban and periphery areas). This pathology is
manifested through smell and fine dust which were found throughout the studied area. See Figures 17
and 18.
FIGURE 17-AIR POLLUTION AT CENTRAL URBAN AREA FIGURE 18-AIR POLLUTION AT PERIPHERY AREA
At central urban area, air pollution was detected by the 61, 4 % of surveyed habitants, which 27, 3 % declared “Very evident”. Unlike, the periphery area, this pathology was detected by the 58 % of surveyed habitants, where the 22, 2 % of those responses were “Very Evident”.
On the other hand, a low percentage of the surveyed people do not perceive any pollution, probably due
to people habituation of the place where they live. See Figures 19, 20, 21 and 22.
Graphic outputs as well as perceptual results of air pollution show certain similarity in both urban areas
in relation to the distribution and the perception source (smell and fine dust).
At central urban area, this pathology is perceived by the transport and industrial emissions (YPF
Industry which is near from the studied area) and at the periphery area, it is perceived by the sewer and
service station area. Dust scattering due to building materials from the studied area are perceived in a
lower percentage.
12
9
6
17 AIR POLLUTION
Very Evident Evident Little Evident Do not perceive
[image:12.595.47.450.236.377.2]17
T
h
e
ore
tical
and
E
mp
ir
ical
Rese
arch
e
s i
n Ur
b
an Ma
na
ge
men
t
Vo
lu
me 7
Issue
2
/
Ma
y
2
0
1
2
10
8 8
19
AIR POLLUTION
Very Evident Evident Little Evident Do not perceive
FIGURE 20-AIR POLLUTION PERCEPTION AT PERIPHERY AREA
18
7
2
PERCEPTION
Smell Dust Others
FIGURE 21-DETAILED ANALYSIS IN AIR POLLUTION AT CENTRAL URBAN AREA
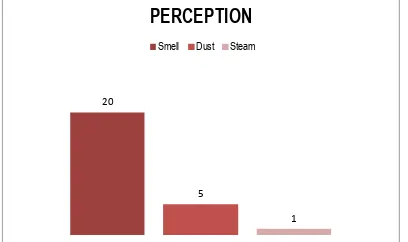
20
5
1
PERCEPTION
Smell Dust Steam
FIGURE 22-DETAILED ANALYSIS IN AIR POLLUTION AT PERIPHERY AREA
d. Sound Pollution
To evaluate urban-regional sound pollution, the main sound sources and its affection level were studied.
Maximun levels, both from the night and the day, were obtained from local ordinances (Ordinance
Number 39.025/83, 1983 and Number 7845/91, 1991).
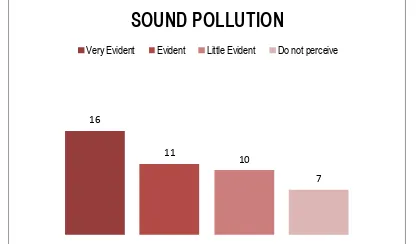
In both studied areas at punctual scale analysis, the results have demostrated that complaints are on
main roads. The highest percentage is on central urban area, more precisely on Italia Square and in the
commercial area between 74 Diagonal and 7 and 13 avenues. On the other hand, the percentage on
sound pollution at periphery area was lower, although it is also perceived on main roads as General
Belgrano Road and 25 Avenue. While at central urban area the percentage of surveyed people rises to
[image:13.595.148.541.80.535.2] [image:13.595.251.455.395.516.2]18
T
h
e
ore
tical
and
E
mp
ir
ical
Rese
arch
e
s i
n Ur
b
an Ma
na
ge
men
t
Vo
lu
me 7
Is
sue 2
/
Ma
y
2
0
1
2
FIGURE 23–SOUND POLLUTION AT CENTRAL URBAN AREA
FIGURE 24-SOUND POLLUTION AT PERIPHERY AREA
Unlike the rest of the variables (dumps and flood areas and air pollution), in this pathology we can find
the largest number of complaints. For example, at central urban area, only the 16 % of surveyed people
do not recognize the existence of this pathology. See Figures 25 and 26.
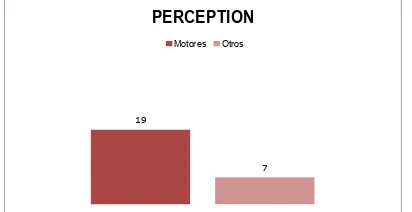
In both studied areas, most of the complaints are related to horns and engines vehicles. At central
urban area, in addition to described complaints, we can mention those related to pubs noise and public
administration buildings which convoke a lot of people. See Figures 27 and 28.
16
11
10
7
SOUND POLLUTION
Very Evident Evident Little Evident Do not perceive
[image:14.595.139.366.276.438.2] [image:14.595.140.348.573.695.2]19
T
h
e
ore
tical
and
E
mp
ir
ical
Rese
arch
e
s i
n Ur
b
an Ma
na
ge
men
t
Vo
lu
me 7
Issue
2
/
Ma
y
2
0
1
2
12
7 7
19
SOUND POLLUTION
Very Evident Evident Little Evident Do not perceive
FIGURE26-SOUND POLLUTION PERCEPTION AT PERIPHERY AREA
26
5
3 2
PERCEPCION Transport Music Voices Others
FIGURE 27-SOUND POLLUTION DETAILED ANALYSIS AT CENTRAL URBAN AREA
19
7
PERCEPTION
Motores Otros
FIGURE 28-SOUND POLLUTION ANALYSIS AT PERIPHERY AREA
4. CONCLUSIONS
The deepening in the analysis of the ULQM in different spatial scales of the city (urban-regional to
punctual) from urban-environmental model aspects evaluation led us quantify and qualify the results
with an acceptable approximation from an observed reality. This methodology brings us the elements
and information to evaluate the variables involved in the ULQM.
ULQM indexes with geographical localization at a regional and global analysis allow the quantitative
evaluation of people basic needs. The incorporation of model dimensions which represent real life
components allow us to analyze and evaluate the real situation and to consider possible actions to
urban planning.
GIS output maps at punctual scale allowed us to recognize their environmental problems causes and
[image:15.595.250.456.382.488.2]20
T
h
e
ore
tical
and
E
mp
ir
ical
Rese
arch
e
s i
n Ur
b
an Ma
na
ge
men
t
Vo
lu
me 7
Is
sue 2
/
Ma
y
2
0
1
2
Unlike urban-regional study, where ULQM indexes have allowed identifying homogeneous areas with
convergent pathologies, punctual analysis perception is presented as a measurable tool. Perception
detailed study led us to recognize and deepen, more specificity, those analyzed variables which were
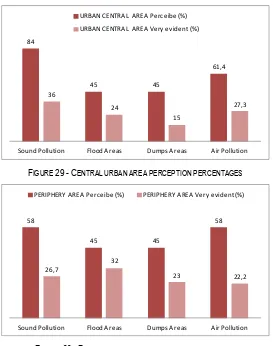
not identified at urban-regional scale. Main pollution sources and their territorial location are identified
from this mentioned analysis. See Figures 29 and 30.
84
45 45
61,4
36
24
15
27,3
Sound Pollution Flood Areas Dumps Areas Air Pollution
URBAN CENTRAL AREA Perceibe (%)
URBAN CENTRAL AREA Very evident (%)
FIGURE 29-CENTRAL URBAN AREA PERCEPTION PERCENTAGES
58
45 45
58
26,7
32
23 22,2
Sound Pollution Flood Areas Dumps Areas Air Pollution
PERIPHERY AREA Perceibe (%) PERIPHERY AREA Very evident (%)
FIGURE 30-PERYPHERY AREA PERCEPTION PERCENTAGES
Worth mentioning that the development of a methodology which is based on the urban-environmental
detailed analysis, allows to work with updated information, and therefore, with a greater degree of
approximation related to observed reality. This allows to redefine the identified areas and to reassign
new values to the analyzed variables.
REFERENCES
Código de Prevención de la Contaminación Ambiental (1983). Boletín Municipal de la Ciudad de
Buenos Aires. Buenos Aires. Retrieved from
[image:16.595.108.382.210.556.2]21
T
h
e
ore
tical
and
E
mp
ir
ical
Rese
arch
e
s i
n Ur
b
an Ma
na
ge
men
t
Vo
lu
me 7
Issue
2
/
Ma
y
2
0
1
2
Delgado de Bravo M. T. (1998). Propuesta de medición de la calidad de vida urbana como objetivo de
planificación y gestión local. In IV Seminario Latinoamericano de Calidad de Vida Urbana: La
calidad de vida en las ciudades intermedias latinoamericanas. Retrieved from http://www.perfilciutat.net/fitxers/IVSL_A9.pdf
Dicroce L., Discoli C., Martini I., Rosenfeld E., Esparza J. (2008). Implementación de un Modelo de Calidad de Vida Urbana (MCVU). Caso de estudio: Chivilcoy. Avances en Energías Renovables y
Medio Ambiente, 12 (1), pp. 179 - 186.
Discoli, C.; San Juan, G., Rosenfeld, E., Martini, I., Barbero, D., Ferreyro, C.,Ramírez Casas, J.; Dicroce L.; Domínguez, C. (2005). Niveles de calidad de vida urbana y el estado de necesidades básicas en servicios e infraestructura. Avances en energías renovables y medio ambiente, 9 (1), pp. 7-13.
Discoli, C.; San Juan G.; Martini, I.; Dicroce, L.; Melchiori, M.; Rosenfeld, E.; Ferreyro, C. (2007). Modelo de calidad de vida urbana (MCVU). Estudio de la calidad de los aspectos urbano-ambientales. Avances en Energías Renovables y Medio Ambiente,11 (1), pp. 57 - 64.
Discoli, C. (2010). Urban Life Quality Model. Systematic and modeling of urban-environmental systems
applied to different scales of the city, La Plata National University. Retrieved from
http://www.fau.unlp.edu.ar/index.php/content/html/65
Hurtado M. A.; Jiménez J. E.; Cabral M. G. (2006). Análisis ambiental del partido de La Plata. Aportes
al Ordenamiento Territorial. Buenos Aires : Consejo Federal de Inversiones.
Leva, G. (2005). Indicadores de Calidad de Vida Urbana. Teoría y metodología. Quilmes: Quilmes National University.
Metzger, P. (1996). Medio ambiente urbano y riesgos elementos de reflexión. Red de Estudios Sociales en Prevención de Desastres en América Latina. Lima, Perú
Rosenfeld E., San Juan G., Discoli C. (2000). Índice de calidad de vida urbana para una gestión territorial sustentable. Revista Avances en energías renovables y medio ambiente. Revista de la
Asociación Argentina de Energías Renovables y Ambiente, 4 (2), pp. 35-38.