www.medigraphic.com
ORIGINAL ARTICLE
Rev
ista
Lat
inoamer
icana
de
MICROBIOLOGÍA
MICROBIOLOGÍA
Kinetic analysis of nutrient stimulated H
+
efflux by
PM-ATPase of
Candida albicans
Bushra Rashid,* Nikhat Manzoor,* Luqman A. Khan*
* Enzyme kinetics lab, Department of Biosciences, Jamia Millia Islamia, New Delhi-110025. India.
First version received: December 19, 2006; first version revised: July 5, 2007; second version received in revised form: August 29, 2007; second version revised: December 27, 2007 and January 11, 2008; accepted: January 21, 2008.
Vol. 49, Nos. 3-4 July - September. 2007 October - December. 2007 pp. 55 - 59
ABSTRACT. Rate of H+ efflux and its stimulation by
nutrients/ana-logs have been quantified in cells and spheroplasts of Candida al-bicans. In the absence of any nutrient, yeast cells showed an aver-age H+ efflux rate of 22.3 nmoles/min/mg yeast cells. Addition of
5mM Glucose to the medium resulted in striking stimulation of H+
efflux by 7.5 fold. Supplementation of medium with 2-deoxy-D-glucose, Arginine & Glutamic acid lead to a minimal stimulation of 1.37, 1.50 & 1.42 fold, respectively, over control. Xylose, Lysine and Proline were non-effective. Control Spheroplasts had an H+
ef-flux rate of 2.0 nmoles/min/mg yeast cells. Glucose stimulation of H+ efflux was markedly reduced (2.22 fold). H+ efflux did not
sig-nificantly differ from control following supplementation of sphero-plasts with either analogs of glucose (2-deoxy-D-glucose, xylose) or amino acids (Arginine, Lysine, Proline, Glutamate). These re-sults have been compared with effect of nutrient/analogs on ATP hydrolytic cycle of isolated PM-ATPase reported earlier by this lab. Percentage of enzyme population going over to E.ADP.P complex stage following mixing with glucose and glutamate (94% & 96%, respectively) is comparable to Control (100%). Mixing of PM-AT-Pase with ATP in the presence of other nutrients/analogs leads to very significant reduction in population of E.ADP.P. Proportion of E.ADP.P complex which completes formation and dissociation of E~P complex (Power-Stroke) is similar to control in the presence of all nutrients/analogs except for glucose. Population of PM-ATPase molecule completing full ATP hydrolytic cycle is highest in pres-ence of glucose (86.4%). This figure is only 27% for control, 27.8% for glutamate, and is significantly less in presence of other nutrients/analogs (ranging from 4.2% for Lysine to 20.5% for Xy-lose). Glucose positively affects both legs of hydrolytic cycle, while other nutrients/analogs negatively effect first leg of cycle and are neutral with respect to second leg. Exceptional Glucose stimulation of H+ efflux by Candida cells can therefore be correlated with the
stimulation of second leg of the ATP hydrolytic cycle.
Key words: Candida albicans, H+- efflux, H+- ATPase, stopped
flow, spheroplasts.
RESUMEN. En este trabajo se presenta el efecto cuantitativo de la adi-ción de nutrientes/análogos en la tasa de eflujo de H+ en células y
esfe-roplastos de Candida albicans. En ausencia de cualquier nutriente, las células de levadura presentan un eflujo promedio de H+ de 22.3
nmo-les/min/mg de células. La adición de glucosa 5mM al medio estimuló el eflujo de H+ en 7.5 veces. Al suplementar el medio con
2-deoxi-D-glucosa, arginina o ácido glutámico se ocasionó una mínima estimula-ción de 1.37, 1.50 ó 1.42 veces, respectivamente, sobre el control. La adición de xilosa, lisina y prolina careció completamente de efecto. Los esferoplastos control presentaron una tasa de eflujo de H+ de 2.0
nmoles/min/mg de células. La estimulación del eflujo de H+ por
glu-cosa resultó notablemente reducida (2.22 veces). El eflujo de H+ no
difirió notablemente respecto al control al suplementar los esferoplas-tos con análogos de glucosa (2-deoxi-D-glucosa, xilosa) o aminoáci-dos (arginina, lisina, prolina, glutamato). Estos resultaaminoáci-dos han sido comparados con el efecto de la adición de nutrientes/análogos en el ci-clo hidrolítico del ATP de la PM-ATPasa reportada con anterioridad por este laboratorio. El porcentaje relativo de la enzima comprometida en la forma de E.ADP.P posterior a la adición de glucosa o glutamato (94 y 96%, respectivamente) es comparable con el control (100%). Al mezclar PM-ATPasa con ATP en presencia de otros nutrientes/análo-gos condujo a la reducción significativa de la forma E.ADP.P en la población. La proporción del complejo E.ADP.P, el cual completa la formación y disociación del complejo E~P (Power-Stroke) es similar al control en presencia de todos los nutrientes/análogos excepto para glu-cosa. La población de moléculas de PM-ATPasa que culminan el ciclo hidrolítico completo de ATP es mayor en presencia de glucosa (86.4%), comparado con el control (27%), con la adición de glutama-to (27.8%) y con la de otros nutrientes/análogos (4.2% a 20.5%). La adición de glucosa afecta positivamente ambas vertientes del ciclo hi-drolítico, mientras que otros nutrientes/análogos sólo afectan la prime-ra vertiente del ciclo siendo neutprime-rales con la segunda. La excepcional estimulación del eflujo de H+ por glucosa en células de Candida
pue-de por lo tanto correlacionarse con la estimulación pue-de la segunda ver-tiente del ciclo hidrolítico del ATP.
Palabras clave: Candida albicans, eflujo de H+, H+- ATPasa, flujo
detenido, esferoplastos.
INTRODUCTION
The plasma membrane ATPase (PM-ATPase) of the op-portunistic pathogen Candida albicans generates electro-chemical gradient of protons that drives the active trans-port of nutrients by H+- symport.1 ATP hydrolytic activity
and H+-extrusion are regulated by some nutrients, most
glu-www.medigraphic.com
cose metabolism results from its combined effect on the Km, Vmax, optimum pH and vanadate binding state of this enzyme. The fact that H+-accumulation is stimulalated to
a higher degree by glucose suggests that H+-pumping can
be regulated independently of ATP hydrolysis. Glucose may alter the H+-/ATP stoichiometry of the plasma
mem-brane H+-ATPase or promote coupling of ATP hydrolysis
to H+-translocation. The initial rate of H+-translocation
suggests that the glucose activated H+-ATPase
translo-cates more H+ per ATP consumed than the enzyme isolated
from the glucose-deprived cells.3 In other studies it has
been found that glucose triggers transcriptional and post transcriptional mechanisms that increase the level and ac-tivity of S. cereviseae plasma membrane H+-ATPase. It is
proposed that glucose triggers degradation of an inhibito-ry protein resulting in enzyme activation.4 Molecular
mechanism of the stimulation is not known but it appears to be based on elimination of an inhibitory interaction of the C-terminus with the active site of the enzyme.5,6
Pre-steady state kinetic studies suggest a four step kinetic scheme of ATP hydrolysis for Candida albicans PM-H+
-ATPase.7 Step-1 is binding of ATP to the enzyme, whereas
Step-2 is conversion of E·ATP complex to E-P·ADP com-plex, both of these steps lead to a release of 1H+ each.
Steps-3 and Step-4 depict release of ADP from E-P·ADP complex and dissociation of E-P complex, respectively. Last two steps lead to absorption of 1H+ each. The scheme
for hydrolytic cycle of PM-ATPase is given below: Earlier results from this lab have shown that Glucose, glutamic acid, lysine, arginine and proline and two analogs of glucose: 2-deoxy D-glucose and xylose affect pre-steady state kinetics of ATP hydrolysis.8 In the present study we
have quantified H+ efflux by cells and spheroplasts of
Can-dida in the presence of glucose, its two analogs and four amino acids. Results obtained have been correlated with the effect of these nutrients/analogs on the pre-steady state ki-netics of ATP hydrolysis by PM-ATPase.
MATERIALS AND METHODS
All biochemicals and enzymes were obtained from Sig-ma Chemical, USA whereas all inorganic chemicals were of analytical grade and were procured from E. Merck (India).
Yeast and Cultivation
Stock cultures of Candida albicans (ATCC 10261) were maintained on slants of nutrient agar (yeast extract 1%, peptone 2%, D-glucose 2% and agar 2.5%) at 4ºC. To initiate growth for experimental purposes, one loop full of cells from an agar culture were inoculated into a 25 ml of YEPD nutrient medium and incubated at 30ºC for 24 h i.e. up to stationary phase (primary culture). The cells from primary culture (108 cells ml-1) were reinoculated into 100
ml fresh YEPD medium and grown for 8-10 h i.e., upto mid-log phase (106 cells ml-1).
Proton extrusion measurements
Mid-log phase cells harvested from YEPD medium were washed twice with distilled water and routinely 100 mg cells were suspended in 5ml solution containing 0.1 M KCl and 0.1 mM CaCl2. Suspension was kept in a double-jacketed glass container with constant stirring. The con-tainer was connected to a water circulator at 25ºC. H+
ex-trusion rate was calculated from the volume of 0.01 N
www.medigraphic.com
NaOH consumed in automatic titration at pH-stat mode of the Autotitrimeter (Radiometer, Denmark) over a period of 10 min.9 Increments and rate of delivery of titrant was
ad-justed according to demand of the experiments and were routinely 100µl and 40ml/min. Initial pH was adjusted to 7.0 using 0.01 N HCl/NaOH.
ATP determination
Concentration of ATP was determined by measuring the decrease in absorbance at 340 nm that results when NADH is oxidized to NAD+ in the following enzyme
cou-pled system consisting of glyceraldehydes-3-phosphate dehydrogenase and phosphoglycerate kinase. The mid-log phase cells (100 mg) were washed twice with distilled wa-ter and suspended in 10ml solution containing 0.1 M KCl and 0.1 mM CaCl2 (control). For the effect of glucose, cells were suspended in solution containing 5 mM glucose in addition to 0.1 M KCl and 0.1 mM CaCl2. Cells were in-cubated for 10 min and centrifuged at 5000 rpm for 5 min in cold. The pellet was extracted with 0.6 ml of 2 M HClO4 for 5 min in cold and centrifuged for 5 min at 1500 g. The supernatant thus obtained was neutralized with a mixture of 0.6 ml of 1.8 M KOH and 0.4 M KHCO3 in cold. After 5 min it was centrifuged again and supernatant was used for ATP determination. For ATP estimation of spheroplast, both in absence and presence of glucose, same incubation mixture was used except that it contained in addition 0.6 M sorbitol (control) or 5 mM glucose + 0.6 M sorbitol (Test). After incubation spheroplasts were lysed by addi-tion of 1.2 ml distilled water and centrifuged at 5,000 rpm in cold and supernatant thus obtained was used for ATP
es-timation. Care was taken that time elapsed between end of incubation and estimation was same in all cases.
RESULTS
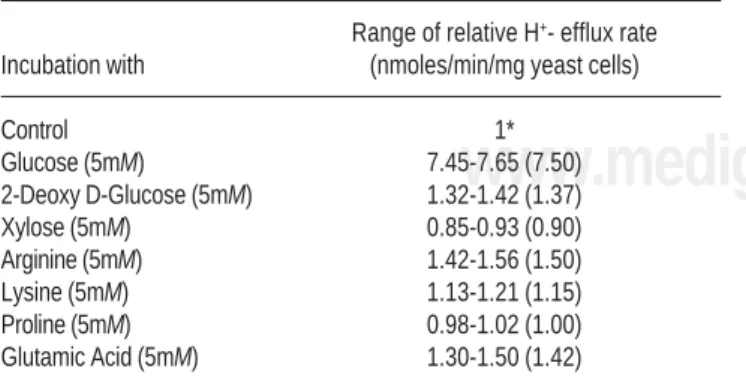
Table 1 gives the effect of nutrients/analogs on the rate of H+- efflux by Candida albicans cells measured through
pH stat assay. Control (without nutrients/analogs) had an average H+ efflux rate of 22.3 nmoles/min/mg yeast cells.
Cells show a striking stimulation of 7.5 fold when 5mM glucose is added to the incubation medium. Exposure of cells to 2-deoxy-D-glucose, Arginine and Glutamic acid gave minor stimulation of 1.37, 1.50 and 1.42 fold, respec-tively, over control. H+ efflux in the presence of 5 mM
Xy-lose, Lysine and Proline did not show significant varia-tion with control.
Table 2 gives the effect of nutrients/analogs on the rate of H+- efflux by Candida albicans spheroplasts. The
con-trol spheroplasts had an H+ efflux rate of 2.0 nmoles/min/
mg yeast cells. In the context of spheroplasts, mg yeast cells means spheroplasts derived from 1 mg yeast cells. Spheroplasts in general showed very less H+- efflux as
compared to cells. Stimulation by glucose is found to be minimal (2.22 fold) over control. H+- efflux by
sphero-plasts in presence of other nutrients/analogs did not show much variation with control spheroplasts.
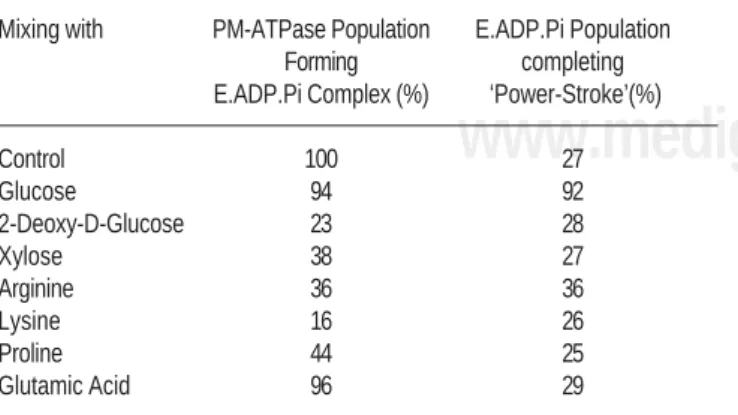
Table 3 shows population of PM-ATPase which goes on to form E.ADP.P complex in the ATP hydrolytic cycle by releasing H+.8 A very high percentage of enzyme
mole-cules complete first leg of cycle and form E.ADP.P com-plex in the presence of glucose (94%) and glutamate (96%) as compared to control (100%). Analogs of glucose
Table 1. Effect of nutrients on the rate of H+- efflux by Candida cells at pH 7.0. Control means cells were present in 0.1 mM CaCl2 and 0.1 M KCl at 25°C.
Range of relative H+- efflux rate
Incubation with (nmoles/min/mg yeast cells)
Control 1*
Glucose (5mM) 7.45-7.65 (7.50)
2-Deoxy D-Glucose (5mM) 1.32-1.42 (1.37)
Xylose (5mM) 0.85-0.93 (0.90)
Arginine (5mM) 1.42-1.56 (1.50)
Lysine (5mM) 1.13-1.21 (1.15)
Proline (5mM) 0.98-1.02 (1.00)
Glutamic Acid (5mM) 1.30-1.50 (1.42)
The control had an average (of four independent recordings) proton efflux rate of 22.3 nmoles/min/mg yeast cells. Rests of the records are for 4-6 experiments. Values in parenthesis are average.
Table 2. Effect of nutrients on the rate of H+- efflux by Candida sphero-plasts at pH 7.0. Control means cells were present in 0.1 mM CaCl2 and 0.1 M KCl at 25°C.
Incubation with Range of relative H+- efflux rate
(nmoles/min/mg yeast cells)
Control 1*
Glucose (5mM) 2.20-2.25 (2.22)
2-Deoxy D-Glucose (5mM) 1.32-1.38 (1.36)
Xylose (5mM) 1.20-1.28 (1.25)
Arginine (5mM) 1.12-1.18 (1.15)
Lysine (5mM) 1.28-1.32 (1.30)
Proline (5mM) 1.23-1.63 (1.27)
Glutamic Acid (5mM) 0.95-1.05 (1.00)
www.medigraphic.com
(2-deoxy-D-glucose and xylose) and rest of the amino ac-ids (Arginine, Lysine and Proline) greatly reduced the pop-ulation of enzyme molecules forming E.ADP.P complex by affecting the first leg of hydrolytic cycle. Population of E.ADP.P complex which absorbs H+ and complete second
leg of cycle by undertaking formation and dissociation of E~P (or ‘Power-Stroke’ analogous to myosin-ATPase) for control is 27%. Population undergoing power-stroke is al-most same in the presence of all nutrients and analogs, ex-cept for glucose. Only glucose had a high Power-stroke population of 92%. Table 4 lists the population of enzyme molecules, which complete full hydrolytic cycle of ATP. This population is 27.0% for control and 27.8 for glutamate. Significantly less population of enzyme mole-cules complete full ATP hydrolytic cycle in the presence of analogs of glucose (2-deoxy-D-glucose: 06.4%, Xy-lose: 20.5 %) and other aminoacids (Arginine: 12.9%, Lysine: 04.2%, Proline: 11.0%). In the presence of glu-cose, exceptionally high population of enzyme molecules, 86.4% complete full ATP hydrolytic cycle.
DISCUSSION
ATP hydrolytic cycle of PM-ATPase consists of two distinct phases.7,8 A H+ release phase consisting of ATP
binding and translocation of terminal phosphate residue leading to formation of E.ADP.P complex, and a H+
ab-sorption phase consisting of formation and dissociation of E~P complex. Population of enzyme forming E.ADP.P complex is significantly less in the presence of nutrients/ analogs, except for glucose and glutamate. This suggests direct interaction of these compounds with ATPase. Table
1 & Table 2 however, does not show corresponding de-crease in H+ efflux by yeast cells or spheroplasts in the
presence of these compounds. This clearly shows that in intact cells the portion of PM-ATPase exposed to extra-celluar environment does not interact with any of the test-ed nutrients/analogs. Small stimulation shown by nutri-ents, else than glucose, may be attributed to non-specific causes. Up to 80% of H+- efflux was abolished in the
pres-ence of 50µg/ml diethylstilbestrol a specific inhibitors of PM-ATPase.10 This indicates that the extruded H+ also
comes from sources other than PM-ATPase activity. Muta-tion studies have shown that nutrient induced H+- efflux
may not solely come from PM-ATPase activity.10 The
facts that, strikingly low stimulation of H+- efflux by
glu-cose is observed in the case of spheroplasts and that there is near equal H+- efflux rates by cells and spheroplasts in
presence of nutrients/analogs else than glucose indicate that minor stimulation of H+- efflux shown by nutrients/
analogs other than glucose may not be via PM-ATPase. Profound effect of nutrient/analogs else than glucose and glutamate on Reaction cycle of ATP hydrolysis may be a regulatory mechanism as high concentration of nutrients inside the cell indicates that cell need not import any more, so the high H+-gradient requirement is not required.
High turnover shown by glucose and glutamate in the formation of E.ADP.P complex indicates that these two com-pounds do not inhibit ATP binding or phosphate transloca-tion. In the absence of any nutrient (control) only 27% E.ADP.P complex undertakes power-stroke. In the presence of analogs of glucose and amino acids almost a similar percentage, ranging from 25% to 36% undertakes power-stroke. Only glucose has a very dramatic effect on Power-stroke, almost all of the E.ADP.P complex goes over the power stroke. Table 4 brings out unique role of glucose with respect to ATP hydrolytic cycle; overall PM-ATPase cycling
Table 3. Average Population of PM-ATPase forming E.ADP.Pi Complex and completing power-stroke in the absence and presence of 5 mM nutri-ents/analogs.
Mixing with PM-ATPase Population E.ADP.Pi Population
Forming completing
E.ADP.Pi Complex (%) ‘Power-Stroke’(%)
Control 100 27
Glucose 94 92
2-Deoxy-D-Glucose 23 28
Xylose 38 27
Arginine 36 36
Lysine 16 26
Proline 44 25
Glutamic Acid 96 29
Variation was less than mean ±5%
Table 4. Average percentage population of PM-ATPase completing full ATP hydrolytic cycle in the absence and presence of 5 mM nutrients/analogs.
Mixing with Population of PM-ATPase Completing full
ATP hydrolytic cycle (%)
Control 27.0
Glucose 86.4
2-Deoxy-D-Glucose 06.4
Xylose 20.5
Arginine 12.9
Lysine 04.2
Proline 11.0
Glutamic Acid 27.8
www.medigraphic.com
ESTE DOCUMENTO ES ELABORADO POR MEDIGRA-PHIC
population following mixing of glucose is 86.4%. This Figure for control is 27% and is significantly less in presence of all nutrients/analogs. It is evident that all other nutrients/ analogs except glucose inhibit enzyme’s hydrolytic cycle. Molecular mechanism of glucose activation of PM-ATPase is not well established but it may involve several kinases,12
ubiquitin-proteasome proteolytic pathway.13 Phosphatidyl
ionositol signaling14 and G-proteins.15 Signal transduction
pathways, however, eventually leads to phosphorylation of Ser/Thr within C-terminal of the PM-ATPase.16
From the present study it is evident that glucose inter-acts with ATPase and affects E~P complex formation and dissociation. Low glucose activation of H+ extrusion in
spheroplasts suggests that integrity of envelope is impor-tant for this process. ATP concentrations in control cells and spheroplasts were found to be, respectively, 0.35 nmoles/mg cells and 0.33 nmoles/mg cells. For glucose in-cubated cells intracellular ATP values were 0.245 nmoles/ mg cells and 0.50 nmoles/mg cells for cells and sphero-plasts, respectively. Spheroplasts do not show much glu-cose stimulation even at high ATP, it is thus clear that high ATP is not the causative agency for glucose stimula-tion of PM-ATPase.
REFERENCES
1. Shepherd M G, Poulter R T & Sullivan PA, Candida albicans: Biology, genetics and pathogenecity. Annu Rev Microbiol 39 (1985) 579.
2. Serrano R, In vivo glucose activation of the yeast plasma mem-brane ATPase. FEBS Lett, 156 (1983) 11.
3. Serrano R, Structure and function of proton translocating AT-Pase in the plasma membranes of plants and fungi. Biochim Biophys Acta 947 (1988) 1.
4. Portillo F, de Larriona I F & Serrano R, Deletion analysis of yeast plasma membrane H+ ATPase and identification of a regulatory domain at the carboxyl terminus. FEBS Lett 247 (1989) 381. 5. Auer M, Scarborough GA and Kuhlbrandt W (1998)
Three-di-mensional map of the plasma membrane H+-ATPase in the open conformation. Nature 392: 840.
6. Eraso P and Portillo F (1994) Molecular mechanism of regula-tion of yeast plasma membrane H+-ATPase by glucose.
Inter-action between domains and identification of new regulatory sites. J Biol Chem 269 (14): 10393.
7. Manzoor N, Amin M and Khan LA (1999) Pre-steady state ki-netic studies on H+-ATPase from Candida albicans. J Biochem (Tokyo) 126 (4): 776.
8. Rashid B, Manzoor N, Amin M & Khan L A, Effect of glucose, its analogs and some amino acids on pre-steady state kinetics of ATP hydrolysis by PM-ATPase of pathogenic yeast (Candida albicans). Korean J Biol Sci 8 (2004) 307.
9. Manzoor N, Rashid R, Amin M & Khan L A, Nutrient associat-ed changes in plasma membrane H+ ATPase activity of perme-abilized Candida albicans cells. Indian J Biochem Biophys 37 (2000) 241.
10. Serrano R, Effect of ATPase inhibitors on the proton pump of respiratory deficient yeast, Eur J Biochem 105 (1980) 419. 11. Lapathitis G & Kotyk A, Different sources of acidity in glucose
elicited extracellular acidification in the yeast Saccharomyces cerevisae. Biochem Mol Biol Int 46 (1998) 973.
12. Romero I, Maldonado AM, Eraso P, Glucose-independent inhi-bition of yeast plasma-membrane H+ ATPase by calmodulin antagonists. Biochemical Journal 322 (1997), 823.
1 3 . De la Fuente N, Maldonado AM, Portillo F, Glucose activa-tion of the yeast plasma membrane H+ ATPase requires the ubiquitin-proteasome proteolytic pathway. FEBS Letters 411 (1997) 308.
14. Coccetti P, Tisi R, Martegani E, Souza Teixeira, Lopes BR, De MC, Thevelein JM, The PLC1 encoded phospholipase C in the yeast Saccharomyces cerevisae is essential for glucose-induced phosphatidlyionositol turnover and activation of plasma mem-brane H+ ATPase. Biochimica et Biophysica Acta-Molecular Cell Research 1405 (1998), 147.
15. Souza MAA, Tropia MJ, Brando RL. New aspects of the glu-cose activation of H+ ATPase in the yeast Saccharomyces cere-visae. Microbiology 147 (2001) 2849.
16. Leechi S, Allen KE, Prado, Mason AB, Slayman CW, Confor-mational changes of yeast plasma membrane H+ ATPase dur-ing activation by glucose: Role of threonine-912 in the car-boxy-terminal tail. Biochemistry 44 (2005), 16624.
Correspondence to:
Luqman A. Khan Enzyme kinetics lab, Department of Biosciences,
Jamia Millia Islamia, New Delhi-110025. India. Telephone No. +91-11-26911233