An Evolutionary Approach To Acoustic Modeling
PACS REFERENCE: 43.55.Ka
Conway, Christina; Corcoran, David University of Limerick,
Castletroy, Co. Limerick Ireland
Tel: 00 353 202307 00 353 202509 Fax: 00 353 202423
E-mail: [email protected] [email protected]
ABSTRACT
A novel evolutionary scheme for the acoustical design of small enclosures is described. We present results for a "proof of concept" 1D application in which the boundary specific impedance values of a room are optimized. The enclosure is modeled using a finite difference solution of the time independent wave equation. The selection of boundary materials to produce a desired distribution within the enclosure is automated using "differential evolution", a variation on the theme of genetic algorithms. By adopting design problems for which the solutions are known in advance, the validity of the technique is explored.
INTRODUCTION
A small-scale enclosure such as a car interior has two distinct frequency regions, a low-frequency region where the wavelength is comparable to the enclosure dimensions and a high frequency region where the wavelength is smaller than the dimensions. In this paper we are interested primarily in the low frequency region where the acoustical modes are spread out and so the sound field is often coloured with low-frequency exaggerations. It is desirable to reduce these colourations but also preserve a satisfactory sound quality.
In simple enclosure arrangements (e.g. common rectangular room) it is possible through a combination of analytical/numerical solutions, the designer’s intuition and trial and error to produce a desired sound field within the enclosure. However this method must eventually fail as the enclosures’ complexity increases.
In this paper we present a novel method to optimize the boundary properties of an enclosure to produce or approximate a particular/desired sound field within the enclosure. To explore the method, a simple acoustic model is implemented to simulate the modal region of a small room in one dimension. Evolutionary global optimizers have been applied successfully to many design problems such as the automated design of luminaire reflectors [4], [5] and [6]. An evolutionary algorithm will be applied to the acoustic system here to optimize the boundaries’ specific impedance values (indicative of the material properties at the boundaries).
EVOLUTIONARY SCHEME SET UP
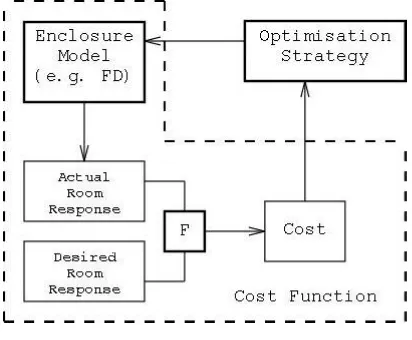
[image:2.596.195.401.266.436.2]A design solution consists of a set of boundary specific impedance values, both real and imaginary components, for several frequency ranges. The application optimizes these values to produce a design solution whose acoustic performance (spatial-frequency pressure distribution) will be close to or exactly that desired. The scheme is set up as shown in the diagram below:
Figure 1
Cost Function
The cost function, as shown in figure 1, consists of two elements, the acoustic model and the cost measure. The acoustic model produces a pressure distribution for a particular design solution. This distribution is compared with the desired distribution through some function F or cost measure to produce a cost value.
Acoustic Model
The acoustic model consists of a numerical solution of the Helmholtz equation with Robin conditions as described in [7] to [11]. Equation 1 defines the pressure distribution p(x) throughout the enclosure domain (along the x axis) for a particular k (wavenumber) value.
0
)
(
)
(
+
2=
x
p
k
dx
x
dp
(1)
i
v
Z
ikp
dn
dp
SL
ωρ
−
−
=
(
0
)
)
0
(
(2)
SR
Z
L
ikp
dn
L
dp
(
)
=
−
(
)
(3)
term from the right dictates the absorption property of the boundary where ZSL is the left boundary specific acoustic impedance. Equation 3 defines the right boundary condition that is purely absorptive where ZSR is the right boundary specific acoustic impedance and L is the enclosure length. The angular frequency is given by ù and the air density is given by ñ.
These equations are solved using the finite difference method producing the complex pressure values at regular intervals throughout the enclosure for each frequency specified. The cost measure algorithm then uses this data to evaluate the cost value of a particular design solution.
Cost Measure
The cost measure calculates the difference between the actual sound pressure field and that desired. The implementation here is as follows:
nf
d
p
F
f
j n
i
ij ij
∑∑
= =
−
=
0 0(3.1)
where i is the spatial index, j is the frequency index and |pij| and |dij| are the actual and desired pressure magnitudes respectively. The total number of frequencies sampled is f and n is the number of spatial elements used.
Optimization
An evolutionary strategy called Differential Evolution (DE) [12] is used as the optimizer. It is a global optimizer that is similar to a genetic algorithm but with two significant advantages that makes it suitable for this application. Firstly it allows the use of decimal values rather that the traditional genetic algorithm binary encoding. Also DE algorithms have been found to be more efficient optimizers, which suits this computationally intensive application. DE works by initially generating a random population of chromosomes. Each chromosome consists of a number of genes and represents an enclosure design as described above, where the genes are the real and imaginary impedances. Subsequently each chromosome has its cost evaluated through the cost function. A new population of chromosomes is then produced from the old population using mechanisms such as crossover (random swapping of genes with a target chromosome) and mutation (addition of a random variation in the chromosomes to add diversity as in nature), which modify the genes of each chromosome in much the same way as DNA is modified. The specific details of the DE algorithms implementation are given in the following algorithm.
1. Create a random set (population) of chromosomes (design solutions):
[
X
1,
X
2,
X
3K
X
n]
2. Select Xj
3. Randomly select three chromosomes from the population R1, R2 and R3. 4. Create a parent chromosome as follows:
)
R
(R
R
Y
i=
1i+
N
i2−
i3where N is the noise scaling factor (
0
<
N
≤
1
.
2
).5. Form a new child chromosome Z through nonuniform crossover: a. For each gene generate a random number r.
b. If r>CR then that gene is taken from X. Otherwise the gene comes from Y.
CR is the Crossover Constant (
0
≤
CR
≤
1
).6. Evaluate the cost of Z and choose Xj or Z according to which has the lowest cost.
7. Iterate to next Xj and repeat from 3 for the entire population (one iteration).
8. Repeat the process from 2 until the maximum number of iterations has been reached or the minimum cost value has been achieved.
view. However if the number of genes is increased it becomes impossible to show the search space, at best a small cross section may be seen. Global optimizers are designed to tackle problems with search spaces of complex topography.
RESULTS
To explore the operation of the strategy, a desired pressure distribution is selected for which the boundary conditions are known in advance. In theory, given the desired pressure distribution, the strategy should be able to “reverse engineer” i.e. determine these boundary conditions.
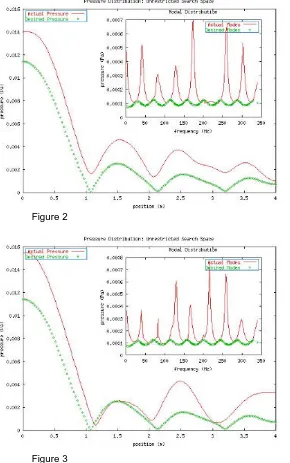
Figure 2 shows the desired pressure distribution versus the solution (after 80 iterations using a population of 6). The values for N and
CR are respectively 0.8 and 0.6. It can be seen that the solution configuration has a similar shape to that desired, but is shifted upwards. The modal spectrum for the solution is irregular with all but one mode having a larger pressure and the resulting specific impedance values determined by the strategy are not close to those used to generate the desired distribution.
Figure 2
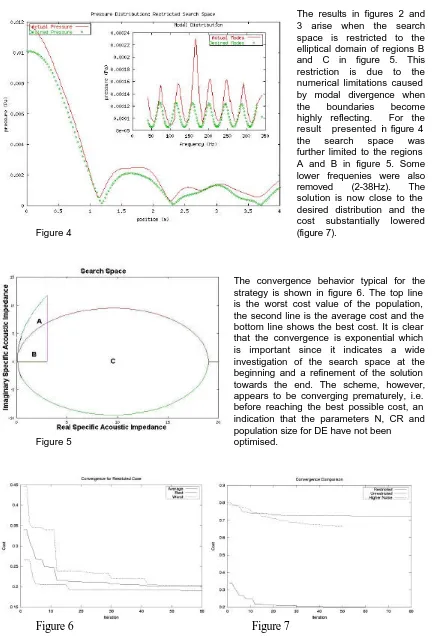
Increasing the N and CR
can lead to a more extensive exploration of the search space, as can increasing the number of chromosomes in a population. In figure 3, the optimum result after 40 iterations is presented for a population of 10 with N and
CR set at 0.9. From figures 7 and 3, it can be seen that the cost has lowered and the solution improved. Moreover from figure 7, it is apparent that the strategy has not yet converged for this higher noise problem. If run for a longer number of iterations
Figure 3 the cost would be expected
[image:4.596.89.379.204.667.2]The results in figures 2 and 3 arise when the search space is restricted to the elliptical domain of regions B and C in figure 5. This restriction is due to the numerical limitations caused by modal divergence when the boundaries become highly reflecting. For the result presented in figure 4 the search space was further limited to the regions A and B in figure 5. Some lower frequenies were also removed (2-38Hz). The solution is now close to the desired distribution and the cost substantially lowered
Figure 4 (figure 7).
[image:5.596.86.369.85.334.2]The convergence behavior typical for the strategy is shown in figure 6. The top line is the worst cost value of the population, the second line is the average cost and the bottom line shows the best cost. It is clear that the convergence is exponential which is important since it indicates a wide investigation of the search space at the beginning and a refinement of the solution towards the end. The scheme, however, appears to be converging prematurely, i.e. before reaching the best possible cost, an indication that the parameters N, CR and population size for DE have not been
Figure 5 optimised.
DISUSSION/CONCLUSION
A novel strategy to generate the acoustic design of an enclosure has been presented. The strategy makes use of a global optimizer called Differential Evolution. The strategy was applied to a 1-D enclosure for which the boundary impedance values were to be optimized to generate a desired spatial pressure distribution.
Using a reverse engineering approach, it was initially observed that the method was capable of generating the shape of a desired distribution, but that the solution pressure was consistently higher than that desired. The solution was generated from 80 iterations and from figure 7, it is apparent that the solution prematurely converged. Simply running the program for longer would not improve the result. To test if the issue was one of lack of diversity in the population of solutions, the population number, the cross over constant, and noise factor of DE were increased. The result in this instance showed a lower overall cost at the end of only 40 iterations. In addition the trend in figure 7 indicates a continuing reduction in cost. It is concluded that significant improvement in the design solutions of the strategy will be obtained by increasing the DE genetic diversity.
One also must point out that the cost measure, as implemented, is quite a simplistic measure of the difference between the spatial desired and solution pressure magnitudes. In particular, no account has been taken of the non-linear relationship of the resultant pressure distribution on the boundaries’ specific acoustic impedances. With this in mind, the search space was restricted to a reduced region where the impedance amplitude and phase variation would still be significant. The solution dramatically improves. Coupled with increased genetic diversity and longer run times (iteration number) it is expected that the strategy would be capable of generating a far better, if not exact, match to the desired pressure distribution.
Overall, the authors are of the view that the optimization method outlined is an interesting approach to acoustic design, which based on these preliminary results, warrants further study. The approach is quite general and can just as easily be applied to shape optimization as impedance optimization. The current acoustic model used only serves as an illustration of the methodology, but in the future the strategy will be applied to the more realistic two-dimensional problems using efficient convergent Helmholtz solution methods such as the Boundary Element Method (BEM).
REFERENCES:
[1] Mingsian R. Bai and Sernshen Chang, Active noise control of enclosed harmonic fields by using BEM-based optimization techniques, Applied Acoustics. 48, no. 1, (1996) 15-32 [2] Abderrahmane Habbal, Nonsmooth shape optimization applied to linear acoustics. Society for Industrial and Applied Mathematics (SIAM) Journal of Optimization. 8, no. 4, (1998) 989-1006.
[3] St. Marburg, H. J. Hardtke, R.Schmidt and D. Pawandenat, Applications of the concept of acoustic influence coefficients for the optimization of a vehicle roof. Engineering Analysis with Boundary Elements. 20 (1997) 305-310.
[4] Steven Doyle, David Corcoran and Jon Connell, Automated mirror design using an evolutionary strategy, Optical Engineering 38, no. 2 (1999) 323-333
[5] Steven Doyle, David Corcoran and Jon Connell, A merit function for automated mirror design. Journal of Illumination Engineering. 30, no. 2, (2001) 3-11.
[6] Steven Doyle, David Corcoran and Jon Connell, Automated mirror design for an extended light source, In Proceedings of SPIE, 3781, (1999) 94
[7] Leo L. Beranek and Istvan L. Ver, Noise and Vibration Control Engineering: Principles and Applications. John Wiley and Sons, Inc, 1992.
[8] Heinrich Kuttruff, Room Acoustics. E and FN Spon, 1991.
[9] P. Filippi, D. Habault, J.P. Lefebvre and A. Bergassoli, Acoustics: Basic Physics, Theory and Methods. Academic Press, 1999.
[10] Frank Fahy, Fundamentals of Engineering Acoustics. Academic Press, 2001. [11] Lothar Cremer and Helmut A. Muller, Principles and Applications of Room Acoustics (volume 2). Applied Science Publishers LTD, 1982.