A DCC-GARCH analysis of regulatory impacts and nancial
contagion in Latin American markets derived from two
relevant crisis at the dawn of the 21st Century in the US: the
telecommunications bust in
2001
and the great recession in
2007
−
2009
José Alberto Candelaria
[email protected]. Centro de Estudios, Instituto Federal de Telecomunicaciones México, D.F.1
Abstract
The aim of this research consists on compare and examine the time-varying correlation between the returns of the most important capitalization-weighted index in the telecommunications sector, the NASDAQ telecommuni-cations index and the stock indices' returns of the three main Latin American economies (Argentina, Brazil and Mexico). The study involves the use of the Dynamic Conditional Correlation (henceforth, DCC) GARCH model in order to examine the nancial contagion phenomenon during two dierentiated turmoil economic periods in
21stcentury: the bust in telecommunications sector in2001and the US great recession of2007-2009. Each case
derived from a particular source: the rst one from a US Federal Communications Commission's (henceforth, FCC) vague regulatory initiative aimed at improving the competition in local phone services; the second one from nancial disruptions, oil shocks and the bursting housing-bubble in2007. Thus, our purpose is to illustrate the
relationship between NASDAQ telecommunications index and Latin America's stock market indices following two important economic shocks with dierentiated origins. Additionally, it allows to distinguish the correlation sign and the reaction on Latin American's markets to external economic situations. Futhermore, it can shed light to Latin American telecommunications regulators about how external policy decision-making aect their national stock markets, and consequently other aspects of their national economies. Even though we are not directly considering a telecommunications growth indicator, it is generally considered that the development of stock market indices is positively and robustly correlated with economic growth. On the other hand, the DCC-GARCH model consists on an ecient version of ARCH models in order to modelize volatilities in nancial time series. The estimation process is easier since it involves fewer parameters. In addition, and more importantly, DCC-GARCH model is capable of capturing volatility clustering in nancial time series. Estimation results reveal that NASDAQ telecommunications index's returns tended to move in the same direction as stock market indices' returns in both periods, however, the2007−2009period is much more volatile.
Keywords: DCC - GARCH, NASDAQ Telecommunications Index, Regulatory Impacts. JEL Classication: C51
1Disclaimer: The content of this article is of the author's sole responsibility. It does not represent the views of the Instituto Federal
de Telecomunicaciones (IFT) or its sta. Any inquiries related to the article's content and all permission to cite should be directed to the author.
1 Introduction
The current economic globalization process has generated a strong linkage between nancial markets worldwide. In this respect, sudden shocks in volatility in an international stock market could be reected across other nancial markets given the integration of the global nancial system. The analysis of periods of economic and nancial crisis and the existence of a contagion phenomenon derived from a policy decision-making is of the utmost importance for policy-makers. This paper focuses on the examination of the nancial contagion phenomenon between the returns of the NASDAQ telecommunications index and stock market indices' returns of Argentina, Brazil and Mexico following two of the main economic crisis of the last three lustrums: the bust in telecommunications sector at the rst years of the 21st century and the US great recession of December 2007 - June2009. The boom and bust in telecommunications sector overlapped with the dot-com bubble which formed around internet companies between 1995 and 2001. According to Couper, et al. (2003) the telecom bust was caused by the rising levels of concern among telecommunication companies about the FCC's1996Telecommunications Act which was designed to endorse competition in local phone services. The issue was interpreted as a lack of clarity change in the regulatory environment, dicult to interpret and with a fuzzy implementation. The result was a myriad of court demands against the FCC that inhibited the 1996 Act's ecacy. Moreover, the initial overestimation of the positive eects of the Act leads to large forecast errors in the demand for long-haul ber. Furthermore, the rapid technological progress strengthened the idea of the development of new applications which would lead to a greater demand of bandwidth. However, at the end the theoretical virtuous circle was never accomplished. Thus, a regulatory initiative that was meant to be a way to increase competititon at the local exchange carrier level ended up becoming a catastrophe: the stock market meltdown due to 2001`s telecom stock bust.
In addition, it is not superuous to stress that the development of the stock markets play a signicant role in economic growth. For instance, Adjasi and Biekpe (2006) found a statistically signicant positive relationship between stock markets and economic growth of upper middle income African countries. In the endogenous growth theory framework (Levine,1997) it is stated that the stock market development fosters long-run economic growth because it optimizes the allocation of resources; also, it incentivices the capital accumulation and the technological innovation. In another contribution, Levine (1991)establishes that stock markets positively aect rm eciency by dismissing the premature withdrawal of capital from rms. This is how an increasing average amount of capital maintained in a rm stimulates the growth rate of human capital and therefore economic growth.
In regards to the US great recession that began in2007, it was a general slowdown that started as a turbulence in the sub-prime mortgage segment of the US housing market. Additionally, the deregulation in the US nancial markets considerable aected the expansion of the crisis. In this sense, the US recession was a totally dierent economic phenomenon with respect to the bust in telecommunications. Thus, the comparison of two eects derived from dierent economic movements and their spillover eect can contribute to shed light to Latin America's telecom-munications regulators about how external policy decision-making in the telecomtelecom-munications sector and nancial shocks aect the national stock markets and, in consequence, companies in general and telecommunications rms in particular. Then, we highlight the scope and divergences that the time-varying correlation between the returns of NASDAQ telecom index and stock markets indices' returns have for each case. That is, we capture the sign of their relationship in dierent states of the business cycle. Moreover, telecommunications sector is an important case to be analyzed since it is recognized that it is essential in terms of maintaining the well functioning of the market economy and to promote the volume of domestic and foreign trade.
indices in dierent states of the business cycle by using fewer parameters.
We proceed as follows. In section2we discuss the structure of the NASDAQ Telecom index. In section3we explain the methodological approach based in Engle's(2002)DCC GARCH model. In section4we describe our data, while in section5 we present our substantive results. We conclude in section6.
2 Nasdaq Telecom Index
The NASDAQ telecommunications index (Symbol: IXTC) includes securities of NASDAQ index listed companies classifed according to the Industry Classication Benchmark (ICB) as telecommunications or telecommunications equipment. The NASDAQ telecommunications index is dened as a market capitalization-weighted index. The value of the index equals the aggregate value of the index share weights of each of the index securities multiplied by each such security's last sale price, and divided by the divisor of the index. It should be noted that in order to be eligible for inclusion in the index a security must be listed on the NASDAQ Stock Market and be classied according to the ICB as Telecommunications (code: 6000) or Telecommunications Equipment (code: 9578). Table 1 shows the industry structure and denitions of ICB's classication. Due to increasing accesibility to technology and globalization, it is considered that NASDAQ telecommunications index has been one of the most developing sector indices in last years.
Table 1. Industry Classication Benchmark
Industry Supersector Sector Subsector Denition
6000 Telecommunications 6500 Telecommunications 6530 Fixed Line Telecommunications 6535 Fixed Line
Telecommunica-tions
Providers of xed-line telephone services, including regional and long-distance. Includes companies that primarily provides telephone services through theinternet. Excludes companies whose primary business is Internet access, whichare classied under Internet.
6570 Mobile Telecommunications 6575 Mobile Telecommunica-tions
Providers of mobile telephone services, including cellular, satellite and paging services. Includes wireless tower companies that own, operate and lease mobile site towers to multiple wireless service providers. 9000 Technology 9500 Technology 9570 Technology Hardware & Equipment 9578
Telecom-munications Equipment
Makers and distributors of high-technology
communications products, including satellites, mobile telephones, ber optics, switching devices, local and wide-area networks, teleconferencing equipment and connectivity devices for computers, including hubs and routers.
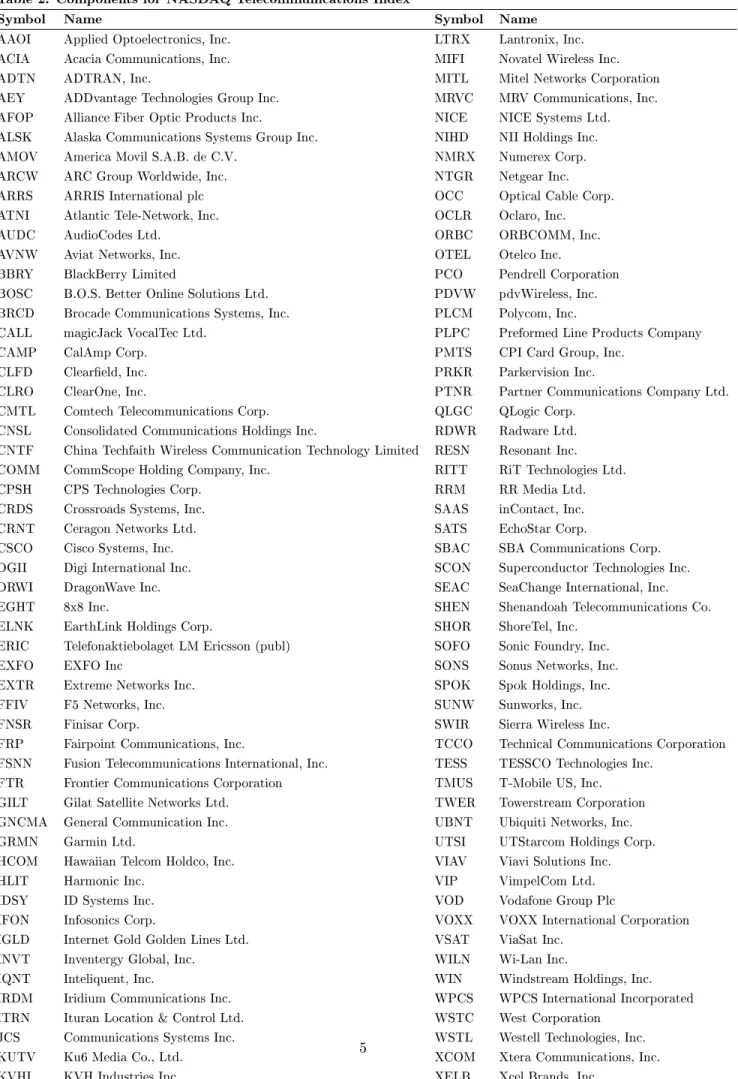
Table 2. Components for NASDAQ Telecommunications Index
Symbol Name Symbol Name
AAOI Applied Optoelectronics, Inc. LTRX Lantronix, Inc. ACIA Acacia Communications, Inc. MIFI Novatel Wireless Inc.
ADTN ADTRAN, Inc. MITL Mitel Networks Corporation
AEY ADDvantage Technologies Group Inc. MRVC MRV Communications, Inc. AFOP Alliance Fiber Optic Products Inc. NICE NICE Systems Ltd. ALSK Alaska Communications Systems Group Inc. NIHD NII Holdings Inc. AMOV America Movil S.A.B. de C.V. NMRX Numerex Corp.
ARCW ARC Group Worldwide, Inc. NTGR Netgear Inc.
ARRS ARRIS International plc OCC Optical Cable Corp.
ATNI Atlantic Tele-Network, Inc. OCLR Oclaro, Inc.
AUDC AudioCodes Ltd. ORBC ORBCOMM, Inc.
AVNW Aviat Networks, Inc. OTEL Otelco Inc.
BBRY BlackBerry Limited PCO Pendrell Corporation
BOSC B.O.S. Better Online Solutions Ltd. PDVW pdvWireless, Inc. BRCD Brocade Communications Systems, Inc. PLCM Polycom, Inc.
CALL magicJack VocalTec Ltd. PLPC Preformed Line Products Company
CAMP CalAmp Corp. PMTS CPI Card Group, Inc.
CLFD Cleareld, Inc. PRKR Parkervision Inc.
CLRO ClearOne, Inc. PTNR Partner Communications Company Ltd.
CMTL Comtech Telecommunications Corp. QLGC QLogic Corp. CNSL Consolidated Communications Holdings Inc. RDWR Radware Ltd. CNTF China Techfaith Wireless Communication Technology Limited RESN Resonant Inc. COMM CommScope Holding Company, Inc. RITT RiT Technologies Ltd.
CPSH CPS Technologies Corp. RRM RR Media Ltd.
CRDS Crossroads Systems, Inc. SAAS inContact, Inc.
CRNT Ceragon Networks Ltd. SATS EchoStar Corp.
CSCO Cisco Systems, Inc. SBAC SBA Communications Corp.
DGII Digi International Inc. SCON Superconductor Technologies Inc.
DRWI DragonWave Inc. SEAC SeaChange International, Inc.
EGHT 8x8 Inc. SHEN Shenandoah Telecommunications Co.
ELNK EarthLink Holdings Corp. SHOR ShoreTel, Inc.
ERIC Telefonaktiebolaget LM Ericsson (publ) SOFO Sonic Foundry, Inc.
EXFO EXFO Inc SONS Sonus Networks, Inc.
EXTR Extreme Networks Inc. SPOK Spok Holdings, Inc.
FFIV F5 Networks, Inc. SUNW Sunworks, Inc.
FNSR Finisar Corp. SWIR Sierra Wireless Inc.
FRP Fairpoint Communications, Inc. TCCO Technical Communications Corporation FSNN Fusion Telecommunications International, Inc. TESS TESSCO Technologies Inc.
FTR Frontier Communications Corporation TMUS T-Mobile US, Inc. GILT Gilat Satellite Networks Ltd. TWER Towerstream Corporation GNCMA General Communication Inc. UBNT Ubiquiti Networks, Inc.
GRMN Garmin Ltd. UTSI UTStarcom Holdings Corp.
HCOM Hawaiian Telcom Holdco, Inc. VIAV Viavi Solutions Inc.
HLIT Harmonic Inc. VIP VimpelCom Ltd.
IDSY ID Systems Inc. VOD Vodafone Group Plc
IFON Infosonics Corp. VOXX VOXX International Corporation
IGLD Internet Gold Golden Lines Ltd. VSAT ViaSat Inc.
INVT Inventergy Global, Inc. WILN Wi-Lan Inc.
IQNT Inteliquent, Inc. WIN Windstream Holdings, Inc.
IRDM Iridium Communications Inc. WPCS WPCS International Incorporated ITRN Ituran Location & Control Ltd. WSTC West Corporation
JCS Communications Systems Inc. WSTL Westell Technologies, Inc.
KUTV Ku6 Media Co., Ltd. XCOM Xtera Communications, Inc.
KVHI KVH Industries Inc. XELB Xcel Brands, Inc.
KZ KongZhong Corporation XGTI xG Technology, Inc.
Symbol Name Symbol Name LITE Lumentum Holdings Inc. XXIA Ixia
LMOS Lumos Networks Corp. YY YY Inc.
LORL Loral Space & Communications, Inc. ZHNE Zhone Technologies Inc. LRAD LRAD Corporation
3 DCC GARCH model
The DCC-GARCH model was originally developed by Engle (2001,2002) and Engle and Sheppard (2001). The model is based on the Autoregressive Conditional Heteroskedasticity (ARCH) model of Engle(1982), the Generalized Autoregressive Conditional Heteroskedastic process (GARCH) (Bollerslev, 1986), and Bollerslev's(1990)constant conditional correlation (CCC) model. The DCC estimator is viewed as an ecient version of ARCH models for volatility modelling because the number of parameters to be estimated has no relation with the number of series to be correlated. Hence, the DCC-GARCH model does not have the complexity of conventional multivariate GARCH models and it allows for the examination of time-varying conditional correlations coecients and variances of several variables. Since DCC-GARCH model continuously adjust the correlation for time-varying volatility, its measure for correlation does not have any bias from volatility.
In Engle(2001)the author assumes the following process for a random variable rt. The assumption of normality
gives rise to a likelihood function; however, even if we do not stablish this assumption the estimator still have a Quasi-Maximum Likelihood (QML) interpretation.
rt| Ft−1∼N(0, DtRtDt)
The DCC model can be estimated in two steps. In the rst one the estimation of each asset's conditional variance is done through a univariate GARCH(p, q)process.
hit=ωi+ Pi
X
p=1
αiprit2−p+ Qi
X
q=1
βiqhit−p f or i= 1,2,3, ...k (1)
The non-negativity and stationarity conditions satisfy the equationPPi
p=1αip+P Qi
q=1βiq<1. In the second step,
the conditional covariance matrix(Ht)is estimated by using the standardized residuals of the previous step in the
following form:
Ht≡DtRtDt (2)
WhereDt=diag(h
1/2 11t, ..., h
1/2
N N t)is ak×k diagonal matrix of time-varying standard deviations from a univariate
Rt=diag(q
−1/2 11t , ..., q
−1/2
N N t)Qtdiag(q
−1/2 11t , ..., q
−1/2
N N t) (3)
The log-likelihood is written in the following form:
L=−1
2
T
X
t=1
k log(2π) + 2log|Ht|+rt0H
−1
t rt
=−1
2
T
X
t=1
k log(2π) + 2log|DtRtDt|+rt0D
−1
t R
−1
t D
−1
t rt
=−1
2
T
X
t=1
k log(2π) + 2log|Dt|+log |Rt|+ε0tR−
1
t εt
Standardized residuals (i.e. divided by conditional standard deviation) are equal toεt=D−t1rt. On the other hand,
Qtis anN×N symmetric positive denite matrix, which represents the dynamic correlation structure:
Qt= 1− M
X
m=1 am−
N X n=1 bn ! Q+ M X
m−1
am εt−mε0t−m
+
N
X
n=1
bnQt−n (4)
Rt=Qt∗−1QtQt∗−1
WhereQis the unconditional (time-invariant) covariance matrix of dimensionN×N of the standardized residuals
from the univariate GARCH model(1).WhileQ∗=diag√qii is a diagonal matrix containing the square root of
the diagonal elements ofQt. The key element of interest isRt, which is the positive denite matrix of time-varying
conditional correlations, between NASDAQ telecommunications index and each stock market indices. Each element of would beρijt=
qijt √
qiiqjj.In a dierent manner than Bollerslev's Conditional Constant Correlation (CCC) model
the DCC estimator allows a time-varying dynamic to the volatilities, covariances and correlations.
4 Data
In this paper we investigate the daily rates of return of NASDAQ telecom index and main Latin America's stock market indices: Argentina's Merval (Symbol: MERV), Brazil's Bovespa (Symbol: BVSP) and Mexico's IPC (Sym-bol: MXX). As it was aforementioned, we analyze two of the main economic and nancial crisis periods of the rst decade of21st century: the bust in telecommunications sector from march 2001 to november2001, and the US great recession from december2007 to june2009. In this respect, we use the NBER2 dened recession dates. Other authors as Naoui et. al(2010)analyze the subprime mortgage crisis and dene a period that starts in August 2007and ends in February2010.Following NBER's recession denition, the recession date starts at the peak of the
2http://www.nber.org/cycles.html
business cycle and ends at the trough. The rate of return is dened by the following equation which corresponds to a continuous compounding rate:
Xt=logPt−logPt−1
The data set is downloaded from http://www.nance.yahoo.com using theR package tseries. However, our data
set suers from missing values for all variables. In this respect, it is recognized that missing values are unavoidable and they have the potential to undermine the validity of research results. In order to deal eciently with problems that arise with missing values we apply an imputation non-parametric method that is in R package missForest.
The method is trained on the observed values of a data matrix in order to predict the missing values 3. Morever,
the package yields a imputation error estimate.
Figure 1 shows the close prices for all indices from peak (march 2001) to trough (november 2001). These dates correspond to the business cycle reference dates dened by NBER. It is clear that the close prices consistently start to decline by june2001, with the exception of Mexico's IPC, which shows a slightly recovery during june and july of that year. Figure2depicts the close prices for all indices from december2007to june2009, corresponding to the US great recession of those years. It is clear that the prices reached it lowest level in the last quarter of2008.
Figure 1. NASDAQ Telecommunications Index and Latin American Stock Market Indices (IPC, MERVAL and Bovespa) close prices, from March2001to November2001.
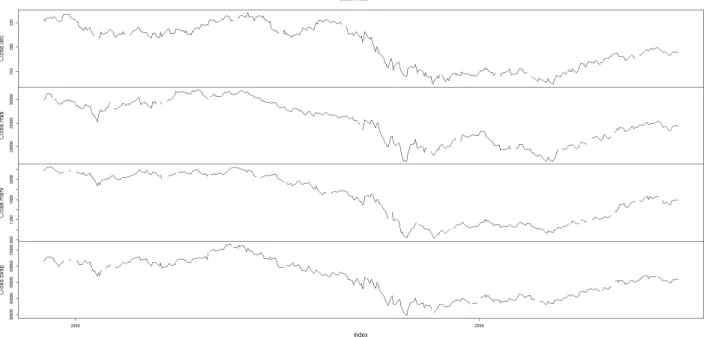
Figure 2. NASDAQ Telecommunications Index and Latin American Stock Market Indices (IPC, MERVAL and Bovespa) close prices, from december2007to june2009.
On the other hand, Figure 3 shows the daily rates of returns for the indices, from march2001to november 2001. We can observe from the rst graph that NASDAQ telecom index shows a greater volatility at the beginning of the period than in the rest. The same in the case of Mexico's IPC. Argentina's Merval also shows a considerable volatility in the rsts months but it is greater for september of2001.Bovespa's behavior also shows greater volatility
in the last three months of 2001.Figure 4depicts the daily rates of returns for the second busines cycle reference dates under analysis (december2007to june2009). It is clear that the period with greater volatility for all indices corresponds to the fourth quarter of2008, while IPC and Merval shows important uctuations in the second quarter of2009.
Figure 3. NASDAQ Telecommunications Index and Latin American Stock Market Indices (IPC, MERVAL and Bovespa) daily rates of returns, from March2001to November2001.
5 Results
5.1 Bust in Telecommunications Sector,
2001
.
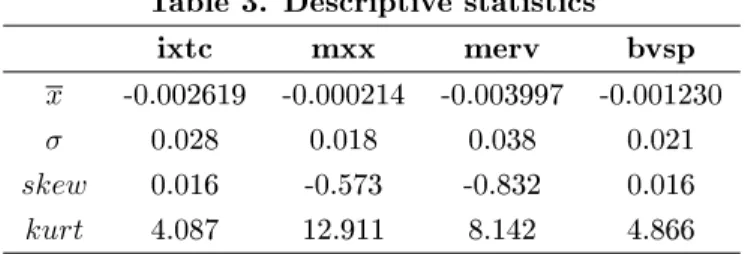
In this subsection we present the results regarding evolution of the dynamic conditional correlation between NAS-DAQ telecommunications index's returns and the returns of each stock market index, during the bust in telecom-munications sector in 2001. Table 3 shows the descriptive statistics for each index's returns. When the sums of
α and β in GARCH equations approach to unity, it implies a high persistence in conditional variances, i.e. that
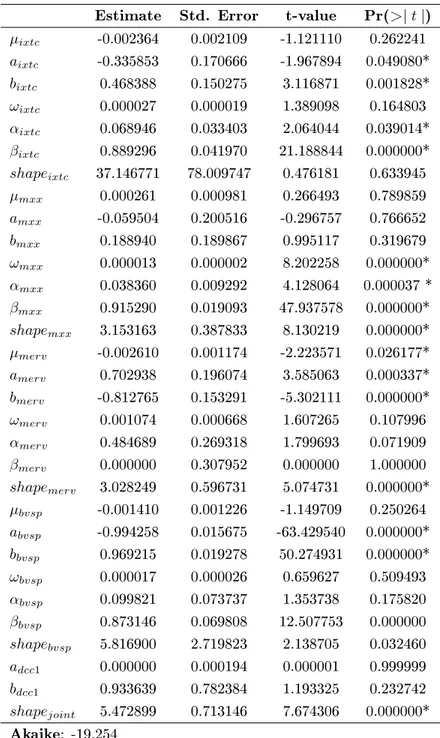
the movements of the conditional variance have a considerable duration in time when they are not close to their long-run mean. Table4displays the estimation results for the DCC (1,1) - GARCH (1,1) model, where we have the following sums for the GARCH coecients: αixtc+βixtc = 0.958;αmxx+βmxx = 0.953; αmerv+βmerv = 0.484;
αbvsp+βbvsp= 0.940. We can conclude that there exists a high persistence of volatility for all indices, except in the
case of Argentina's Merval. Further, the sum of the joint correlation parameters(adcc1+bdcc1)is 0.933. It implies
the existence of a linkage eect,i.e. a considerable correlation among the analyzed variables.
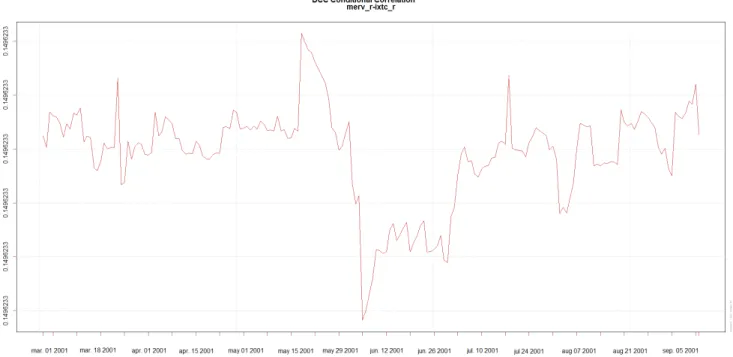
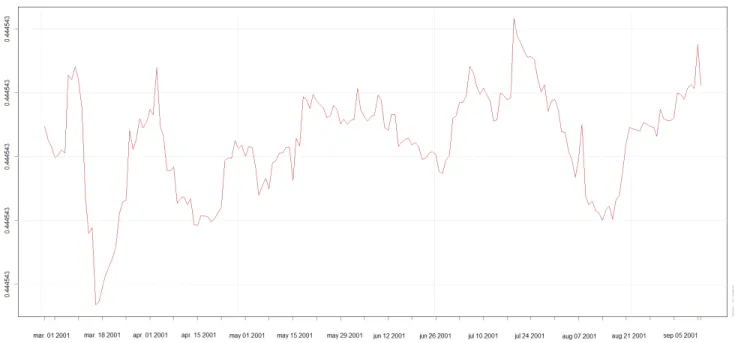
The evolution of the conditional correlations of the three Latin American countries is positive in the reference date, however in the case of Argentina's Merval it is considerable weak given that it does not exceed15% (view Figure 6). Additionally, on december2001 Argentina declared a default of its debt inside a severe economic and political crisis, which aected its economy considerable. On the other hand, as shown in Figures 5 and 7, Mexico's IPC and Brazil's Bovespa show a strong dynamic conditional correlation with NASDAQ telecommunications index for the same period. The former reached the40%, while the latter exceeded that percentage. Our results strengthen the idea of a close association between the bust in US telecommunications sector and Brazil and Mexico's stock markets. If we focus on data from the real economy we can observe similar eects. For instance, Martins and Galina (2009)concluded that after world crisis in the sector in2001 the investments in activities of innovation in telecommunications equipment companies in Brazil were vulnerable to the economic environment of the industry. Other social consequences were a decrease in the number of workers and in their average salaries.
Table 3. Descriptive statistics
ixtc mxx merv bvsp
x -0.002619 -0.000214 -0.003997 -0.001230
σ 0.028 0.018 0.038 0.021
skew 0.016 -0.573 -0.832 0.016
kurt 4.087 12.911 8.142 4.866
Table 4. DCC-GARCH model estimation results,2001 Estimate Std. Error t-value Pr(>|t|)
µixtc -0.002364 0.002109 -1.121110 0.262241
aixtc -0.335853 0.170666 -1.967894 0.049080*
bixtc 0.468388 0.150275 3.116871 0.001828*
ωixtc 0.000027 0.000019 1.389098 0.164803
αixtc 0.068946 0.033403 2.064044 0.039014*
βixtc 0.889296 0.041970 21.188844 0.000000*
shapeixtc 37.146771 78.009747 0.476181 0.633945
µmxx 0.000261 0.000981 0.266493 0.789859
amxx -0.059504 0.200516 -0.296757 0.766652
bmxx 0.188940 0.189867 0.995117 0.319679
ωmxx 0.000013 0.000002 8.202258 0.000000*
αmxx 0.038360 0.009292 4.128064 0.000037 *
βmxx 0.915290 0.019093 47.937578 0.000000*
shapemxx 3.153163 0.387833 8.130219 0.000000*
µmerv -0.002610 0.001174 -2.223571 0.026177*
amerv 0.702938 0.196074 3.585063 0.000337*
bmerv -0.812765 0.153291 -5.302111 0.000000*
ωmerv 0.001074 0.000668 1.607265 0.107996
αmerv 0.484689 0.269318 1.799693 0.071909
βmerv 0.000000 0.307952 0.000000 1.000000
shapemerv 3.028249 0.596731 5.074731 0.000000*
µbvsp -0.001410 0.001226 -1.149709 0.250264
abvsp -0.994258 0.015675 -63.429540 0.000000*
bbvsp 0.969215 0.019278 50.274931 0.000000*
ωbvsp 0.000017 0.000026 0.659627 0.509493
αbvsp 0.099821 0.073737 1.353738 0.175820
βbvsp 0.873146 0.069808 12.507753 0.000000
shapebvsp 5.816900 2.719823 2.138705 0.032460
adcc1 0.000000 0.000194 0.000001 0.999999
bdcc1 0.933639 0.782384 1.193325 0.232742
shapejoint 5.472899 0.713146 7.674306 0.000000*
Figure 5. Dynamic Conditional Correlation between NASDAQ telecommunications index and IPC,2001.
Figure 6. Dynamic Conditional Correlation between NASDAQ telecommunications index and MERVAL,2001.
Figure 7. Dynamic Conditional Correlation between NASDAQ telecommunications index and Bovespa,2001.
A fundamental point to take into account is the evolution of the annual growth rate of gross domestic product (GDP). Figure8 depicts a sharp drop in the growth rates of the three countries in 2001. It was more abrupt for Argentina, underpinned by its own economic and political crisis. While for the case of Brazil it was still positive; in the case of Mexico it dropped to negative values.
Figure 8. GDP Annual Growh Rate. Argentina, Brazil and Mexico. 2000− 2015.
5.2 US Great Recession,
2007
-
2009
.
Table 6 displays the estimation results for the DCC (1,1) - GARCH (1,1) model. The results for the sums of coecientsαandβof the univariate GARCH models are the following: αixtc+βixtc= 0.982;αmxx+βmxx= 0.993;
αmerv+βmerv = 0.998; αbvsp+βbvsp = 0.961. It is clear that the persistence of volatility is high for all indices,
in the analyzed period. Moreover, the sum of the parameters of joint correlation(adcc1+bdcc1) is equal to0.920.
The conclusion is that during the US great recession the linkage eect among the analyzed indices' returns was considerable high.
On the other hand, Figures9−11show the evolution of the time-varying correlation between NASDAQ telecom index's returns and the returns of each stock market index. The conditional correlation is positive in all cases, however it shows more volatility than the conditional correlation in the analysis of the bust of telecommunications sector. In Figure9 we observe that the conditional correlation between NASDAQ telecommunications index and Mexico's IPC reached its lowest level (< 40%) in may 2008, while two months latter it reached its highest level (>80%). The case of Argentina's Merval is quite similar since the conditional correlation almost reached the30% in may2008 and touched its highest level in july of the same year (view Figure10). Finally, the case of Brazil's Bovespa is the most extreme of the three indices. Figure 11 depicts a high volatility in time-varying conditional correlation, since it dropped below20% in march2008, while it grew above the80% in june2008.
Table 5. Descriptive statistics
ixtc mxx merv bvsp
x -0.000774 -0.000511 -0.000796 -0.000507
σ 0.029 0.023 0.031 0.030
skew -0.012 0.536 0.051 0.191
kurt 4.952 6.245 10.968 5.874
Table 6. DCC-GARCH model estimation results,2007−2009. Estimate Std. Error t-value Pr(>|t|)
µixtc 0.000320 0.000937 0.34186 0.732460
aixtc 0.348681 0.239049 1.45862 0.144671
bixtc -0.475657 0.225615 -2.10826 0.035008*
ωixtc 0.000014 0.000027 0.51318 0.607826
αixtc 0.092395 0.059191 1.56098 0.118528
βixtc 0.890295 0.020510 43.40722 0.000000*
shapeixtc 13.672545 12.124037 1.12772 0.259437
µmxx -0.001039 0.000824 -1.26086 0.207358
amxx -0.973407 0.003854 -252.55597 0.000000*
bmxx 1.000000 0.000365 2739.66800 0.000000*
ωmxx 0.000009 0.000010 0.98655 0.323863
αmxx 0.126363 0.046351 2.72620 0.006407*
βmxx 0.867540 0.024710 35.10830 0.000000*
shapemxx 4.690887 1.004117 4.67165 0.000003*
µmerv 0.000173 0.000906 0.19078 0.848701
amerv 0.149467 0.733188 0.20386 0.838464
bmerv -0.183246 0.738632 -0.24809 0.804066
ωmerv 0.000026 0.000014 1.89744 0.057770
αmerv 0.184536 0.069961 2.63769 0.008347*
βmerv 0.814463 0.062142 13.10644 0.000000*
shapemerv 3.864744 1.021025 3.78516 0.000154*
µbvsp 0.000095 0.000907 0.10429 0.916941
abvsp 0.669669 0.134871 4.96524 0.000001*
bbvsp -0.750493 0.118613 -6.32721 0.000000*
ωbvsp 0.000033 0.000019 1.74643 0.080736
αbvsp 0.110668 0.037238 2.97187 0.002960*
βbvsp 0.851084 0.048768 17.45156 0.000000*
shapebvsp 8.026730 3.199428 2.50880 0.012114*
adcc1 0.053694 0.018025 2.97881 0.002894*
bdcc1 0.867045 0.066947 12.95121 0.000000*
shapejoint 5.951424 0.787862 7.55389 0.000000*
Figure 9. Dynamic Conditional Correlation between NASDAQ telecommunications index and IPC,2007−2009.
Figure 10. Dynamic Conditional Correlation between NASDAQ telecommunications index and Merval, 2007−2009.
Figure 11. Dynamic Conditional Correlation between NASDAQ telecommunications index and Bovespa, 2007−2009.
6 Conclusions
This paper has investigated the relationship between the returns of the NASDAQ telecommunications index and stock market indices' returns of Argentina, Brazil and Mexico. Empirical results based on a DCC-GARCH model establish that there is a positive time-varying conditional correlation during both reference dates. However, the 2007−2009period is much more volatile. Thus, we can conclude that all three national stock markets are strongly linked to the shocks over NASDAQ telecommunications index (maybe with the exception of Argentina's merval during 2001, but positive at the end), resultant from dierentiated sources: i)an FCC's fuzzy regulatory initia-tive tended to improve competition in local phone services, and ii) the US great recession derived from nancial disruptions and the bursting of asset bubbles in the housing market in2007−2009. These ndings are subject to dierent interpretations; however, for regulatory purposes it is relevant to emphasize the fact that an external policy decision-making generated an important contagion eect on Latin America's nancial markets. Avenues for further research should consider an evaluation of Latin America's own policy decision's regulatory impacts on nancial markets and, consequently, on the behavior of investments in their telecommunications sector.
References
[1] Adjasi, C. & Biekpe N. (2006) . Stock Market Development and Economic Growth: The Case of Selected African Countries. African Development Review. April, Vol. 18 Issue 1, p144-161. 18p. 11 Charts.
[2] Billio, M., Caporin, M., & Gobbo, M. (2006). Flexible dynamic conditional correlation multivariate GARCH models for asset allocation, Applied Financial Economics Letters, 2(02), 123130.
[4] Cho, J.H. & Parhizgari, A.M. (2008). East Asian nancial contagion under DCC GARCH. International Journal of Banking and Finance. Volume 6, Issue 1. Article 2. Available at: http://epublications.bond.edu.au/ijbf/vol6/iss1/2
[5] Engle, R. F. (2001). Dynamic conditional correlation: A simple class of multivariate GARCH models, University of California San Diego, Department of Economics.
[6] Engle (R. F.) (2002). Dynamic conditional correlation: A simple class of multivariate generalized autoregressive conditional heteroscedasticity models, Journal of Business Economic Statistics, 20, 339-350.
[7] Engle, R. F. & Sheppard, K. (2001). Theoretical and empirical properties of dynamic conditional correlation multivariate GARCH, National Bureau Economic Research, working paper, No 8554.
[8] Forbes, K.& Rigobon, R. (2000). Contagion in Latin America: denitions, measurements and policy implica-tions, NBER Working Paper, No 7885, September.
[9] Jones, P.M. & Olson E. (2013). The time-varying correlation between uncertainty, output, and ination: Evi-dence from a DCC-GARCH model. Economic Letters 118, 33-37.
[10] Lee, J. ( 2006 ). The comovement between output and prices: Evidence from a dynamic conditional correlation GARCH model. Economics Letters 91, 110116. www.elsevier.com/locate/econbase
[11] Levine, R. (1991). Stock Markets, Growth, and Tax Policy. The Journal of Finance, Vol. 46, No. 4 (September), pp. 1445-1465.
[12] Levine, R. (1997). Financial Development and Economic Growth: Views and Agenda. Journal of Economic Literature, Vol. 35, No. 2 (June), pp. 688-726.
[13] Martins, D. & Galina, S. (2009). Results and Implications of Technological Development in the Telecommuni-cation Industry in Brazil. Journal of Operations and Supply Chain Management, Volume 2 (1), pp 14 - 30, C International Conference of the Production and Operations Management Society
[14] Naoui, K., Liouane, N. & Brahim, S. A. (2010). Dynamic Conditional Correlation Analysis of Financial Con-tagion: The Case of the Subprime Credit Crisis. International Journal of Economics and Finance. Vol. 2, No. 3; August.