A GLOBAL NETWORK OF HYDROACOUSTIC STATIONS FOR MONITORING
THE COMPREHENSIVE NUCLEAR-TEST-BAN TREATY
PACS: 43.10.Qs
Marta Galindo Arranz
Hydroacoustic Officer, Hydroacoustic Monitoring, IMS
Comprehensive Nuclear-Test-Ban Treaty Organization (CTBTO) Vienna Austria
E-mail: marta.galindo@ctbto.org
ABSTRACT
Hydroacoustics is one of the four monitoring technologies of the International Monitoring System (IMS) established under the Comprehensive Nuclear-Test-Ban Treaty (CTBT). The hydroacoustic network, designed to monitor the major world oceans, contains eleven stations located with an emphasis on the vast ocean areas of the Southern Hemisphere. Two different sensing techniques are employed; hydroph one sensors, which effectively cover large ocean areas, but are quite complex and expensive, and seismic detectors on small islands which are less effective, but considerably simpler and cheaper. The hydroacoustic stations transmit data in real time via satellite to the International Data Centre (IDC) located in Vienna, Austria. The IDC analyses the hydroacoustic data in combination with the other three technologies to produce bulletins of detected events for the States Party to the T
RESUMEN
El Tratado de Prohibición Completa de los Ensayos Nucleares (TPCE) es una piedra angular del régimen internacional para la no proliferación de armas nucleares y la base para perseguir el desarme nuclear. La Comisión Preparatoria de la Organización del Tratado de Prohibición Completa de los Ensayos Nucleares (OTPCE), ubicada en Viena, es una organización internacional establecida por los Estados Signatarios del Tratado del 19 de noviembre de 1996. El principal objetivo de la Comisión es el establecimiento de 337 instalaciones que forman el Sistema de Vigilancia Internacional y el Centro Internacional de Datos. Bajo la OTPCE se está estableciendo un sistema global de estaciones de vigilancia para registrar los datos necesarios para la verificación del cumplimiento del Tratado. La red de estaciones de vigilancia será capaz de registrar las ondas de choque generadas por una explosión nuclear subterránea, en el océano o en la atmósfera.
los océanos del mundo, que comprenden el 70% de la superficie de la tierra.Esta red utiliza dos tecnicas diferentes para la deteccion de la enegia acustica; estaciones de hidrofonos y estaciones de fase T. Las primeras son extremadamente sensibles a la detección de ondas acústicas generadas por fenómenos submarinos, incluyendo explosiones que puedan ocurrir a miles de kilómetros. Las estaciones de fase T se incluyeron en la red para mitigar el elevado costo de las estaciones de hidrófonos. Están formadas por equipos sísmicos localizados en pequeñas islas y resultan menos efectivas en la detección de energía hidroacústica. Las estaciones hidroacústicas transmiten los datos en tiempo real al Centro Internacional de Datos (CID), localizado en Viena , Austria. El CIDE analiza los datos en combinación con las otras tres tecnologías y distribuye entre los Estados Signatarios.
1 INTRODUCTION
The Comprehensive Nuclear-Test-Ban Treaty (CTBT), which bans all nuclear explosions throughout the world whether for military or civilian purposes, was opened for signature on 24 September 1996 at United Nations Headquarters. As of July 2003 167 states have signed the treaty with 103 ratifications. A global network of sensors, known as the International Monitoring System (IMS), is being deployed to monitor compliance with the CTBT’ s ban on nuclear explosions. The IMS has been designed to be capable of detecting, locating and identifying signals from nuclear explosions in all possible environments; the atmosphere, underwater or underground.
The IMS network relies on four technologies. Seismic, infrasonic and hydroacoustic stations are employed to detect signals from explosions in the underground, atmosphere and underwater environments. The radionuclide stations can detect radioactive debris from atmospheric explosions or vented by underground or underwater nuclear explosions. The establishment of the IMS network started in April 1997 with the upgrade of some existing stations and the installation of new ones. When complete the IMS network will consist of 321 stations strategically positioned to provide global coverage. The stations transmit data in real time via satellite to the International Data Centre (IDC) located in Vienna, Austria. The IDC analyses and archives the data and produces bulletins of detected events for the States Parties to the Treaty.
The Comprehensive Nuclear-Test-Ban Treaty Organization (CTBTO) maintains a website (www.ctbto.org) which provides information on the treaty and tracks the progress of the establishment of the verification regime.
The hydroacoustic network is one of the monitoring networks of the International Monitoring System (IMS) established under the Comprehensive Nuclear -Test-Ban Treaty (CTBT). The Signatory States of the CTBT have formed a Preparatory Commission to oversee Treaty-related activities until the Treaty enters into force. The Preparatory Commission has established technical requirements, certification standards, and draft operational practices for all four technologies in the IMS.
This paper presents a brief overview of the IMS hydroacoustic network, which is composed of 11 stations: 6 hydrophone and 5 T-phase stations. They are located over the globe with special emphasis in the Southern Hemisphere. Both the hydrophone and T-phase stations are described, and their characteristics highlighted. The establishment of each hydroacoustic station requires a survey, installation planning, manufacture, installation of new equipment, and finally testing and operation of the station. In section 5, the present status of the network implementation is outlined. Examples of data from both types of station are used to show typical background noise and types of signals expected.
2 THE HYDROACOUSTIC NETWORK
water, above water in the low atmosphere, or underground near shore will be detected even at long distances by sensors located in the SOFAR channel.
[image:3.596.139.455.246.547.2]The hydroacoustic network is composed of eleven stations. Six stations will be equipped with hydrophone sensors. The other five stations are located on small, steep-sloped islands and will make use of seismic sensors to detect waterborne energy, which is converted to a seismic wave at the boundary of the island. This type of propagation has long been known to the seismic community, which calls it T-phase propagation. T-phase stations are not as effective in detecting and identifying hydroacoustic signals from explosions, but they are considerably less complex and expensive than hydrophone stations. The mixture of hydrophone and T-phase stations was selected for the IMS hydroacoustic network to provide a cost-effective compromise, as shown in Figure 1.
Figure 1. Hydroacoustic network. The stations are listed in order from west to east on the map.
3 HYDROPHONE STATIONS
All hydrophone stations, except for Cape Leeuwin, are located on relatively small islands. They consist of two undersea trunk cables, each with three hydrophone sensors. Cables and sensors are deployed on opposite shores of the island in order to avoid bathymetric blockage by the island. Each hydrophone sensor has an independent wet-end digitizer. The digital signals are transmitted to the shore facility via a non-repeatered fiber optic cable for processing and transmission by satellite to the IDC in Vienna (Figure 2).
Hydrophone stations: Juan Fernandez Island Ascension Island Crozet Islands Chagos Archipelago Cape Leeuwin
Figure 2. Schematic of a typical hydrophone station showing the triplet of hydrophone sensors, the fiber optic trunk cable, the shore facility and the satellite link to the IDC in Vienna.
The hydrophone sensors are placed at or near the axis of the SOFAR channel, using a subsurface float and an ocean-bottom anchor. To provide the station with directional capabilities, the three hydrophones are placed in a triangular configuration and each sensor is separated horizontally by approximately two kilometers. The frequency band of the hydrophone station is from 1 to 100 Hz.
The principal threats to long and reliable operation of hydrophone stations are possible damage to the cables at the land-sea interface and possible cable breakage caused by anchoring and trawling activities. The station design uses well-developed techniques for cable laying and protection, including cable burial at the surf zone, armoring of the cable, and split pipe protection. These techniques all serve to enhance the potential lifetime of the stations.
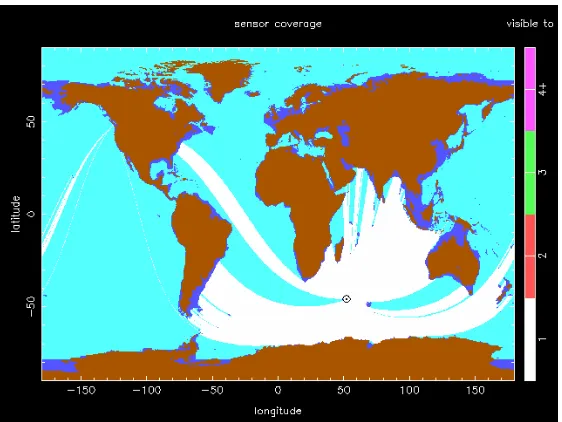
Figure 3. Model calculations of the field of view (lightest area) at the hydroacoustic station in Crozet Islands.
4 T-PHASE STATIONS
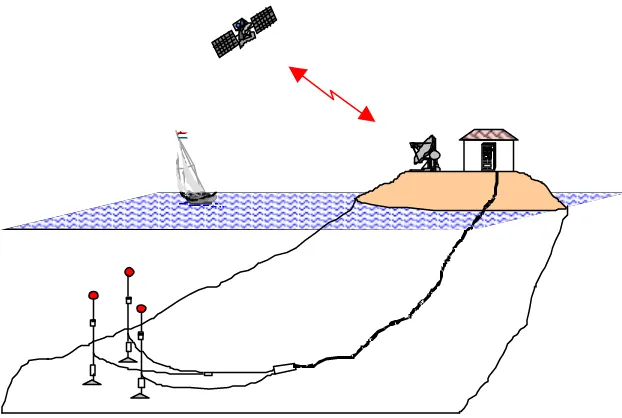
[image:5.596.157.438.101.312.2]A T-phase station uses seismometers to detect seismic waves generated by the coupling of waterborne energy at the flanks of the island4. Each station is composed of one to three seismometers and a data acquisition system. As in the case of the hydrophone stations, the data are formatted and transmitted by satellite in real time to the IDC. Figure 4 is a schema of a typical T-Phase Station showing the seismic and hydroacoustic signal paths from an underwater event, the shore facility with the seismometer and the satellite link to the IDC in Vienna.
Figure 4. Schematic of a typical T-Phase Station showing the seismic and hydroacoustic signal paths from and underwater event, the shore facility (sensor) and the satellite link to the IDC in Vienna
The absorption of acoustic energy in the ocean is very small, compared to the absorption of seismic energy propagating through the Earth itself (in which there is high absorption of the higher frequencies). Hence the T-phase signals will have considerably more energy at the higher frequencies than do regular seismic signals. As a consequence, T-phase stations are designed to operate in the frequency band from 0.5 to 45 Hz, which is higher than the normal range used for seismic signals.
Hydroacoustic path
5 STATUS OF THE HYDROACOUSTIC NETWORK
The implementation of the IMS network is performed in four phases: site survey; manufacture and installation; certification; and operations and maintenance.
5.1 Site Survey
A site survey is carried out to assess the suitability of the site for hosting a station and to identify any specific conditions that would impact the station design. The results of the site survey are used to determine the exact sensor locations.
5.2 Manufacture and Installation
Typically a single contractor is selected, through an international tendering process, to be responsible for the station design, manufacture, installation, and testing.
5.3 Certification to CTBT Standards
The Preparatory Commission has set a number of required standards that a station must meet in order to be certified as a valid station within the IMS network. The Comprehensive Nuclear-Test-Ban Treaty Organization (CTBTO) carefully reviews all aspects of each station to ensure that it meets the required standards.
5.4 Operation and Maintenance
Once the station is certified, operations and maintenance agreements are established between the CTBTO and a Station Operator. Long term quality monitoring is then undertaken to ensure high standards of dat a quality, data availability, and station performance.
5.5 Current Status of Implementation
Although two of the six hydrophone stations (Wake and Ascension) and one of the five T-Phase stations (Queen Charlotte) existed prior to the Treaty, each of these stations requires a major upgrade (effectively a completely new station) in order to meet Preparatory Commission standards.
As of July 2003, the site survey phase has been completed. All locations for hydroacoustic stations have been surveyed.
The installations of four hydrophone stations have been completed, HA01 Cape Leeuwin, HA03 Juan Fernandez, HA04 Crozet Island, HA08 Chagos Archipelago and one is underway HA10 Ascension Island. The HA02 Guadeloupe T-phase station is completed. The other four are in the process to be installed at the end of 2003 or begin of 2004.
At the present time a total of three hydroacoustic stations are certified; two hydrophone stations HA01 Cape Leewin and HA08 Chagos Archipelago and one T-phase station HA05 Guadaloupe.
6 HYDROACOUSTIC SIGNAL CHARACTERISTICS
Hydroacoustic signals are changes in the water pressure generated by sound waves. Due to the efficient transmission of sound in the ocean, low-amplitude signals are detectable at very long distances. The primary operational objectives of the IMS hydroacoustic network are the detection, location and characterization of impulsive signals from nuclear explosions. Acoustic signals are also produced by human activities like seismic profiling for oil exploration or military exercises, as well as by natural sources such as volcanic eruptions or underwater earthquakes.
located in Socorro Island, Mexico and the other one detected by one of the triplet of hydrophones installed in BIOT / Chagos Archipelago.
6.1 T-phase Detection of Acoustic Energy Generated by an Earthquake Close to an Oceanic Trench
T-phase signals are seismic waves det ected by seismometers, which have traveled most of their propagation path through the ocean, within the SOFAR channel. As a consequence they have a relatively high frequency content. Because very low frequency energy does not propagate well in the SOFAR channel these signals do not have significant energy below 2 Hz. They can be characterized as non-impulsive signals with long duration wave trains, sometimes over 100 seconds, and most energy in the frequency range from 2 to 20 Hz. (Note that signals from underwater explosions will have significant energy at even higher frequencies, but in this instance we are considering a natural event).
The signal detected on a T-phase station depends on the nature of the coupling of the energy from the ocean to the island. Some of the important factors include the geology of the island, the nature of the adjacent bathymetry, and the direction of the signal. Further, the sensor may be located close (within a few wavelengths) of the conversion region, which complicates the analysis5.
The following example of a T-phase signal uses data recorded at Socorro Island during the site survey in June 1999, using instrumentation which meets the same specifications as the sensor and data acquisition system that will be installed at the station.
For a seismic event with an oceanic path between the source and receiver, one can expect the P, S, and T-phases to arrive in this time order. Arrival time differences and estimates of the propagation speed of the different phases can be used to estimate the range to the event.
In some cases the T-phase signal is not evident in the data record without the application of additional processing and filtering. If the P and S arrivals are detected, the average speed of ~1.49 km/s for the SOFAR channel can be used to define a time window where a T-phase signal may be present. Then data filtering and processing can focus on this segment to reduce the low frequency energy and enhance the higher frequency energy content of the T-phase signal.
Figure 5. Time series at Socorro Island for the Guatemala Event described in the text. The vertical component (top) has been band pass filtered (0.01-0.1 Hz) to highlight the P and S arrivals; the horizontal are band pass filtered (2-20 Hz) to
emphasize the T-phase arrival.
Figure 5 plots the three components of the measured displacement, which are from top to bottom, vertical, North-South, and East-West. The vertical component record has been filtered with a band pass filter of 0.01-0.1 Hz, so the P and S arrivals are clearly evident. The two horizontal components have been filtered with a band pass filter of 2-20 Hz, to emphasize the energy of the T-phase signal.
Figure 6. Locations of the Guatemala Event epicenter and Socorro Island.
It is evident from Figure 5 that the energy of the T-phase starts arriving at 07:31:35 and ends at 07:33:31 with the peak amplitude for the horizontal N-S component at 07:33:02. These times are consistent with the above approximate arrival time calculation.
Figure 7. Spectrogram of the signal at Socorro Island for the Guatemala Event. The spectrogram represents the 3-Components filtered with a band pass filter (2-20 Hz). At the top the vertical component, at the middle the N-S component
and at the bottom the E-W component.
[image:9.596.178.408.375.613.2]The T-phase arrival can be clearly seen (between 1250 and 1350 seconds) in the records from all three components of the seismometer. The frequency content of the T-phase signal is between 2-10 Hz, as is expected for T-phase signals from earthquake events (where there is usually a significant path length before the energy is reaches the ocean). Because the spectrograms are scaled individually for each component they cannot be used to compare the signal magnitudes of the components. (The horizontal N-S component shows high levels of background energy between 4 and 7 Hz, which is in the centre of the band of frequencies of interest for detection of natural T-phase signals.)
Figure 8 shows the power spectral density for the T-phase signal of the Guatemala Event for each of the three components. The solid line is the power spectral density of the signal. The dotted line represents the power spectral density of background noise from a window 1.5 times the length of the signal, at a time just prior to the event. The signal is significantly above the noise in the frequency interval of 2-15 Hz. The N-S displacement component shows the highest values for both the signal and the background noise.
Figure 8. Power spectral density versus frequency of the signal (solid line) and the noise (dotted line) for the 3-components at Socorro Island for the Guatemala Event.
Figure 9. Signal to noise ratio for the 3 components at Socorro Island for the Guatemala Event. The vertical component is represented with a solid line, the horizontal N-S with a dot line and E-W with a dash line.
6.2 Hydrophone Detection of Acoustic Energy Generated by a Submarine Earthquake
Submarine earthquakes also couple energy into acoustic phases in the Ocean. Under proper bathymetric conditions, the acoustic energy is trapped in the SOFAR channel and propagates efficiently to very long distances6. The IMS hydrophone sensors are located close to the axis of the SOFAR channel, in order to provide optimum detection to these events, when no acoustic blockages are present along the path.
Figure 10. Time series for the three hydrophones at the north triplet in the hydrophone station at BIOT/Chagos Archipelago for the Southwest Indian Ocean Event described in the text.
[image:11.596.179.412.397.637.2]estimate. The signals last for more than 60 seconds and the peak amplitude arrives at 22:56:45. These long wave trains are characteristic of submarine seismic events, and result from coupling of energy at the source region, over a broad area with bathymetric promontories.
[image:12.596.161.435.214.421.2]Figure 11 shows the location of the epicenter relative to the north triplet of hydrophones at HA08. The acoustic energy travels for 3406 km without any evident acoustic blockage. Considering an average value of sound speed in the water ~ 1.49 km/s, the expected arrival time is 22:56:38, consistent with the actual arrival time.
Figure 11. Locations of the Southwest Indian Ocean Event epicenter and the north triplet at BIOT/Chagos Archipelago.
Figure 12. Power spectral density versus frequency of the signal (solid line) and the noise (dotted line) for the 3 hydrophones at BIOT/Chagos Archipelago for the Southwest Indian Ocean Event.
Because the propagation properties of the ocean are relatively consistent, the signals detected at each of the hydrophone have similar properties. Thus a cross correlation function can be used to obtain the time difference of arrivals for the three possible hydrophone pairs. Figure 14 shows the cross correlation functions for the three hydrophones combinations, 1 to 2, 1 to 3 and 2 to 3. The cross correlation peaks show that sequence of arrivals at the triplet is first at hydrophone 3, then 1 and finally 2. From the geometry of the triplet, the azimuth of the signal source arrival can be calculated within a few degrees.
[image:13.596.207.390.445.598.2]Figure 14. Cross correlation function between signals in hydrophone 1 and 2 on the top, hydrophone 1 and 3 in the middle and hydrophone 2 and 3 at the bottom
7 CONCLUSIONS
Although there are many outstanding challenges, progress is being made in implementation of the IMS hydroacoustic network. For the hydroacoustic network as of July 2003, all site surveys are completed and installations are completed for four new hydrophone stations and one new T-phase station, and there has been substantial progress towards completion of one additional hydrophone station and four additional T-Phase stations.
It is informative to compare the two event detection examples presented above, which are both good event detections for the respective type of station. It is clear that the information that can be extracted from hydrophone data is not difficult to interpret. The frequency content goes up to 100 Hz, the signal to noise ratios are high and, importantly, correlation between the hydrophone signals will give directionality.
Measurements during the survey at Socorro Island T-phase station have shown the capability to detect a T wave, which traveled more than 2000 km from the event epicenter. It is believed that this stat ion will provide good coverage for events generated in the South Pacific, events that arrive along the south shore of the island.
Additional research would be of benefit in understanding T-phase station performance. For example, although complicated by site dependent factors such as island geology and bathymetry, it will be of interest to identify the types (P or S) of waves that are generated upon acoustic to seismic transition. This would elucidate the advantages of a single vertical versus three component sensors. Also future investigation is needed to develop techniques to determine the azimuth of the incoming signals.
The hydrophone station, HA08, in the Indian Ocean, provides good coverage over broad areas of this ocean. Over the time that data has been received by this station, its performance has been excellent. Its contribution to the accuracy in detection and localization and characterization of events will greatly enhance IMS capabilities in the underwater environment.
References
1. R. J. Urick,Principles of Underwater Sound, 3rd ed. McGraw-Hill, New York 1983
3. F. Jensen, W. Kuperman, M. Porter and H. Schmidt, Computational Ocean Acoustics, AIP SERIES in modern Acoustics and Signal Processing, New York, 1994
4. Talandier and Okal “On the Mechanism of Conversion of Seismic Waves to and from T waves in the Vicinity of Islands Shores” BSSA –(88) 621-632
5. Piserchia et al.” Hybrid numerical modelling of T-wave propagation: Application of the Midplate experiment” Gephys. J. Int (1998) –(133) 789-800