THE DEPENDENCE OF SOUND ABSORPTION BY AN ISOLATED
ACOUSTIC RESONATOR ON THE RESONATOR’S VOLUME
PACS REFERENCE: 43.55.Ev
Stauskis Vytautas J.
Vilnius Gediminas Technical University Sauletekio al. 11, LT-2040
Vilnius. Lithuania Tel: 370 2 765 797 Fax: 370 2 700 498 E-Mail: stauskis@ar.vtu.lt
ABSTRACT
The paper examines the volume dependence of sound absorption by an isolated acoustic resonator with a cross-shaped slit between the planes. The character of change in the imaginary parts of the volume impedance are little dependent on the increase in the resonator’s volume. As regards sound absorption, the increase of the resonator’s volume through increasing its area, with the height being constant, is more effective. Resonator absorbs sound energy well at the low frequencies
1. INTRODUCTION
Resonant sound absorbing structures are used in designing acoustics of halls. The structure consists of a thin shield having round or rectangular holes several millimetres in diameter. There is an air gap behind the shield to be filled with a sound-absorbing material without which sound absorption of such a resonant structure would be very small. Using such structure one may control reverberation times of various rooms. However, part of the energy of the incident sound wave is absorbed by the flat structure, while another part is reflected directionally. Such or similar resonators were studied by U. Ingard [1], F.P. Mechel [2], B. Brouard [3], J.F. Allard [4] and other authors.
One may use isolated acoustic resonators with a large slit of varied shapes and fixed volume and area. The resonators may be placed on the wall or ceiling planes at set distances between them. Only sound reflecting materials may be used for the resonators. Such resonators will both absorb sound energy and disperse sound waves of different length. This is important for acoustic purposes because the characteristics of a diffusive field will be improved.
The purpose of the work is to examine changes in sound absorption by a large isolated acoustic resonator with a cross-shaped slit in two cases: when the volume of the resonator is increased by increasing its height or, alternatively, by increasing its area. No additional sound absorbing materials are used.
2. THEORY
Figure 1. Computational Diagram of an Isolated Acoustic Resonator with a Cross-shaped Slit where the Resonator Volume V1 Varies with the Increase in Its Height H1 and the Resonator Volume V2 Varies with
the Increase in Its Length and Width
Both the main resonance and the overtones, i.e. the odd harmonics and added air bodies both inside and outside the slit, will be assessed in the resonator.
The sound absorption by an isolated acoustic resonator with a cross-shaped slit is calculated from the following formula [5]:
r m r
S
Z
Z
Z
c
A
2 0 0Re
4
+
ρ
=
(1)where ρ0 is the air density; c0 is the sound velocity in the air; ReZr is the real part of the radiation
impedance; Zr is the resonator’s radiation impedance; Zm is the slit impedance; and Sr is the slit
area.
In order to calculate the sound absorption by the resonator, the real part of the radiation impedance, the radiation impedance and the impedance of the slit must be calculated.
The radiation impedance of the resonator will be calculated from the following formula:
( )
∫
∫
πϕ
π+ ∞γ
ϕ
γ
γ
π
ρ
=
j r rD
v
v
S
k
c
Z
02 02 22 0 2 2 2 2 0
0
d
,
sin
d
4
(2)
where k is the wave number; <ν> is the average air particle fluctuation rate throughout the resonator’s area; ν0 is the velocity of the moving point for which the radiation impedance is to be
determined; and D(γ,ϕ) is the directivity diagram of the resonator’s radiation.
The angles γ and ϕ as well as the directivity diagram may be found in [5].
The real part of the radiation impedance is calculated from the formula
[
]
[
]
∫
∫
π πγ
γ
ϕ
γ
ϕ
γ
⋅
ϕ
γ
ϕ
γ
×
ϕ
π
ρ
=
02 2 2 2 22 2 2 2 2 2 2 0 2 2 2 0
0
sin
d
sin
sin
sin
sin
sin
cos
sin
cos
sin
sin
d
4
Re
d
k
kd
l
k
kl
S
k
c
Z
r r (3)The hole impedance Zm consists of four parts and is calculated from the formula:
where Zm0 is the slit impedance; Zma is the slit impedance of the added air body outside the slit;
Zmi is the slit impedance of the added air body inside the slit; and Zv is the impedance of the
resonator’s body.
The slit impedance Zm has the following final expression:
(
)
v r r r mZ
S
u
t
u
t
j
Z
S
u
t
u
Z
+
ω
ρ
η
π
+
+
∆
+
ωρ
+
+
ω
ρ
η
ρ
π
+
=
0 0 0 08
4
2
1
8
4
(5)where ρ0c0 is the real part of the radiation impedance that is strongly dependent on the geometry of the slit; the latter also determines the correction 2 t; and Zv is the impedance of the
resonator’s body and is calculated from the formula
V
H
S
kH
Z
Z
Z
kH
Z
Z
Z
v⋅
r+
+
=
coth
coth
0 1 0 1 0 (6)where k is the wave number between the plane and the ceiling; H is the distance between the plane and the ceiling; Z1 is the impedance of the rigid ceiling surface; V is the resonator’s
volume; and S is the resonator’s area.
The last factor in this formula is the ratio of the air column formed by the slit area and the body of the resonator. Sr is the volume of the air plug, not of the whole resonator, with the
width equal to the slit width and the height equal to the resonator’s height. One must make a distinction between the resiliency of the whole air body and the fluctuating air body. The air resiliency is described by the volume and height of the closed air body, while the fluctuating mass is described by the air in the hole plus the added air body. When the slit is wide the added air mass is little dependent on frequency. The resonance takes place when the air resiliency is equal to the fluctuating air mass. The resonance occurs because the air column pressure varies with the impedance of the added air mass inside the slit, whereas pressure is variable throughout the resonator’s body. Thus, the above factor describes the transfer of pressure to all parts of the resonator’s body. With the sound absorption coefficient of the ceiling being α,
x
x
Z
Z
−
+
=
1
1
0 1 (7)where χ= √ 1-α is the reflection coefficient.
Thus the body of the resonator may be constructed by increasing its height, with the area being constant, and by increasing its area, with the constant height. Which case is better from the point of view of absorption?
3. RESULTS OF CALCULATIONS
Two alternatives of changing the volume of the resonator were selected for calculations: a) the volume was increased by increasing the resonator’s height. The height was 60, 180 and 240 cm, and the volume 2.6, 7.77 and 10.3 m3 respectively. The area of the resonator was constant and equalled 2.4 x 1.8 = 4.32 m2; b) the volume was increased by increasing the resonator’s area, with a constant height of 60 cm. The area changed from 4.2 x 3.0 = 12.6 m2 to 4.8 x 3.6 = 17.28 m2, with the volumes 7.77 and 10.3 m3 respectively. In all cases the slit width was equal to 30 cm.
0 0.5 1 1.5 2 2.5 3 3.5
8 10 13 17 21 27 35 45 58 74 95
122 156 200 257 330 423 543 697 895 1149 1474 1892 2428 3117 4000
Frequency , H z
Absorption
, m2
[image:4.596.179.417.126.271.2]1 2 3 4 5
Figure 2. The Dependence of Sound Absorption by an Isolated Acoustic Resonator on Frequency and
Volume: 1 – h = 60 cm; 2 – h = 180 cm; 3 – h = 240 cm – volume increases on account of height increase with constant area; 4 – S = 4.2 x 3 m2 = 12.6 m2; 5 – 4.8x3.6 m2 = 17.28 m2 – volume increases on account of area increase with constant height of 60 cm
The results of calculations show only slight changes in sound absorption when the resonator’s height is increased with the resonator area being constant. When the height of the resonator is 60 cm, the maximum absorption of ~2 m2 is obtained at 35 Hz. As the height is increased the maximum absorption of ~2 m2 is found at very low frequencies. In the latter case resonances are observed in the frequency range of 71 to 300 Hz at which sound absorption is markedly decreased.
[image:4.596.168.431.531.674.2]When the volume is increased on account of increase in the resonator’s area there is a significant increase in sound absorption. With the areas being 7.77 and 10.3 m3, the maximum absorption is found at 17-20 Hz and amounts to 2.9 and 3.4 m2 respectively, compared to 2 m2 in the above case. As frequency increases there is a uniform decrease in absorption and no resonant phenomena are observed.
Figure 3 depicts changes in the real parts of the impedance of the resonator’s body indicating losses of sound energy.
-1 -0.5 0 0.5 1 1.5 2 2.5 3 3.5
8 10 13 17 21 27 35 45 58 74 95
122 156 200 257 330 423 543 697 895
1149 1474 1892 2428 3117 4000
Frequency , H z
lg
I
Zv
I
1 2
3 4 5
Figure 3. The Volume Dependence of the Real Part of Impedance of an Isolated Acoustic Resonator’s
As the volume of the resonator is increased by increasing its height, there is a uniform decrease in the real parts of the impedance up until 160 Hz. Starting from this frequency, the repetition rate of the resonances is increased. As the resonator’s volume is increased on account of area, the real parts also decrease uniformly with the increase in frequency. However, in this case the resonances become less frequent, while their amplitudes become larger.
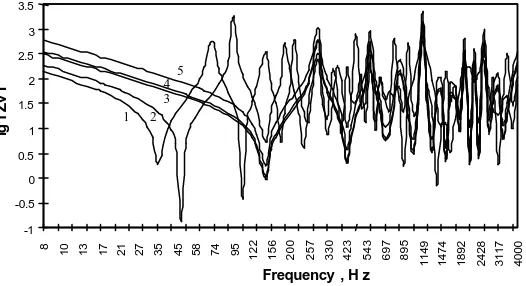
The imaginary part of the impedance describes the reradiation energy which is equal to zero at the time of the impedance. Figure 4 shows the change in the imaginary parts of the volume impedance.
-2.5 -2 -1.5 -1 -0.5 0 0.5 1 1.5
8 10 13 17 21 27 35 45 58 74 95
122 156 200 257 330 423 543 697 895 1149 1474 1892 2428 3117 4000 Frequency , H z
lg
I
ImZv
I
1 2 3
[image:5.596.153.440.188.344.2]4 5
Figure 4. The Volume Dependence of the Imaginary Part of Impedance of an Isolated Acoustic
Resonator’s Body: 1 – h = 60 cm; 2 – h = 180 cm; 3 – h = 240 cm – volume increases on account of height increase with constant area; 4 – S = 4.2x3 m2 = 12.6 m2; 5 – 4.8x3.6 m2 = 17.28 m2 – volume increases on account of area increase with constant height of 60 cm
When the volume of the resonator is increased by increasing its height, there is a sharp decrease in the imaginary parts of the impedance up until 160 Hz. Afterwards repetitive resonances take place, with their frequency increasing. As the volume is increased on account of area, resonant frequencies occur earlier. In both cases the increase in frequency does not produce marked influence over the character of change in the imaginary part of the impedance.
4. RESULTS OF THE EXPERIMENT
The experiment was conducted outdoors on a level ground. A quiet day was chosen. The resonator scaled 1:1 was constructed of wood shaving plates 18 mm thick, with small sound absorption coefficients of 0.02 to 0.05 throughout the frequency range. Two heights of the resonator, 60 cm and 180 cm, were adopted. The investigations were carried out at five points inside the resonator. The from and dimensions of the resonator are shown in Figure 5.
Figure 5. Schematic Representation of an Isolated Resonator with a Cross-shaped Slit. S – sound source.
[image:5.596.179.414.586.686.2]While assessing the irregular decay of the resonator’s sound field as described above, the reverberation times at different measurement points were approximated from 0 to –10, 15, -20 and – 25 dB. The results differ, especially at low frequencies. Here the results of the case when the reverberation time was approximated from 0 to –25 dB are presented.
The graph shows that the reverberation time increases with the increase in the resonator’s volume, however, only at frequencies exceeding 400 Hz. The largest differences are obtained at medium and high frequencies. For example, at 500 Hz the reverberation time of a 2.6 m3 resonator is equal to 0.3 s, while that of a 7.77 m3 resonator is 0.55 s.
The reverberation time values obtained were used to calculate the sound absorption coefficients of and the sound absorption by the resonator. The results are presented in Figure 6.
0 0.05 0.1 0.15 0.2 0.25 0.3 0.35
100 160 250 400 630 1000 1600 2500 4000
Frequency, Hz
Absorption coefficients
2
[image:6.596.196.400.224.329.2]1
Figure 6. The Dependence of Sound Absorption Coefficients on Frequency and Resonator’s Volume. 1
-height 60 cm, volume 2.6 m3; 2 - height 180 cm, volume 7.77 m3
The graph shows that the largest sound absorption coefficient values are obtained at low frequencies. The values increase with the increase in the resonator’s frequency. When the frequency exceeds 400 Hz the coefficients are little dependent on the change in volume. This may be related to volume and surface area differences. Of course, the results would be different if the sound field decay would be approximated at another level interval and at other measurement points.
5. CONCLUSIONS
1. From the standpoint of sound absorption, increasing of the resonator’s volume by increasing its area, with the height being constant, is more effective.
2. As the resonator’s volume is increased on account of the increase in its area, the resonances of the impedance’s real parts start at ever lower frequencies, while their amplitudes have larger values compared with the case when the volume is increase on account of height.
3. The character of change in the imaginary parts of the resonator body impedance is little dependent on the increase of the resonator’s volume. When the volume is increased on account of area, resonant phenomena tend to start at lower frequencies.
4. After the volume of the resonator is increased three times (from 2.6 m3 to 7.77 m3), both absorption coefficients and absorption area become larger, mostly at low frequencies.
REFERENCES
2. F.P. Mechel “About perforated metal sheets on absorbing layers” Acustica - acta acustica 1, 1993, 175 p.
3. P. Guignouard, M. Meisser, J. F. Allard, P. Rebillard, C. Depollier “Prediction and measurement of the acoustic impedance and absorption coefficient at oblique incidence of parous layers with perforated facings“ Noise Control Eng. J. 36 1991, 129 p.
4. J.F. Allard “ Propagation of sound in porous media” Elsevier Applied Science 1993, 129 p.