OPTIMALIZATION OF THE ACOUSTO-OPTICAL NDT TECHNIQUE
FOR THIN COATING EVALUATION
PACS REFERENCE: 43.35 ZC
Windels F.1, Van Den Abeele K.1; Wevers M.2
1
Interdisciplinary Research Center, Catholic University Leuven Campus Kortrijk E. Sabbelaan 53, B-8500 Kortrijk, Belgium
Tel: +32.56.246.207; Fax: +32.56.246.999;
E-mail: filip.windels@kulak.ac.be, koen.vandenabeele@kulak.ac.be
2
Dept. MTM, KULeuven, Kasteelpark Arenberg 44, B-3001 Heverlee, Belgium Tel.: +32 16 321303 E-mail: Martine.Wevers@mtm.kuleuven.ac.be
ABSTRACT. The acousto-optic technique can be used to evaluate coated substrates (Appl. Phys. Lett. 68, 1732 (1996 by interpreting the optically detected phase dependence of the reflected ultrasonic beam on the coating parameters. Recently a fully analytical model (J. Acoust. Soc. Am. 110(3), 1349, (2001)), based on normal mode theory, was developed to support this technique. The model provides a transparent expression for the phase shift between the reflected and the incident field due to the presence of thin coatings (thickness much smaller than the ultrasonic wavelength). Given the analytical nature of this new theoretical description, the following suggestions can be made to improve the sensitivity of the acousto-optic technique: The phase sensitivity can be enhanced by measuring further away in the reflected profile and by working at higher frequencies. When the sample is not perfectly horizontally aligned with the scan direction, an overall non-zero slope of the phase curves is observed which masks the influence of the coating on the phase. This artefact can be overcome by combining the phase data obtained at two different frequencies. All of these predictions have been experimentally verified.
INTRODUCTION
Ultrasonic methods have found a wide range of application in the field of Non Destructive Testing (NDT) [1]. For example the evaluation of thin opaque coatings, which cannot be examined by conventional optical methods, constitutes a fruitful topic of acoustical research [2,3,4,5,6]. For instance, Devolder et al.[2,3,7] generated a Rayleigh wave by insonifying a semi infinite substrate under its Rayleigh angle. When there is no coating present, a reflected wave is observed consisting of two parts [8]: the specularly reflected beam and a leaking field, somewhat shifted in space and exponentially decaying in amplitude. Moreover, these two waves are 180 degrees out of phase and are separated by a zone with no disturbance, the so called null-zone. The presence of a coating changes this behaviour drastically: the two reflected parts come closer and finally overlap (the null zone disappears) and the phase difference between them is no longer 180 degrees. Changes in the characteristics of the reflected profile can be interpreted in terms of variations in the coating parameters.
Changes in the phase characteristics of the reflected field appear to be far more sensitive to the coating parameters than the more conventional techniques based on amplitude information. Preliminary results[2,3] attempted to correlate the observed phase change with the parameters of the coating. To support this, a Fourier beam model[8] was developed to describe the incident bounded beam. Using the transfer matrix method[10] - modelling the coating - the reflected beam profile was numerically simulated and its corresponding phase difference was predicted. Another recently reported theoretical approach is based on normal mode theory[11,12]. In contrast with the numerical character of the Fourier method, this normal mode model has the advantage that it provides analytical expressions for the phase shift, which are easy to interpret and directly suggest ways to improve the sensitivity of the acousto-optic technique.
The structure of this paper is as follows: in a theoretical section, the important formulas of the new theoretical approach are outlined. Then, experimental verifications of the theoretical assertions are performed, and finally conclusions are drawn.
THEORY
In [11,12] a normal mode approach was developed to calculate the phase in the reflected profile from a coated substrate. The phase
ϕ
in the secondary lobe of the reflected beam, measuredat the plate surface, is given by (for a coating thickness much smaller than the ultrasonic
wavelength):
( )
x
=
f
2d
x
F
ϕ
, (1)where F is a function of the sample substrate, the coating density and the coating velocities [11], x is the position along the plate surface with respect to the central point of incidence, f is the frequency and d is the thickness of the coat layer. First of all, this formula states that thicker coatings yield higher phase shifts (linear d-dependency). Secondly, we note that the phase depends on the material properties of both coating and substrate (F-dependency). Finally this formula allows to optimise the beam parameters in order to obtain maximal phase sensitivity: higher frequencies and measuring further away in the second lobe (larger x) enhances the phase shift.
The phase
Φ
which is detected at the photodiode contains an additional term linear in the frequency due to the phase gathered along the propagation path from the surface up to the laser detection point (and from the emitting transducer to the surface). Therefore the phase detected at the photodiode can be written as:( )
f
=
af
+
bf
Φ
2(2)
where
a
=
d
x
F
and b contains the propagation path source-sample and sample-detection. Eq. (2) is quite important as it shows that the coating information is entirely contained in the quadratic frequency dependent part of the phase, and can be separated from the linear frequency dependent contribution to the phase containing the information about the distance of the sample to the detection point. If this distance is not constant during a scan, for example if the sample is not exactly oriented parallel to the scan direction, this will give rise to a changing phase even when there is no coating present. Nevertheless Eq. (2) allows one to separate the coating characteristics from the geometrical information. Therefore, we can measure the respective phasesΦ
1 andΦ
2 measured for two different frequencies f1and f2(withf
2=
rf
1),i.e. :
(3a) 2 2 2 2 1 2 1 1
bf
af
bf
af
+
=
Φ
+
=
Φ
(3b)and we consider the following linear combinations L1 and L2:
(4a)
(
)
( )
1Expression (4a) is independent of the geometrical influences (which are contained in the parameter b), whereas expression (4b) solely depends on the geometry (it does not contain the coating parameter a).
EXPERIMENTAL RESULTS Experimental setup
In order to verify the above mentioned theoretical predictions, the following experiment has been performed. An alumina plate of 1.52mm was covered at its top and bottom by a 50µm thick layer of paint. Part of the plate was left unpainted to allow the possibility of observing the change in phase during a scan from the uncoated region to the painted region. A circular transducer with a diameter of 12mm, center frequency 3.5MHz and bandwidth from 3-4.5 MHz was used. This transducer insonifies the plate at the Rayleigh angle of the uncoated alumina plate. The reflected beam consists of two lobes separated by a null zone. The phase in the secondary lobe is measured acousto-optically. This diffracted laser beam passes through the second lobe and its intensity is measured by a photo-diode. The received signal is a copy of the temporal sound signal (reference) and hence contains also its phase information. The phase is collected for every scan point and in this manner a line-scan of the alumina surface can be performed. The line scans always start at the unpainted zone and end a few cm into the painted region. In this way, an abrupt change in phase can be expected at the transition unpainted-painted alumina.
Influence of the measurement position in the secondary lobe
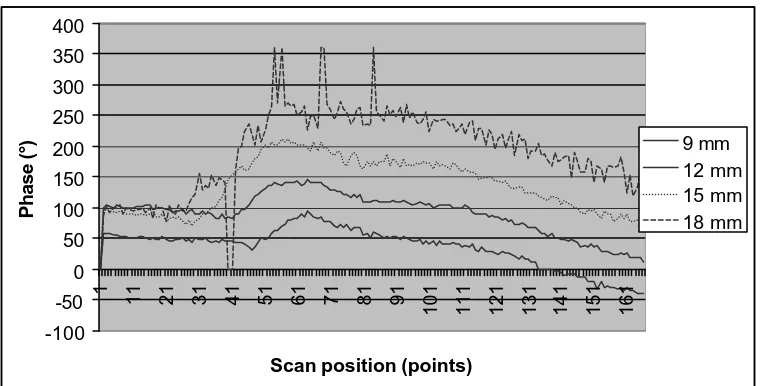
Eq. (1) suggests that measuring further into in the secondary lobe will give rise to a higher phase shift. In order to verify this, line-scans were repeated for different phase detection positions. The results are shown in Fig. 1. The thick full line corresponds to the line-scan phase data for a detection in the second maximum of the reflected beam (This is at 9 mm from the point where the center of the incidenting beam strikes the surface.). The sudden increase in phase at the position 80 (arbitrary units) indicates the beginning of the coating and can be used as a tool for coating characterization. Measuring the phase further away from the center of the incidenting beam clearly shows a greater sensitivity (up to a factor of three) to the presence of the coating. The phase sensitivity is linearly rising with the detection point (as predicted by Eq. (1)) for larger detection distances (12,15,18 mm). However measuring too far away in the secondary lobe reduces the SNR as can be seen in the upper curve for a detection at 18mm. We also note that the phase jump starts earlier for the larger detection positions as these will obviously feel the coating earlier during the scan.
Influence of the frequency
Eq. (1) also indicates a phase sensitivity which is quadratic in the ultrasonic frequency. This was checked by repeating the same line-scan for different ultrasonic frequencies. The results are shown in Fig. 2. It is clearly seen that rising the frequency enhances the phase sensitivity. The quadratic frequency dependency, as predicted by Eq. (1), is also verified: raising the frequency by a factor of 1.5 implies an increase of the phase shift not by a factor 1.5 but by approximately a factor 2.25. This enhanced sensitivity can be understood by realizing that the Rayleigh wave for higher frequencies has a smaller wavelength. As the penetration depth of Rayleigh waves is of the order of its wavelength, the surface wave will be more localised inside the coating for higher frequencies and consequently it will be more sensitive to its presence. Remark that the phase has a small negative slope just before reaching the coated zone. This is connected to the fact the sample is not aligned exactly parallel to the scan direction. We will deal with this problem in the next paragraph.
Influence of the misalignment on the phase
If the sample is not aligned horizontally with the scan axis, a complicating phenomenon occurs, because the distance between the plate and the transducer changes. This means that the propagation path transducer-plate and plate-laser alters during a scan and hence also the accumulated phase along the propagation path. This extra contribution to the phase is of an entirely geometrical type and can easily be corrected for (see Eq. (2)). Even a small misalignment angle can influence and complicate significantly the phase curves. Remember that the ultrasonic wavelength in water is smaller than 0.5mm for the considered frequency range. This means that for a plate orientation which deviates from the horizontal direction by as little as 0.5 mm over a scan distance of say 5cm (which will correspond to a misalignment angle of 0.5°), will produce a total phase rise of 720° during the scan, even for an uncoated sample. As an example, the behaviour of the phase curves when the plate is not very good aligned is shown in Fig. 3. The figure shows the same line-scan for two different frequencies: 3 and 4.5 MHz. The non-horizontal orientation of the plate is clearly visible (reflected in the non-zero average slope of the phase curve). Moreover the misalignment seems to severely mask the phase step due to the coating. This is especially the case for the less sensitive lower frequency of 3 MHz.
The previous figures 1-2 were not really suffering from this non-zero slope behaviour because the sample was carefully aligned prior to performing the final scan.
Separation of the geometry from the coating properties
From a practical point of view, it would be interesting to avoid the time-consuming alignment procedure. Eqs. (4a) and (4b) offer an opportunity to do this. Indeed, the contribution of the propagation path to the phase is linearly dependent on the frequency, whereas the contribution of the coating properties is quadratic in the frequency. Hence one can expect that by performing experiments at two frequencies, the linearly varying part related to the misalignment can be separated from the quadratic part connected to the coating properties. This procedure of separating the linear from the quadratic part of the phase curves discussed in Figure 3, is illustrated in Figures 4-5. Fig. 4 shows the quadratic part of the phase as determined by expression (4a). The non-zero slope has fully disappeared and the transition from unpainted to painted alumina is nicely resolved. In Fig. 5, the linear contribution to the phase, as deduced from Eq. (4b), is plotted. This part of the dual frequency scan contains only the information regarding to the misalignment angle of the sample. This procedure allows to separate geometrical influences on the measurement (such as the misalignment angle) from the more interesting coating information.
CONCLUSIONS
The acousto-optic technique which has been successfully implemented for NDT of coatings interprets the phase sensitivity of Rayleigh waves to coatings. Based on a normal mode theory, analytical expressions for the measured phase and its dependency on the coating and ultrasonic beam properties can be obtained. These expressions suggest several ways to optimise the sensitivity of the acousto-optic technique. In this paper we have obtained conclusive experimental verification.
The phase sensitivity can be enhanced by detecting further away into the reflected profile or by using higher frequencies. The phase curves obtained during a line scan often suffer from a non-zero slope which masks the smaller phase changes related to the coating. A signal processing method is proposed to separate the misalignment of the sample from the coating information by performing dual frequency scans.
ACKNOWLEDGEMENTS
The authors would like to thank Johan Vanhulst for preparing the acousto-optical setup and for the many fruitful discussions and suggestions.
REFERENCES
[2] M. Wevers et al., “Acousto-optic technique: A new nondestructive technique to evaluate thin layered structures”, Appl. Phys. Lett. 66(12), 1466-1468 (1995).
[3] S. Devolder et al., “Thin layer measurements based on the acousto -optic technique”, Appl. Phys. Lett.
68(12),1732-1734 (1996).
[4] Z. Guo et al., “Integration of modeling and acoustic microscopy measurements for thin films”, J. Acoust. Soc. Am. 107, 2462-2471 (2000).
[5] A. Nayfeh et al., “Ultrasonic leaky waves in the presence of a thin layer”, J. Appl. Phys. 52(8), 4985-4994 (1981).
[6] T. Kundu et al., “Calculation of the acoustic material signature of a layered solid”, J. Acoust. Soc. Am.
77, 353-361 (1985).
[7] S. Devolder, “A new acousto-optic nondestructive technique for the qualitative control of layered materials”, Ph.D. thesis, K.U.Leuven Campus Kortrijk (1996).
[8] H. Bertoni et al, “Unified theory of Rayleigh angle phenomena for acoustic beams at liquid-solid interfaces”, Appl. Phys. 2, 157-172 (1973).
[9] E. Blomme et al., “Plane wave analysis of the near field of light diffracted by ultrasound”, J. Acoust. Soc. Am. 91, 1474-1483 (1992).
[10] L. Brekhovskikh, “Waves in layered media”, (Academic, San Diego, 1980), pp. 53-60.
[11] F. Windels et al., “Thin coating characterization by Rayleigh waves: an analytical model based on normal-mode theory”, J. Acoust. Soc. Am. 110(3), 1349-1359 (2001).
[12] F. Windels, “A theoretical study of two nondestructive testing phase techniques using reflected bounded or pulsed ultrasound”, Ph.D. thesis, K.U.Leuven Campus Kortrijk (2001).
FIGURES
-100 -50 0 50 100 150 200 250 300 350 400
1
11 21 31 41 51 61 71 81 91 101 111 121 131 141 151 161
Scan position (points)
Phase (°)
[image:5.596.108.488.312.505.2]9 mm 12 mm 15 mm 18 mm
Fig. 1: Line scans of a partially painted sample for different detection positions in the reflected profile. Frequency 3.5 MHz.
150 170 190 210 230 250 270
1
13 25 37 49 61 73 85 97
109 121 133 145 157 169 181 193
Scan position (points)
Phase (°)
3 MHz
3.5 MHz
4 MHz
4.5 MHz
[image:5.596.111.482.557.725.2]- 8 0 0 - 6 0 0 - 4 0 0 - 2 0 0 0 2 0 0 4 0 0
1 8
15 22 29 36 43 50 57 64 71 78 85 92 99
S c a n p o s i t i o n ( p o i n t s )
Phase (°)
[image:6.596.88.520.74.247.2]3 M H z 4 . 5 M H z
Fig. 3: Line scan, at two frequencies, of a partially painted sample which is not properly aligned to the scan axis.
-250
-200
-150
-100
-50
0
1
7
13
19
25
31
37
43
49
55
61
67
73
79
85
91
97
Scan position (points)
Phase (°)
[image:6.596.89.519.292.514.2]quadratic phase
Fig. 4: The part of the line-scan curve in Fig. 3 which is quadratic in the frequency as prescribed by Eq. (4a). This contains only th e coating information.
- 5 0 0 - 4 0 0 - 3 0 0 - 2 0 0 - 1 0 0 0 1 0 0 2 0 0
1 7
13 19 25 31 37 43 49 55 61 67 73 79 85 91 97
S c a n p o s i t i o n ( p o i n t s )
Phase (°)
l i n e a r p h a s e
[image:6.596.88.521.565.723.2]