ISSN 1692-2611
Borradores Departamento de Economía
Medellín - Colombia
_______________________________________________________________________________________ La serie Borradores Departamento de Economía está conformada por documentos de carácter provisional en los que se presentan avances de proyectos y actividades de investigación, con miras a su publicación posterior en revistas o libros nacionales e internacionales. El contenido de los Borradores es responsabilidad de los autores y no compromete a la institución.
Click aquí para consultar todos los borradores en texto completo
N°34
Agosto de 2010
Corruption, Economic Freedom and Political Freedom in South America: In Pursuit of the missing Link
Elaborado por:
Danny García Callejas
1
Corruption, Economic Freedom and Political Freedom in South America:
In Pursuit of the missing Link
Danny García Callejas*
Introduction – I. Corruption: What is it? Where does it come from? – II. Corruption and Economic Growt – III. Ways of fighting Corruption – IV. Assessing Corruption, Economic Freedom and Political Freedom – Conclusions
Resumen: La corrupción se puede definir como ―el abuso de la autoridad o confianza pública con fines privados‖. Sin embargo, esta definición sugiere que la corrupción es una enfermedad de la
sociedad y no un síntoma resultante de problemas estructurales como la inequidad o falta de democracia. Luego de analizar información proveniente de Freedom House y Transparency International, este estudio concluye que la liberalización económica y la democracia no están directamente ni linealmente relacionadas con la corrupción en Suramérica. Otros determinantes como la inequidad (política y económica) son esenciales para un análisis integral de la corrupción. Adicionalmente, la literatura actual adolece de una definición holística de corrupción que permita
identificar y entender sus ―verdaderas‖ causas. Al examinar diez países suramericanos durante el
periodo 1995-2008, el análisis de cointegración de panel de datos sugiere que la corrupción, el crecimiento económico y la democracia no están conjuntamente cointegradas ni están relacionadas linealmente; hay un eslabón perdido.
Abstract: Corruption is defined as ―the abuse of public authority or trust for private benefit.‖ However, this paper argues that this definition frames corruption as a disease of society and not a symptom of structural problems such as inequality or lack of democracy. After analyzing data on corruption from Freedom House and Transparency International, this study concludes that corruption is not related to economic liberalization and democracy in a linear fashion. Other determinants such as inequality (political and economical) are lacking in the analysis of corruption. Additionally, the literature still lacks a comprehensive definition of corruption that may identify its
―true‖ roots. A panel cointegration and panel data analysis suggests that corruption, economic
growth and democracy are neither jointly cointegrated nor explained linearly; there is a missing link. Finally, this research is constrained to ten South American countries and the years 1995-2008.
Key Words: Corruption, Economic Growth, Panel Data, Panel Cointegration, Political Freedom, South America.
JEL Classification: D73, H83, K42, O10, C23, C32
* Professor, Economics Department, Universidad de Antioquia, Medellín, Colombia. Address: Departamento
2
Introduction
The analysis of corruption by international institutions has led to the impression that there is a consensus among scholars and incontrovertible evidence that corruption is ―bad.‖ It seems as if corruption became the escape goat for all the problems in democracies but as well in dictatorships. However, this emphatic conclusion is far from being reached. First, it is yet unclear what corruption is, what causes it and thus the consequent policy recommendations. Second, some authors and institutions have contained this definition to the public sector, as if private actors where incorruptible. This seems to contribute only to the blame game by arguing that it‘s all the government‘s fault. This seems to be part of an agenda of promoting smaller governments and more liberalization; unfortunately, this position has contributed to mislead policymakers and frame the debate as simply a matter of big government versus market freedom.
Third, although there is a rich literature on corruption, the conduits explaining why it spurs in all types of democracies and non-democracies is still a dilemma. This is particularly troublesome because it makes policymakers and scholars focus on the consequences of corruption but not its causes. Fourth, it is unclear if corruption promotes economic growth or not. This debate has not been settled and there is persuasive evidence from both sides. Although world institutions suggest that the negative relation is undeniable, diverse counter examples prove that the phenomenon is much more complicated and has many more consequences than affecting economic growth.
3 However, the notion that corruption is ―bad‖ invalidates any argument that explains this phenomenon as a consequence of structural problems in society and not simply the lack of economic freedom or democracy. This debates excludes variables such as inequality, poverty and the allocation of public funds in a ―legitimate‖ but segregated way are excluded from this debate. These factors plus institutions and discrimination seem are promising areas of research that may lead to the causes of corruption and thus effective policy recommendations. Nevertheless, that requires approaching corruption from a structural perspective and as a symptom of society‘s exclusion and lack of equitable development. Moreover, that requires an integral definition of democracy and participation as well; democracy and political freedom is more than voting or forming a political party; it is the right to do so, to have the means for it and not being excluded, no matter the political ideals or if they only represent a minority.
This paper will analyze the literature on corruption and explore the South American case to provide evidence that corruption is not directly linked to economic and political freedom as defined and proposed by some institutions. This paper finds that there is an unclear empirical relation between corruption, democratic freedom and economic freedom. In order to arrive to this conclusion, data from Transparency International and the Freedom House Organization on perception of corruption, democratic freedom and economic freedom, for the 1995-2008 period, is used. The econometric analysis is done through a panel data approach for ten countries in South America. The empirical findings indicate that there is a missing link between these variables. Furthermore, the analysis suggests that their definitions neither capture nor explain the problem in depth. Consequently, more research that explores alternative conduits is required.
4 economic and political freedom in South America and some policy recommendations. Finally, some concluding remarks are given.
I. Corruption: What is it? Where does it come from?
A. Definitions of Corruption
Bayley (1966, p. 720) defines corruption as the misuse of authority for personal gain and not secluded to a monetary gain; any type of personal gain. Werlin (1973) simply puts it as the use of public resources for private activities. Klaveren (Kotkin and Sajo, 2002, p. 151) when analyzing the Dutch East Indian Company, observed corruption as the action of a public servant that runs the public office as a private corporation. In that office, citizens would have to bargain and pay the official—an alleged CEO—for obtaining the favor from government. Klaveren was describing corruption as the abuse of public office for personal gains. In other words, power abuse driven by intentional and strategic activities (Lee-Chai et al., 2002, p. 45).
In contrast, Johnston (2005, p. 8-9) argues that corruption is a consequence of the asymmetries of power and wealth that can arise from trading with the rest of the world. Johnston (2005) argues that corruption is created by the interaction of locals with outsiders that bring capital and wealth but with the objective of satisfying their personal gains. In a similar stance, Clinard (1990, p. 166) suggests that corporations may promote and tolerate corruption.
5 In contrast, Rose-Ackerman (1978, p. 216) suggests that information and competition help reduce corruptive actions. She also states however, that these are not enough. A thorough analysis of corruption is incomplete if the personal integrity of political actors is not included in the picture.
Yet, in another definition of corruption that encompasses political corruption, Heidenheimer et al. (1993, p. 6) defines corruption ―in terms of transactions between the private and the public sectors such that collective goods are illegitimately converted into private-regarding payoffs.‖
Nevertheless, several authors have divided the definition of corruption according to the magnitude at stake for society. Theodore Lowi describes Big Corruption and Little Corruption (DeLeon, 1993, p.19). The former relates to those illegal behaviors that ―encourages the dissolution of the constitution.‖ Whereas the latter is related to those actions that contribute to the depravation of individual moral integrity (ibid, p. 20).
In contrast, Rose-Ackerman (1999, p. 47) argues that corruption arises when the government establishes rules and mechanisms that try to contain market forces. This definition implicitly argues that the lack of resources and the pursuit for efficiency may encourage corruption (DeLeon, 1993, p. 21). Nonetheless, Rose-Ackerman (1999) also explains that liberalization must come hand to hand with political reform and at the beginning corruption may rise. Nevertheless, if political reforms are done properly they may reduce corruption in the long run. However, she points out that developed countries might not see these political reforms in their best interest since they believe that corruption allows their business to flourish in developing countries (ibid., p. 177).
6 pushing away other explanations and solutions for corruption. And, finally, the association between democracy and corruption is fuzzy. The lack of an encompassing definition also limits our possibility of finding viable and consistent policy recommendation to fight this problem.
B. Types of Corruption
Corruption can take multiple forms. Under political corruption, Gibbons (1999, pp. 763-764) mentions nine forms of corruption: (1) Political patronage or using public resources to reward electoral support. (2) Hiring government employees that favor the ruler‘s political views or allocating contracts based on a partisan criterion. (3) Vote-buying. (4) Pork-barreling or promising public works to voters that the candidates know will not be able to deliver. (5) Bribery or citizens that pay an official to favor their interests. (6) Graft, when an official suggests he should be rewarded in order to comply with a public action. (7) Nepotism or hiring or allocating contracts based on kinship or friendship. (8) Influence-peddling or inducing other public officials or an intermediary to perform a corrupt act. And (9), corrupt campaign finance or receiving funds from a group that compromises the electoral venue.
Although corruption, politics and economics are intertwined, from an economic perspective some forms of corruption are given more importance than others. The following are the ―main‖ forms of corruption (Amundsen, 2000).
7 In contrast, embezzlement is the misappropriation of public resources by government officials. Nevertheless, this phenomenon is not restricted to the public arena. Private agents can also steal resources from private firms. This phenomenon curtails citizens of public investments and reduces the government maneuverability to satisfy public needs.
Fraud is similar to embezzlement but differenced by including some form of deceit. This act is present in the private and public sectors. The accounting and fraud scandals of Enron in 2001 and WorldCom in 2002 are just two examples of fraud in the private sector.
Another form of corruption is extortion. In contrast with the previous forms, this one is characterized by having a more violent component. In this case, criminals harass public officials or private agents for their personal benefits. The presence of Mafias or organized groups usually fit into this category.
Finally, favoritism, a corrupt practice that is intended to provide certain groups or persons with more benefits than the rest of society in an unequal way. This last form of corruption is especially troublesome since it lowers efficiency by usually favoring those with the lowest quality products, the highest costs or the lack of expertise in performing a task for the public sector.
C. The IMF’s view on Corruption
Similarly, to the World Bank, the International Monetary Fund defines corruption as ―the abuse of public authority or trust for private benefit.‖ This institution has a preventive approach on combating corruption. Furthermore, it seeks to narrow the scope for corruption in its member countries. However, narrowing corruption seems related to something other than corruption. It seems as is the IMF confuses corruption with the lack of free trade and free market oriented policies. This is clear when analyzing the causes of corruption.
8 for civil servants, natural resource endowments and sociological factors. Indeed, these causes are in accordance with Freidman‘s (2002) conception of the state. Nevertheless, these causes can be contradicted. First, for example, sociological factors are tied to ethno-linguistic fragmentation. However, Switzerland has four official languages and ethnic diversity and has one of the lowest corruption perception indexes in the world. Canada is another example.
Second, Tunisia is an economy that is more open as a percentage of GDP than the United States, however, the U.S. has a lower corruption perception index than Tunisia. According to Transparency International, in 2007 Tunisia ranked 62 and the U.S. 28. Do trade restrictions necessarily foster corruption? Trade restrictions clearly do not encourage free trade but not necessarily corruption. Issuing import permits and using them as a source of corruption implies that foreigners are as corrupt as local authorities. Consequently, reducing restriction at home will not lower corruption since the private sector from the exporting country is as corrupt as the local government. With no trade restrictions, they would just lure corruption to other parts of the government—or try to—through their rent seeking behavior. Maybe Mauro (1997) is implying prohibiting multinationals to export.
Third, do natural resource endowments really promote corruption? Canada, Australia and the U.S. are endowed with more natural resources than countries on average; nevertheless, they have one of the lowest corruption indexes according to Transparency International. Although there are countries endowed with natural resources that are corrupt, the evidence seems to be inconclusive.
9
II. Corruption and Economic Growth
A. Corruption: The Grease that keeps the System Running
Acemoglu and Verdier (1998) argue that a certain level of corruption can be optimal for an economy. One of the major roles of the state is enforcing property rights. Nonetheless, this can be costly and thus conducive to inefficiency since the allocation of these resources in other activities (education, health care) can render a higher social return. Consequently, developing economies have incentives to allow for corruption since this action is compatible with economic growth.
Corruption arises because contracts are incomplete. The relations between private actors require a third party that enforces contracts and promotes credibility. The state usually takes this stance. Indeed, corruption is a phenomenon that is not exclusively of the public sector. However, government officials may have incentives to use their power and profit from the enforcement of contracts.
Yet, the tradeoffs with other activities, needs and sectors in the economy lead states to invest more resources in more than just combating corruption. The ―efficiency wages‖ approach suggests that higher wages for government officials prevents corruption since the cost of being caught taking a bribe becomes too high. However, using these types of solutions—high wages in the public sector—may attract skilled and talented workers that abandon their private ―low‖ paid jobs for the higher public pay. This creates inefficiencies that lead to losses in productivity of the economy and leads to slower economic growth (Acemoglu and Verdier, 1998). Once more, the public sector has incentives to allow some level of corruption to encourage efficiency and economic growth and keep talented workers in the fields in which they are most productive.
10 countries. Accordingly, Kurer (2001, p. 66) shows that corruption is abundant in developed countries. Italy is the example used in this study. Moreover, Kurer (2001) suggests that rapid growing economies like Thailand and Italy can tolerate corruption and still reach high levels of development.
Kurer (2001) explains that there is a threshold for corruption not affecting economic growth, in fact it can be beneficial and promote development. In describing the Thai case, Kurer (2001) argues that corruption prevails in the rural parts of the country, which are the poorest. However, since the urban areas provide the majority of resources for the government they also request more public investments; leaving less for the rural areas. Consequently, corruption in the rural area acts as a conduit for the redistribution of income since more resources are made available to the rural areas, to which funds otherwise would have not been allocated. Since the productive areas—urban areas—are marginally affected, economic growth continues and promotes demand by increasing the poor‘s income—praise to corruption.
Furthermore, Lef (1964) and Lui (1985) argue that corruption can have positive impacts on growth but from a different perspective. These authors argue that corruption can work as a means for overcoming excessive red tape and government bureaucracy. Consequently, the private sector can take less time to start-up a business, realize an export, or develop joint ventures with multinational companies that bring investment and economic growth. This constitutes the idea that corruption may act as the ―grease‖ that allows the engine to work smoothly.
B. The “Corruption Tax” or Killing Economic Growth through Corruption
11 they can take advantage of economic agents and make them pay a bribe for speeding up a process that they have slowed purposely.
Nevertheless, the literature points to three main counterarguments to corruption as a promoter of economic growth. The first one is the Myrdal argument just presented. Public officials, to capture private resources for their benefit, deliberately create the regulations that slow economic ventures. The second states that corruption rarely creates any efficiency, since it is the rent-seekers and companies with the lowest quality products that use this mechanism. The third, corruption creates barriers to entry. Since public officials will favor certain firms, the others are left in disadvantage and sometimes without access to the market. Consequently, it deters competition, quality, low prices and efficiency (Fisher, 2006, p. 138).
Wei (2001) tries to establish if capital controls, taxes, and corruption have a negative effect on inward investment for a group of 14 major source countries and 45 host countries in 1991, including OECD members. The dependent variable is bilateral stocks of foreign investment. In the case of corruption, the author finds no evidence of ―efficient grease‖ on investment. This study points that corruption offsets investment. However, there are several methodological limitations with this study and error measurement bias that asks for caution when interpreting the results, as pointed out by Yeung (2001).
12 Moreover, the lack of financial resources for the state limits its autonomy and possibilities to encourage growth.
Kaufmann and Wei (1999) analyze the relation between bribe payments, cost of capital and management time wasted with bureaucrats in a cross-sectional framework. The authors use three surveys: the 1997Global Competitiveness Report containing 2,381 firms in 58 countries that answered to corruption related issues; the 1996 Global Competitiveness Report with 1,503 firms in 48 countries answering corruption related questions; and the 1997 World Development Report with 3,866 firms in 70 countries.
The findings by Kaufmann and Wei (1999) suggest that if bureaucratic complexity and red tape are exogenous, then corruption acts as the ―grease‖ that allows the money to flow and consequently may promote efficiency. However, if this process is endogenous as suggested by Myrdal (1972), then corruption does not foster efficiency. The authors also provide evidence that firms spend increasingly more time dealing with bureaucrats due to harassment (from bureaucrats). This finding rebuts the idea that corruption is exogenous and consequently that it can promote efficiency.
Additional empirical studies have found a negative relation between economic growth and corruption, for example, Mauro (1995) and Hines (1995).
13 solid institutions would have the mechanisms to deter such incentives and exploit the resources for the benefit of society (e.g. Alberta‘s oil sands, Canada).
In contrast, Pessoa (2008), for a sample of 119 countries in the period 1980-2004, finds a negative relation between institutional quality and resource abundance for all countries. The author uses a panel data approach but does not control for endogeneity between his proxy for institutions and economic growth. Several authors have pointed out that institutions are endogenous (North and Thomas, 1973; North, 1990; and Acemouglu et al., 2001), but the author of this study argues that assuming that they are endogenous limits the range of any policy recommendation (Pessoa, 2008, p. 11). His (ibid., p. 11) proxy for institutions is an economic freedom index constructed by Gwartney and Lawson (2003). Finally, his findings contradict the hypothesis that nations with poor institutions suffer from this ―curse‖ while those with consolidated institutions do not. This seems to imply that all countries are at risk when it comes to natural resource abundance. Thus, any country is susceptible to corruption from rent-seeking behavior in that sector.
Following a similar argument, Uslaner (2008, p.25-26) argues that the contradictory results on the impact of institutions on corruption is due to narrow definition of democracy. Furthermore, this author explains that once equality as a form of democracy is incorporated in the equation, institutions do encourage less corruption. However, the author stresses that both mechanisms and not one as an isolated tool help promoting efficiency and economy growth.
14 Nevertheless, Ali and Crane (2002, p. 422) suggest ―the effect of economic freedom on growth is independent of the level of political freedom and civil liberty.‖ However, this conclusion is misleading since economic freedom is related to political freedom and viceversa (Friedman and Friedman, 2002; Hayek, 2001, p. 15). Clearly, this point presents three important drawbacks in their study, specifically in their Table 3. First, their variables for economic freedom, political freedom and civil freed are related and cause multicollinearity. This rests precision to their results. If there is no multicollinearity, as the author‘s suggest (p. 422), then there is a theoretical inconsistency.
Second, there is endogeneity between real per capita GDP growth, and their political, economic and civil indexes. This is biasing their results and making OLS to be inconsistent. Again, assuming exogeneity is assuming that Friedman and Friedman (2002) and Hayek (2001) are wrong, but this would invalidate and contradict their results (Ali and Crain, 2002, p. 425). This would be theoretically inconsistent. Finally, their regression analysis does not distinguish the channels through which institutional quality interacts with economic freedom and economic growth. This is particularly important if you want to explain corruption through the lack of institutional quality (Warren, 2004).
Lastly, Ali and Crane (2002, p. 425) propose reductions in input price volatility as the channel trough which economic freedom affects growth. In addition, the authors suggest that more economic freedom implies more institutional quality—thus less corruption. However, their estimations on price volatility do not control for supply and demand factors and thus suffer omitted variable bias. Finally, their ―hand in hand‖ relation between institutional quality and economic freedom is contradicted by the data. Hasset (2007) shows that politically repressed countries on average grew 6.28% in the years 1991-2005 in comparison with 2.62% from politically free. Similarly, the theoretical evidence also suggests that dictatorships may grow faster and may have higher levels of investment (Durham, 1999; Overland and Simons, 2000).
15 Additionally, the authors suggest that richer countries are less corrupt (p. 548), for the period 1999-2004 and including all countries in the world. However, their estimations do not control for any other factors suffering from a serious omitted variables problem and hence inhibiting them to draw any feasible policy recommendation.
Finally, Mauro (1998) suggest that corruption has a widespread effect in the economy not only affecting economic growth. This author argues that governments with high levels of corruption tend to spend less on health and education. Although Mauro (1995) and Kaufmann and Wei (1999) suggest that government regulation fosters corruption, it is yet unclear what is the conduit that leads to such phenomenon. Additionally, Myrdal (1972) would argue further in presenting a feedback loop between corruption and regulation. This evokes a more complex relation that is yet to be determined.
In summary, there is a vast literature supporting the claim that corruption negatively affects economic growth. Nevertheless, these studies lack to explain if the effect is trough institutions or if democracy plays a major role in this process. When studies account for these effects, usually the results are not conclusive on the nature of the relation and thus the possible policy recommendations. Additionally, endogeneity problems are a constant with these types of studies since our knowledge of what causes growth is attributed to multiple factors (Sala-i-Martin, 1997), and yet the type, magnitude and channels of the feedback effects from the ―causes‖ of growth are still to be precisely determined.
Additionally, due to the nature of the data and the difficulty of capturing these concepts in a quantitative analysis, authors tend to replace these variables with proxies. Moreover, there is an important discussion on the relevance of these proxies and on the corruption indexes themselves. There are several measures of corruption each with its own methodology, sample and target group. Caution must be used when picking one (Sampford, 2005).
16 the concept. It seems, that corruption studies will follow a futile path until its relation to democracy and institutions is not well established (Warren, 2004). Furthermore, perhaps a critical perspective that includes power relations, inequality and class struggle would provide a more comprehensive picture on the nature of corruption (Girling, 1997, p. 167). Nonetheless, after doing so, quantifying and determining the relation of corruption with economic growth should be a rewarding endeavor that could deliver feasible policy recommendations.
III. Ways of fighting Corruption
Some scholars and institutions have proposed the release of information as a means to combat corruption. However, there are several questions yet unresolved in the literature (Williams, 2009): How to guarantee that the information released is accurate and not tainted by corruption? How can governments guarantee that the information released is not what corrupt officials want the public to see? Does greater transparency reduce corruption or do we need good institutions first in order to be transparent?
Some scholars have argued that even for economic developed countries, transparency is not enough to fight corruption (Kolstad and Wiig, 2009).
However, several scholars suggest that having public officials with high levels of education encourages more transparency and less corruption (Rauch and Evans, 2000). Yet, internal promotions and competitive salaries do not act as major factors in reducing the levels of corruption (ibid.) This finding is surprising since one of the main motives of corruption is economic gain (Becker and Stigler, 1974). Nevertheless, the high amounts of money involved in a corrupt scheme might make any salary worthless as a weapon to combat corruption.
17 strict monitoring, especially if enforced by an outside of government institution or branch (Klitgaard, 1988). However, there are three major drawbacks to this proposal. First, it reduces national sovereignty. This creates inefficiencies in the bureaucratic system since institutions would seek the approval of a third party. In fact, the approval itself might become the end of all institutions leaving aside the institution‘s original mission.
A second criticism is that outside monitoring is expensive. Finding qualified professionals that understand the local and national context as well as the region‘s legal framework is hard. Especially, since you are looking for professionals or bureaucrats that are out of the system but know it as well as the bureaucrats in power. Additionally, larger governments imply more financially expensive interventions leading to a cost-benefit analysis that might suggest a tolerance for a certain level of corruption. That level of corruption could be high if this underground activity is hard to detect or has become part of the culture. Indeed, this is troublesome.
The third major debacle of monitoring is its lack of knowledge of the local culture and behavior. International institutions or third parties from outside the country generally execute monitoring in order to avoid political pressures and manipulations—as might happen with citizen organizations for monitoring governance. Yet these institutions might not understand or identify the behaviors that are considered corrupt in the regions they are monitoring; culture plays an important role in shaping corruption (Barr and Serra, 2006). For instance, Cameron et al. (2006) in an experiment with children from Australia, India, Indonesia and Singapore, show how conceptions and severity of punishments of corruption diverge from one culture and country to another. Cross-cultural differences affect corruption and economic outcomes (Hauk and Saez-Marti, 2002; Guiso et al., 2006).
IV. Assessing Corruption, Economic Freedom and Political Freedom
18 if the theoretical underpinnings are reflected by the data, the estimations will include civil liberty, political freedom, economic freedom, government size, financial freedom and trade freedom, as pointed out by the literature. If corruption is actually explained by these variables, the empirical analysis should find that these variables are significant or cointegrated to corruption.
The next section provides the empirical test to the determinants of corruption, describes the methods and data used.
A. The Data
This paper analyzes 10 South American countries for 1995-2008, using data from the Heritage Foundation and Freedom House. The 10 countries included in this study are Argentina, Bolivia, Brazil, Chile, Colombia, Ecuador, Paraguay, Peru, Uruguay and Venezuela.
The dependent variable for this study is the Corruption Perception Index developed by Transparency International. This index is on a 0 to 10 scale, where 0 represents a very high perception of corruption and 10 a very low one. In this case, corruption is defined as ―the misuse of entrusted power for private gain‖ (Transparency International, 2009).
As independent variables, this study includes the following economic freedom indexes developed also by the Heritage Foundation: Business Freedom, Trade Freedom, Fiscal Freedom, Government Size, Monetary Freedom and Investment Freedom. Each of these indexes is in a scale from 0 to 100, where 100 refers to the highest level of freedom.
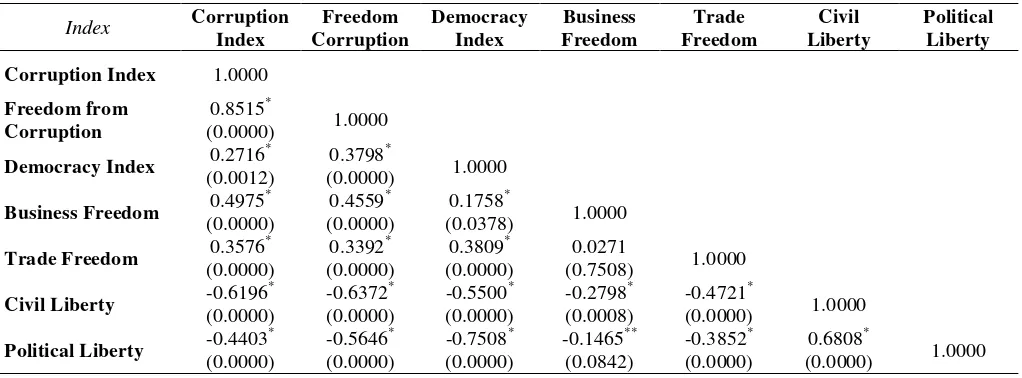
19 The following table provides the correlations among some of the variables and their significance level.
Table 1. South America: Correlations among Indexes, 1995-2008
Index Corruption
Index Freedom Corruption Democracy Index Business Freedom Trade Freedom Civil Liberty Political Liberty
Corruption Index 1.0000
Freedom from Corruption
0.8515*
(0.0000) 1.0000
Democracy Index 0.2716
*
(0.0012)
0.3798*
(0.0000) 1.0000
Business Freedom 0.4975
*
(0.0000) 0.4559
*
(0.0000) 0.1758
*
(0.0378) 1.0000
Trade Freedom 0.3576
* (0.0000) 0.3392* (0.0000) 0.3809* (0.0000) 0.0271
(0.7508) 1.0000
Civil Liberty -0.6196
*
(0.0000) -0.6372
*
(0.0000) -0.5500
*
(0.0000) -0.2798
*
(0.0008) -0.4721
*
(0.0000) 1.0000
Political Liberty -0.4403
*
(0.0000) -0.5646
*
(0.0000) -0.7508
*
(0.0000) -0.1465
**
(0.0842) -0.3852
*
(0.0000) 0.6808
*
(0.0000) 1.0000
Source: Own elaboration. Transparency International and Freedom House.
Note: One asterisk (*) indicates significant at a 5% level; two asterisks (**) indicates significant at a 10% level.
All results from Table 1 are significant at a 10% level, except one. The lack of correlation between the Business Freedom Index and Trade Freedom Index suggests that these two indexes may be effectively measuring different things. However, this result is surprising since the Freedom of Trade Index and Freedom of Business Index include common factors; for example, the level of tariffs and non-tariff barriers that may be considered as factors that delay obtaining a license.
20 B. Methodology and Results
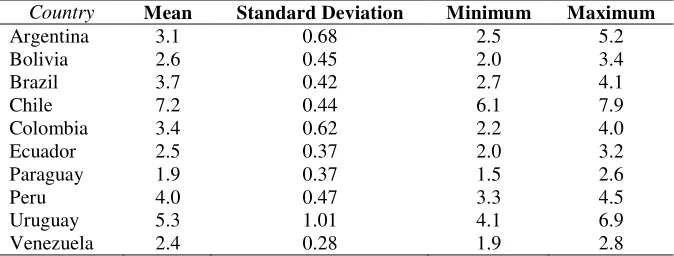
[image:21.612.138.475.361.489.2]This paper follows a panel data analysis for the relation between corruption, economic freedom and political freedom. This approach is preferred to a cross-section equation since time series data is also available. The presence of heterogeneity among countries in the sample makes the cross-section equation misspecified. Although there are policies for economic integration in place throughout South America, economic, social and cultural differences prevail among countries. Furthermore, economic structures and income disparities are diverse throughout the region—compare Chile and Ecuador in terms of GDP per capita or share of economic sectors respect to GDP, for example. Furthermore, regarding corruption levels, I observe important heterogeneity among the countries in the sample (Table 2).
Table 2. South America: Corruption Perception Index, 1995-2008.
Country Mean Standard Deviation Minimum Maximum
Argentina 3.1 0.68 2.5 5.2 Bolivia 2.6 0.45 2.0 3.4 Brazil 3.7 0.42 2.7 4.1 Chile 7.2 0.44 6.1 7.9 Colombia 3.4 0.62 2.2 4.0 Ecuador 2.5 0.37 2.0 3.2 Paraguay 1.9 0.37 1.5 2.6 Peru 4.0 0.47 3.3 4.5 Uruguay 5.3 1.01 4.1 6.9 Venezuela 2.4 0.28 1.9 2.8
Source: Transparency International. Own calculations.
Note: Does not include Guyana, Suriname and French Guiana. The Corruption Perception Index ranges from 0 to 10. A value of 10 indicates a very low perception of corruption. A value of 0 implies a very high perception of corruption.
21 and Panama—and the distance to the major cities is smaller than in case of the former— with access to only one ocean or none, in some cases.
Conventional theory suggests that these barriers to trade—although geographical— can limit growth and foster corruption since smuggling or contraband—a form of corruption—would be more difficult to control.
Finally, the yearly evolution of corruption, civil liberties and political liberties should be included in the analysis as well—which would not be captured in a cross-section analysis. In order to capture the cross-country heterogeneity, unobservable country specific heterogeneity and the yearly evolution in corruption and economic, political and civil liberties, I use a panel regression approach. The model to estimate is as follows:
CPIit = αi +β1Pollibit+ β2Civillibit+ β3Govtit + β4Tradefit+ β5Moneyfit+
+ β6Businessfit+ β7Investfit+ β8Financialfit+ uit (1)
Where i = 1, 2,…,10, and identifies each country; t = 1995-2008, and represents the year for each observation; CPI is the Corruption Perception Index provided by Transparency International—the freedom of corruption index from the Heritage Foundation was also used in the analysis with similar results. Pollib is the political liberty index. Civillib is the civil liberty index. Govt is an index for the size of government in the economy. Tradef is an index for the level of trade openness—or trade freedom. Moneyf is an index for the independence of the monetary authority or central bank. Businessf is an index for the level of bureaucracy and red tape when trying to start-up a business. Investf is an index for the level of bureaucracy involved when investing in the country. Financialf is an index for the easiness of capital flow.
22 intervention is not necessarily bad, especially when it is providing health care, education or creating the institutions that account for development (Stiglitz et al., 2006; Stiglitz, 2006). Furthermore, Sachs (2005) argues that free trade does not necessarily promote economic growth and less corruption, when analyzed empirically.
However, in order to proceed with the econometric estimation of Equation 1, a panel unit root test must be performed first, in order to rule out any spurious results. This paper uses the Levin Lin Chu (2002) test for panel unit roots. Since the number of years available is only 14, this test outperforms the Im et al. (2003) test. Nevertheless, this limitation obligates the Levin Lin Chu test to assume that each cross-section unit has the same autorregresive model of order one or AR(1). This means that all individual processes need to be stationary to accept the hypothesis of panel data stationarity. Since stationarity means that variances and means are constant in a data sample, requiring individual stationarity means that each country would need to have a constant variance and mean in order to be panel stationary.
The Levin Lin Chu test follows an Augmented Dickey-Fuller framework but applied to panel data. Formally, the initial equation to estimate is:
it j
it j
ij it
it y y v
y
δX
1
1 (2)
Where Δyit is the differentiated version of variable y, which in this case is each of the
variables involved in equation 1. X is a vector of seasonal dummies, for example. As in equation 1, i = 1,…,10 or the number of countries; and t = 1995-2008 or the number of years. Similarly, j would equal the number of lags in the test. Finally, vit represents the error
term for this regression.
Using the residuals from equation 2 to approximate Δyit and yit-1, and regressing these
23 Nevertheless, in order to verify the results of the Levin Lin Chu (2002) tests, I will also perform the Im Pesaran Shin (1997), Hadri (2000) and Fisher-DF (Maddala and Wu, 1999) tests. The latter two tests have non-stationarity as their null hypothesis. In contrast, the Levin Lin Chu (2002) and Im Pesaran Shin (1997) have as null hypothesis that variable is stationary.
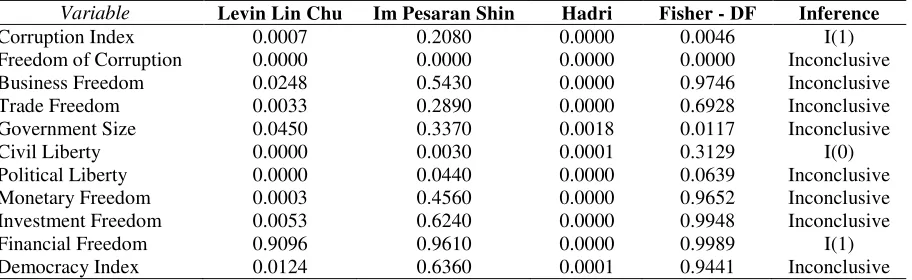
[image:24.612.83.539.317.457.2]The conclusion of the tests will be based on a majority rule, in order to obtain a robust inference. If three out of the four tests have the same result then that outcome will be the inference for that variable. The following table provides the results for all the panel unit root tests.
Table 3. South America: Panel Unit Root Test, 1995-2008
Variable Levin Lin Chu Im Pesaran Shin Hadri Fisher - DF Inference
Corruption Index 0.0007 0.2080 0.0000 0.0046 I(1) Freedom of Corruption 0.0000 0.0000 0.0000 0.0000 Inconclusive Business Freedom 0.0248 0.5430 0.0000 0.9746 Inconclusive Trade Freedom 0.0033 0.2890 0.0000 0.6928 Inconclusive Government Size 0.0450 0.3370 0.0018 0.0117 Inconclusive Civil Liberty 0.0000 0.0030 0.0001 0.3129 I(0) Political Liberty 0.0000 0.0440 0.0000 0.0639 Inconclusive Monetary Freedom 0.0003 0.4560 0.0000 0.9652 Inconclusive Investment Freedom 0.0053 0.6240 0.0000 0.9948 Inconclusive Financial Freedom 0.9096 0.9610 0.0000 0.9989 I(1) Democracy Index 0.0124 0.6360 0.0001 0.9441 Inconclusive
Source: Own elaboration.
Note: All tests include constant, trend and are set at one lag. Inference is the result of three or more outcomes with the same finding. The Levin Lin Chu and Im Pesaran Shin test have stationarity as null hypothesis. In contrast, the Hadri and Fisher-DF have non-stationarity of the series as null hypothesis.
The results provide evidence for no stationarity. Consequently, estimating equation (1) would return a spurious outcome and dubious findings. Yet there is another alternative. Since all variables are integrated of the same order, order 1, it might be possible to find a linear combination that provides a stationary and non-spurious output. This analysis is called cointegration analysis.
24 contrast with Pedroni (2004). The null hypothesis in Westerlund (2007) is that there is no cointegration. The results obtained using Persyn and Westerlund (2008) are presented in the following table.
Table 4. South America: Panel Cointegration Tests, 1995-2008
Covariate G Corruption Perception Index Freedom from Corruption
τ Gα Pτ Pα Gτ Gα Pτ Pα
Business Freedom (1) 0.640 0.280 0.340 0.320 0.040* 0.260 0.030* 0.110 Trade freedom (2) 0.020* 0.060* 0.110 0.110 0.010* 0.080** 0.000* 0.000*
Government Size (3) 0.410 0.270 0.190 0.280 0.010* 0.060** 0.000* 0.010*
Political Liberty (4) 0.100** 0.470 0.010* 0.280 0.010* 0.040* 0.000* 0.000*
Monetary Freedom (5) 0.140 0.410 0.150 0.310 0.030* 0.230 0.000* 0.030* Democracy Index (6) 0.100** 0.250 0.130 0.300 0.080** 0.130 0.010* 0.060**
Financial Freedom (7) 0.260 0.580 0.560 0.660 0.010* 0.080** 0.000* 0.010*
Multiple Covariates
1 and 4 1.000 1.000 1.000 1.000 0.000* 1.000 0.173 0.999
1 and 6 0.509 1.000 0.959 0.999 0.627 1.000 0.962 0.999 2 and 4 0.000* 1.000 0.000* 0.998 0.000 1.000 0.000 0.990
2, 3 and 4 0.825 1.000 -- 1.000 1.000 -- 1.000 1.000 3 and 6 0.310 0.040* 0.120 0.140 0.310 0.040* 0.110 0.080**
3 and 7 0.710 0.300 0.900 0.650 0.030* 0.280 0.000* 0.050*
5 and 7 0.290 0.310 0.860 0.180 0.020* 0.910 0.010* 0.730
6 and 7 0.340 0.550 0.820 0.800 0.370 0.110 0.830 0.460
Source: Own elaboration.
Note: Robust p-values. One asterisk (*) indicates significant at a 5%. Two asterisks (**) indicate significant at a 10%. All estimations include a constant and trend.
For the Corruption Perception Index, the evidence rejects the null hypothesis of cointegration in the majority of cases. If one uses as rule that 2 or more tests rejecting cointegration infers no cointegration for such a set of variables, one must conclude that there is no clear evidence of cointegration. In contrast, when using the Freedom from Corruption Index, cointegration with one covariate is confirmed in almost all cases. This is not surprising since these indexes are all provided by the same source. Nevertheless, when other covariates are included to reduce omitted variable bias, cointegration is only found when Government Size and Financial Freedom are included.
25 Nevertheless, the unit root tests were not conclusive about the level of integration of the variables in this econometric exercise. This may suggest that the cointegration analysis is misleading. In order to rule out this possibility, I proceed to estimate Equation 1 assuming that they do not have a unit root. However, the Transparency Corruption Index cannot be used as a dependent variable because of its lack of stationarity (its test was conclusive). Consequently, the Freedom from Corruption index will be used as the dependent variable in all estimations.
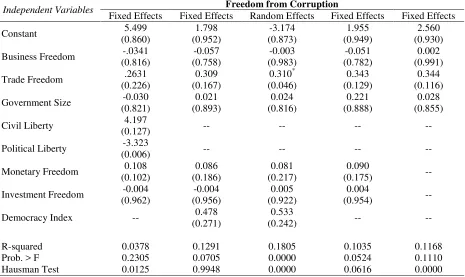
[image:26.612.62.527.415.692.2]The following table provides the results for the estimations. A fixed effect estimation is the most adequate procedure since there are unobservable characteristics among the countries that do not change or remain constant during 1995-2008; for instance, geographical characteristics. Yet, a Hausman test is performed to assure that fixed effects is econometrically adequate. In one case the Hausman tests suggests random effects over fixed effects; in such case the random effects estimations are presented.
Table 5. South America: Panel Data Estimations assuming Absence of Panel Unit Roots, 1995-2008
Independent Variables Fixed Effects Fixed Effects Freedom from Corruption Random Effects Fixed Effects Fixed Effects
Constant (0.860) 5.499 (0.952) 1.798 (0.873) -3.174 (0.949) 1.955 (0.930) 2.560
Business Freedom (0.816) -.0341 (0.758) -0.057 (0.983) -0.003 (0.782) -0.051 (0.991) 0.002
Trade Freedom (0.226) .2631 (0.167) 0.309 (0.046) 0.310* (0.129) 0.343 (0.116) 0.344
Government Size (0.821) -0.030 (0.893) 0.021 (0.816) 0.024 (0.888) 0.221 (0.855) 0.028
Civil Liberty (0.127) 4.197 -- -- -- --
Political Liberty (0.006) -3.323 -- -- -- --
Monetary Freedom (0.102) 0.108 (0.186) 0.086 (0.217) 0.081 (0.175) 0.090 --
Investment Freedom (0.962) -0.004 (0.956) -0.004 (0.922) 0.005 (0.954) 0.004 --
Democracy Index -- (0.271) 0.478 (0.242) 0.533 -- --
R-squared 0.0378 0.1291 0.1805 0.1035 0.1168
Prob. > F 0.2305 0.0705 0.0000 0.0524 0.1110
Hausman Test 0.0125 0.9948 0.0000 0.0616 0.0000
26 C. Discussion and Policy Recommendations
The econometric analysis indicates that corruption—perception—, government size, free trade, financial freedom, and democracy have an unclear relationship. This finding cast doubts on the possible causation among these set of variables. However, this result must be interpreted cautiously. First, this analysis is constrained to 14 years. This time set might not be sufficient to capture any relation between these variables especially if these variables have a long term relation.
Second, although the data presents sufficient variability to execute the econometric analysis, the 1995-2008 period may not provide the sufficient historical and structural variability to capture the true relation among the variables. South America has had many dictatorships in the past, but the period of analysis is of ―relative‖ calmness. Although there have been political changes in terms of left wing or right wing parties coming into power, they have not been as radical as in the past. Additionally, their legacy may have effects only in the long term and the data may not be capturing this yet.
Third, this study has analyzed a linear relationship among the variables. However, causation might be nonlinear in this case, as shown by Montinola and Jackman (2002) for a cross-country analysis where dictatorships may have low levels of corruption in comparison with partially democratized countries. Additionally, path dependency of corruption and the fact that institutions may evolve in a non-linear—unexpected—fashion may cast concerns about this result. For instance, the consolidation of political projects in this period that have historical roots and are only understood by analyzing the history of each county, do not allow to fit any classical definition of liberty or corruption and therefore not be captured by the indexes.
27 these indexes—this maybe inconceivable and not justifiable. Consequently, the indexes may be biased and not capture the sufficient information to provide other results.
However, it is possible that the relationship is unclear because there are other elements that work as conduits for fostering development—in an integral way, a la Amartya Sen—and eliminating corruption. Freedom means more than the possibility of voting for a candidate. Freedom is only complete if human basic needs are also satisfied and if society assigns more opportunities for those that are in the worst positions. Therefore, institutions, equality, human capabilities, values and culture might be the conduits that are lacking in the explanation of corruption and its possible solutions (Treisman, 2000). Nevertheless, it is not simply a matter of the market versus regulation. Indeed, economic variables such as inflation and GDP per capita should not be excluded from the analysis (Paldam, 2002).
Finally, corruption is not a problem of higher salaries or more incentives for public officials. It goes beyond that realm and framing it in such a way is just a simplistic view. It is by no coincidence that the most corrupt free countries in the world are Scandinavian countries. Equality and the provision of health care, education and recreation as a right, provide the incentives for all members of society to avoid any corrupt behaviors (Jong-Sun and Khagram, 2005). Corruption is a symptom of the structural problems of society. Undoubtedly, institutions play an important role in solving the real causes of a problem that may be present in all spheres of society—the public and private sectors.
Conclusions
Corruption is a term that is yet to be defined. Although several authors conceive of it as an improper use of private or public good for personal gains, this definition does not provide a clear link with its causes, institutions and society. This has limited the possibilities of finding plausible structural solutions and establishing its true nature.
28 This view gives corruption the conception of being a means for encouraging economic development. Some authors argue that corruption can serve as a channel for distributing income and public resources to those sectors of society that have been isolated by the economic and political structures. Others, however, suggest that corruption is a way of removing some of the red tape that slows economic growth and entrepreneurship.
The second group analyzes corruption as a ―tax‖ that contributes to social inefficiencies and lately less economic growth. These authors indicate that corruption is an endogenous phenomenon that is self-reinforcing. Once it is there, it is very hard to remove. The basic explanation for corruption is that individuals are selfish and act as rent-seekers. Thus, increasing salaries in the public sector to provide fewer incentives to be corrupt worsens the problem by attracting talented individuals that at a ―normal‖ salary would be working in the private sector and producing more for society. Thus, corruption is a source for inefficiency. Additionally, if a citizen wishes to obtain a service from a private or public agent, a bribe will be required. Thus, corruption imposes a higher price on goods and services and this may be viewed in the form of a tax.
The IMF also shares the idea that corruption is a ―tax‖ and detrimental to economic growth. This group‘s recommendations see corruption as a problem of society and not a symptom. Furthermore, they constrain the causes of corruption to excessive government, excessive regulation and barriers to trade and capital mobility, since this phenomenon is portrayed as a purely economic problem.
29 Finally, corruption should not be seen as a problem but a symptom of larger problems in society. Economic inequality, lack of opportunities, lack of freedom, and lack of the basic provision of goods for all members of society can be major sources for the spur of corruption. Consequently, corruption should be addressed in a comprehensive matter that goes beyond being an issue of resources towards an issue of fairness.
References
Acemoglu, D. and T. Verdier (1998), ―Property Rights, Corruption and The Allocation Of Talent: A General Equilibrium Approach,‖ Working Paper 243, MIT Economics Department. Available at: http://econ-www.mit.edu/files/243.
Acemoglu, D.; S. Johnson; J. A. Robinson (2001), ―The Colonial Origins of Comparative Development: An Empirical Investigation,‖ American Economic Review, Vol. 91,
No. 5, pp. 1369–1401.
Ali, A. M. and W. M. Crain (2002), ―Institutional Distortions, Economic Freedom, and Growth,‖ Cato Journal, Vol. 21, No. 3, pp. 415-426.
Amundsen, I. (2000), ―Corruption: Definition and Concepts,‖ Chr. Michelsen Institute (CMI), Bergen (Norway). Available at: http://www.u4.no/document/ showdoc.cfm?id=23.
Arnold, Guy (2000), The new South Africa, Palgrave Macmillan, New York.
Barr, A. and D. Serra (2006), ―Culture and Corruption,‖ Global Poverty Research Group, Working Paper, GPRG-WPS-040, Economic and Social Research Council, Available at: http://www.gprg.org/pubs/workingpapers/pdfs/gprg-wps-040.pdf Bayley, D. H. (1966), ―The Effects of Corruption in a Developing Nation,‖ The Western
Political Quarterly, Vol. 19, No. 4, pp. 719-732.
Becker, G. and G. J. Stigler, (1974), ―Law enforcement, malfeasance, and compensation of enforcers,‖ The Journal of Legal Studies, Vol. 3, No. 1, pp. 1–18.
Bhattacharyya, S. and R. Hodler (2008), ―Natural Resources, Democracy and Corruption,‖ Department of Economics - Working Papers Series 1047, University of Melbourne. Available at: http://www.economics.unimelb. edu.au/SITE/research /workingpapers/wp08/1047.pdf.
Bornhorst, Fabian and C. F. Baum (2001), ―LEVINLIN: Stata module to perform Levin -Lin-Chu panel unit root test,‖ Statistical Software Components S419702, Boston College Department of Economics, revised 24 Sep 2006.
Cameron L.; A. Chaudhuri; N. Erkal and L. Gangadharan (2006), ―Propensities to Engage in and Punish Corrupt Behavior: Experimental Evidence from Australia, India, Indonesia and Singapore,‖ Department of Economics, Working Papers Series 943, The University of Melbourne. Available at: http://www.economics. unimelb.edu.au/SITE/research/workingpapers/ wp05/943.pdf.
Chai, A. Y. L. and J. A. Bargh (2002), The use and abuse of power: multiple perspectives
on the causes of corruption, Published by Psychology Press, New York.
Clinard, M. B. (1990), Corporate corruption: the abuse of power, Greenwood Publishing
30 Collier, P. (2003), ―Natural resources, development and conflict: channels of causation and policy interventions‖, IMF Working Paper, 28730. Available at: http://www -wds.worldbank.org/external/default/WDSContentServer/WDSP/IB/2004/04/27/000 265513_20040427110039/Rendered/PDF/28730.pdf.
Collier, P. and A. Hoeffler (1998), ―On the Economic Causes of Civil War,‖ Oxford
Economic Papers, Vol. 50, No. 4, pp. 563-573.
Davoodi, H. R. and V. Tanzi (1997), ―Corruption, Public Investment, and Growth,‖ IMF Working Papers 97/139, International Monetary Fund. Available at: http://
-www.imf.org/external/pubs/ft/wp/wp97139.pdf.
DeLeon, Peter (1993), Thinking about political corruption, M.E. Sharpe, Armonk.
Durham, J. B. (1999), ―Economic Growth and Political Regimes,‖ Journal of Economic
Growth, Vol. 4, No. 1, pp. 81-111.
Fischer, Pius (2006), Rent-seeking, institutions and reforms in Africa: theory and empirical
evidence for Tanzania, Springer, New York.
Foucault, M. (2003), The Birth of the Clinic, Translated by Alan Sheridan, Routledge, New
York.
Friedman, M. and R. D. Friedman (2002), Capitalism and Freedom, University of Chicago
Press, Chicago.
Gibbons, K. M. (1999), ―Variations in Attitudes toward Corruption in Canada,‖ in Political
Corruption: A Handbook, Arnold J Heidenheimer, Michael Johnston and Victor Le
Vine (eds.), Transaction Publishers, Piscataway, pp. 763-780.
Girling, John (1997), Corruption, Capitalism and Democracy, Routledge, New York. Guiso, L., P. Sapienza, and L. Zingales (2006), ―Does Culture Affect Economic
Outcomes?,‖ NBER Working Paper 11999.
Hadri, K. (2000), ―Testing for stationarity in heterogeneous panel data,‖ Econometrics Journal, Vol. 3, No. 2, pp. 148-161.
Halpern, R. and E. Dal Lago (2002), Slavery and emancipation, Wiley-Blackwell,
Hoboken.
Hassett, K. (2007), ―Does Economic Success Require Democracy?,‖ The Journal of the American Enterprise Institute, May/June Issue. Available at:
http://www.american.com/archive/2007/may-june-magazine-contents/does-economic-success-require-democracy/.
Hauk, E. and M. Saez-Marti, (2002) ―On the Cultural Transmission of Corruption,‖ Journal
of Economic Theory, Vol. 107, No. 2, pp. 311-335.
Hayek, F. A. (2001), The Road to Serfdom, Routledge, New York.
Heidenheimer, A. J., M. Johnston, and V. Le Vine (1999), Political Corruption: A
Handbook, Transaction Publishers, Piscataway.
Hindriks, J., M. Keen and Abhinay Muthoo (1999), ―Corruption, extortion and evasion,‖
Journal of Public Economics, Vol. 74, No. 3, pp. 395-430.
Hines, J. Jr. (1995), ―Forbidden Payment: Foreign Bribery and American Business after 1977,‖ NBER Working Paper 5266.Available at: http://www.nber.org/papers /w5266.pdf.
Im, K. S.; M. H. Pesaran and Y. Shin (2003), ―Testing for unit roots in heterogeneous panels,‖ Journal of Econometrics, Vol. 115, No. 1, pp. 53-74.
31 Johnston, M. (2005), Syndromes of Corruption: Wealth, Power, and Democracy,
Cambridge University Press, Cambridge.
Jong-Sung, Y. and S. Khagram (2005), ―A Comparative Study of Inequality and Corruption,‖ American Sociological Review, Vol. 70, No.1, pp. 136-157.
Kaufmann, D. and S. J. Wei (1999), ―Does Grease Money Speed Up the Wheels of Commerce?,‖ World Bank Policy Research Working Paper No. 2254. Available at: http://www.worldbank.org/wbi/governance/pdf/grease.pdf.
Klitgaard, R., (1988), Controlling Corruption, University of California Press, Berkeley.
Kolstad, I. and A. Wiig (2009), ―Is Transparency the Key to Reducing Corruption Resource-Rich Countries?,‖ World Development, Vol. 37, No. 3, pp. 521-532.
Kotkin, Stephen, A. Sajó (2002), Political Corruption in Transition: A Skeptic’s Handbook,
Central European University Press, Budapest and New York.
Kurer, O. (2001), ―Why do Voters support Corrupt Politicians,‖ in The Political Economy
of Corruption, Arvind K. Jain (ed.), Routledge, New York.
Lee-Chai, A. Y., S. Chen and T. Chartrand (2002), ―From Moses to Marcos: Individual Differences in the Use and Abuse of Power,‖ in The use and abuse of power: multiple perspectives on the causes of corruption; A. Y. Lee-Chai, J. A. Bargh
(eds.), Psychology Press, New York, pp. 57-71.
Leff, N.H. (1964), ―Economic Development through Bureaucratic Corruption,‖ American Behavior Scientist, Vol. 8, No. 2, pp.8-14.
Leite, C. A. and Weidmann, J. (1999), ―Does Mother Nature Corrupt? Natural Resources, Corruption, and Economic Growth,‖ IMF Working Paper No. 99/85. Available at SSRN: http://ssrn.com/abstract=259928.
Levin, A.; C. F. Lin and C. Chu (2002), ―Unit Root Tests in Panel Data: Asymptotic and Finite-Sample Properties,‖ Journal of Econometrics, Vol. 108, No. 1, pp. 1-24.
Lui, F. T. (1985), ―An Equilibrium Queuing Model of Bribery,‖ Journal of Political
Economy, Vol. 93, No. 4, pp. 760-781.
Maddala, G. S. and Wu, S. (1999), ―A Comparative Study of Unit Root Tests with Panel Data and New Simple Test,‖ Oxford Bulletin of Economics and Statistics, Vol. 61,
Special Issue, pp. 631-652.
Mauro, P. (1995), ―Corruption and growth,‖ Quarterly Journal of Economics, Vol. 110,
No. 3, pp. 681–712.
Mauro, P. (1997), ―Why Worry about Corruption,‖ International Monetary Fund Economic Issues, No. 6. Available at: http://www.imf.org/external/pubs/ft /issues6/issue6.pdf. Mauro, P. (1998), ―Corruption: cause, consequences and agenda for further research,‖
Finance and Development, March 1998, World Bank, Washington, DC.
Montinola, G. and R. Jackman (2002), ―Sources of Corruption: A Cross-Country Study,‖
British Journal of Political Science, Vol. 32, No. 1, pp. 147-170.
Myrdal, G. (1972), Asian drama; an inquiry into the poverty of nations, Pantheon Books,
1972. (Original 1962.)
North, D. C. (1990), Institutions, Institutional Change and Economic Performance, Cambridge University Press, Cambridge.
North, D. C. and R. P. Thomas (1973), The Rise of the Western World: A New Economic History, Cambridge University Press, Cambridge.
32 Arbor. Available at: www.wdi.umich.edu/files/Publications/WorkingPapers/ wp354.pdf.
Paldam, M. (2002), ―The cross-country pattern of corruption: economics, culture and the seesaw dynamics,‖ European Journal of Political Economy, Vol. 18, No. 2, pp.
215-240.
Pedroni, P. (2004), ―Panel cointegration: asymptotic and finite sample properties of pooled time series tests with an application to the PPP hypothesis,‖ Econometric Theory,
Vol. 20, No. 3, pp. 597-625.
Persyn, D. and J. Westerlund (2008), ―Error Correction Based Cointegration Tests for Panel Data,‖ Stata Journal, Vol. 8, No. 2, pp. 232-241.
Persyn, D. and J. Westerlund (2008), ―XTWEST: Stata module for testing for cointegration in heterogeneous panels,‖ Statistical Software Components S456941, Boston College Department of Economics.
Pessoa, A. (2008), ―Natural resources and institutions: the ‗natural resources curse‘ revisited,‖ Munich Personal RePEc Archive (MPRA) Paper No. 8640. Available at: http://mpra.ub.uni-muenchen.de/8640/1/MPRA_paper_8640.pdf.
Podobnik, B.; J. Shao; D. Njavro; P. Ch. Ivanov and H. E. Stanley (2008), ―Influence of Corruption of Economic Growth Rate and Foreign Investment,‖ European Physical
Journal B, No. 63, pp. 547-550.
Rauch, J.E. and P.B. Evans (2000), ―Bureaucratic structure and bureaucratic performance in less developed countries,‖ Journal of Public Economics, Vol. 75, No. 1, pp. 49–
71.
Rose-Ackerman, S. (1975), ―The economics of corruption,‖ Journal of Public Economics,
Vol. 4, No. 2, pp. 187-203.
Rose-Ackerman, S. (1999), Corruption and government: causes, consequences, and
reform, Cambridge University Press, Cambridge.
Rose-Ackerman, Susan (1978), Corruption: a study in political economy, University of
Michigan, Ann Arbor.
Sachs, J. (2005), The End of Poverty: Economic Possibilities for Our Time, Penguin Press,
New York.
Sala-I-Martin, X. (1997), ―I Just Ran Two Million Regressions,‖ American Economic
Review, Vol. 87, No. 2, pp. 178-183.
Sampford, C. J. G. (2006), Measuring Corruption, Ashgate Publishing, Ltd., Farnham.
Schneider, T. E. (2006), Lincoln’s defense of politics: the public man and his opponents in
the crisis over slavery, University of Missouri Press, Columbia.
Stiglitz, J. (2006), Making Globalization Work, W. W. Norton and Company Limited, New
York.
Stiglitz, J. E., J. A. Ocampo, S. Spiegel, R. Ffrench-Davis, D. Nayyar (2006), Stability with
Growth: Macroeconomics, Liberalization and Development, Oxford University
Press, Oxford.
Tanzi, V. (1999), ―Governance, Corruption and Public Finance: An Overview,‖ in
Governance, Corruption, and Public Financial Management, Salvatore
33 Transparency International (2009), ―Frequently asked questions about corruption: How Do You Define Corruption?,‖ Transparency International, available at: http://www.transparency.org/news_room/faq/corruption_faq#faqcorr1.
Treisman, D. (2000), ―The causes of corruption: a cross-national study,‖ Journal of Public
Economics, Vol. 76, No. 3, pp. 399-457.
Uslaner, E. M. (2008), Corruption, Inequality, and the Rule of Law, Cambridge University
Press, Cambridge.
Warren, M. E. (2004), ―What does Corruption mean in a Democracy?,‖ American Journal of Political Science, Vol. 48, No. 2, pp. 328-343.
Wei, S. J. (2001), ―Does Corruption Relieve Foreign Investors of Burden of Taxes and Capital Controls?,‖ International Taxation and Multinational Activity, James R.
Hines (ed.), University of Chicago Press, Chicago, pp. 73-87.
Werlin, H.H. (1973), ―The Consequences of Corruption: The Ghanaian Experience,‖
Political Science Quarterly, Vol. 88, No. 1, pp. 71-85.
Westerlund, J. (2007), ―Testing for Error Correction in Panel Data,‖ Oxford Bulletin of
Economics and Statistics, Vol. 69, No. 6, pp. 709-748.
Yeung, B. (2001), ―Comment,‖ International Taxation and Multinational Activity, James