Geochemical study of the Northwest Africa
6148 Martian meteorite and its terrestrial
weathering processes
Imanol Torre-Fdez,*
Julene Aramendia,
Leticia Gomez-Nubla,
Kepa Castro
and Juan M. Madariaga
The number of studies of Mars geology through the geochemical analysis of Martian meteorites has been increasing in the last years because of the amount of information that can be obtained about the planet. In this study, a Martian meteorite, the Northwest Africa 6148 nakhlite, has been analysed and characterised, as there were few studies about it. After analysing it by Raman spectroscopy and Scanning Electron Microscope–Energy Dispersive X-ray Spectroscopy coupled to the Structural and Chemical Analyser interface, augite and olivine were identified as the main mineral phases of the sample. Moreover, using the Raman bands position, both minerals’metal proportions were estimated. This methodology used in meteorite studies provides good semi-quantitative results and can offer some advantages to other techniques. In addition, calcite was found, being associated with Earth weathering processes. Surprisingly, Co3O4was detected in the matrix of the meteorite. This is the first time
that this oxide is observed in a meteorite. It was not possible to determine if it is an original compound from Mars or a product of a weathering process on Earth. However, whichever the case may be, solely the presence of this cobalt oxide represents a relevant finding, as it could provide a deeper knowledge of the Martian geochemistry or the Earth weathering processes. Copyright © 2017 John Wiley & Sons, Ltd.
Keywords:Martian meteorite; NWA 6148; nakhlite; Raman; SEM-EDS
Introduction
The nakhlite group of meteorites is probably one of the most interesting groups of Martian meteorites because of the different studies about Mars that can be carried out through them. On the one hand, their composition and structure allow, in an easy way, the study of some Martian biogeochemical properties that cannot be studied through the other meteorites, such as the aqueous activity of the planet due to the presence of Martian aqueous alterations in some of these meteorites.[1] On the other hand, contrary to what occurs with chassignites, enough nakhlites have been found on Earth; thus, it is possible to compare the studies and conclusions obtained with the other nakhlites. Specifically, nowadays, there exist 18 different meteorites catalogued as nakhlites, and generally, they are light and have small masses.[2]
The analyses that have been carried out in nakhlites in the last years have progressively increased. However, one of these nakhlites, Northwest Africa (NWA) 6148, has been scarcely studied. In fact, there are only studies about the germanium dichotomy[3] and its siderophile and chalcophile element abundances.[4]Because of this lack of knowledge about the meteorite NWA 6148, its analysis is crucial, as it can provide new information about the geochemistry of Mars. In the present study, a spectroscopic analysis of this specimen is described.
It must be pointed out that in 2020, two rovers will be sent to Mars to perform in situstudies about the geochemistry of the planet, among other tasks. These two missions are the EXOMARS (European Space Agency) and the MARS2020 (National Aeronautics and Space Administration). Both rovers will carry a Raman spectrometer for the first time to Mars. These instruments have
been designed in order to work under Martian temperature and pressure conditions. However, they must be tested on Earth with Martian original materials (meteorites) in order to check the performance of the instruments. These studies have to be carried out with already characterised meteorites, that is, the Raman analysis of Martian meteorites is more important than ever.
As it is stated in the Meteoritical Bulletin n° 102,[5]the NWA 6148 was found in the region of Northwest Africa, and its fall was not observed. This meteorite was first documented in 2009 when A. Aaronson bought two stones that fitted together to a meteorite dealer in Erfoud, Morocco. It is possibly paired with meteorite NWA 5790, although there are not studies that confirm or deny this fact.
As this meteorite fell in a desert area, it must be taken into account the possible weathering processes that can occur on it. For instance, in arid or desert areas, evaporites are usually formed as a result of Earth’s weathering processes,[6]while in tundra areas, the partial oxidation of the iron from olivines can be observed.[7] This kind of alterations could lead to wrong interpretations and conclusions about the geochemistry of Mars and must be studied.
* Correspondence to: Imanol Torre-Fdez, Department of Analytical Chemistry, Faculty of Science and Technology, University of the Basque Country (UPV/EHU), Barrio Sarriena s/n, PO Box 644, E-48080 Bilbao, Spain.
E-mail: itorre004@ikasle.ehu.eus
Department of Analytical Chemistry, Faculty of Science and Technology, University of the Basque Country (UPV/EHU), Barrio Sarriena s/n, PO Box 644, E-48080, Bilbao, Spain
Received: 14 October 2016 Revised: 3 March 2017 Accepted: 3 March 2017 Published online in Wiley Online Library: 11 April 2017
(wileyonlinelibrary.com) DOI 10.1002/jrs.5148
15
In this sense, the use of non-destructive techniques is highly recommended, because only a limited amount of sample is available and its consumption should be avoided. Raman spectroscopy is a high-value technique as it provides molecular information about the mineral phases present in the samples. For instance, this technique is used in studies about organic compounds analyses in this type of samples[8] or about water presence in inclusions.[9]In addition, it is an exceptional technique in order to study the possible different mineral phases formed or modified by the impact on Earth,[10,11]as the bands of a mineral may vary depending on the pressure and temperature it is subjected to. Moreover, micro-Raman spectroscopy has been proved to be a valuable tool for the investigation of Martian meteorites.[12]It improves the quality of spectra and also allows the performance of Raman imaging, so the mineral phases distribution along the sample can be studied.
Besides molecular information, micro-Raman spectroscopy can provide additional information. For instance, the bands position can be correlated to elemental composition of mineral phases, such as feldspars.[13] This fact is possible because the different proportions among the elements in the minerals can cause little shifts in the positions of the main bands.
Raman spectroscopy can be used along with other techniques, combining the advantages of each one. For example, it can be coupled through a Structural and Chemical Analyser (SCA) interface to a Scanning Electron Microscope–Energy Dispersive X-ray Spectroscopy (SEM-EDS) system.
Experimental procedure
Description and preparation of the sample
For this work, a single sample of the NWA 6148 meteorite acquired by Ikerkuntza eta Berrikuntza Analitikoa research group (University of the Basque Country, UPV/EHU) was analysed. The sample consisted of a portion of the original NWA 6148, which fell in the Northwest Africa region. It is a Martian meteorite that belongs to the nakhlite group, and it was first documented in 2009, with a weigh of 270 g. The analysed sample dimensions are about 5 × 7 × 3 mm, it weighs 0.246 g (0.09% of the original meteorite mass) and it is a fragile rock without visible impact crust, which means it was obtained from the inner part of the NWA 6148. The sample is brownish with several greenish, black and light brown areas (Fig. S1).
In order to avoid a possible contamination of the surface of the analysed sample, the specimen was split, and the inner parts of the sample were analysed.
Instrumentation
Raman spectroscopy
An exhaustive study of the three fragments of the sample was carried out by means of Raman spectroscopy in order to obtain the molecular composition, measuring almost the entire surface of the sample.
On the one hand, a Renishaw inVia Raman micro-spectrometer (Renishaw, UK) equipped with a 532 nm excitation diode laser and a charge-coupled device detector (Peltier cooled) was used. The equipment was coupled to a microscope, and the objectives used were of 20× and 50×. The mean spectral resolution is around 1 cm1, and the spectra were obtained in a range of 100–1800 or
100–3200 cm1, depending on the aim of the analysis. The acquisition parameters used in most of the cases were five accumulations and 5 s. When it was needed, in order to improve the quality of the spectrum, the measurement was set up to ten accumulations and 10 s. Besides punctual analysis, Raman imaging analysis was carried out whenever the surface of the sample was flat enough, obtaining a Raman spectrum every 1 μm. The acquisition parameters used were two accumulations and 5 s of exposure for all the measurements. The Raman imaging spectral results were preprocessed by doing first an automatic baseline correction. This correction is performed by a polynomial fitting, with a polynomial of order 11 and a noise tolerance of 1.50. Afterwards, an automated principal component analysis noise removal procedure was used. Finally, in order to obtain the image, the main Raman band of the compound of interest was selected. Then, the area above the baseline for that band was calculated by the software for all the spectra. With that information, the software coloured the image according to the values obtained previously.
On the other hand, a Renishaw RA-100 Raman spectrometer (Renishaw), coupled to a fibre optic microprobe with a 785 nm excitation diode laser and a charge-coupled device detector (Peltier cooled), was used to carry out some punctual analyses. The spectra were obtained in a range of 200–3200 cm1 with a spectral resolution of 2 cm1and objectives of 20× and 50×. The acquisition parameters used were 20 accumulations and 20 s of exposure for all the measurements.
In both cases, the laser power was modulated in order to avoid thermodecomposition and chemical or mineralogical transformations. The power applied was set at the source at a maximum of 50 mW, while on the sample was always less than 20 mW. The number of accumulations and the acquisition time were optimised for each measurement in order to improve the signal-to-noise ratio. The calibration of both equipment was performed daily with a silicon slice, using its 520.5 cm1 band. The software used for data analysis and interpretation was theOMNIC 7.2 software (Thermo Fisher-Nicolet, Madison, USA). Data interpretation was carried out by comparison of spectra with pure standard spectra contained in the e-VISARCH[14]and e-VISART[15] spectral databases, in RRUFF online database[16] and in bibliography.
Raman spectrometer coupled to Scanning Electron Microscope
In the cases where a deeper study was needed, a Raman spectrometer was used coupled to a SEM-EDS instrument through the SCA interface (SCA, Renishaw). The elemental characterisation was obtained by the EDS detector, whereas the Raman spectrometer (through the SCA interface) provided the molecular information in the same micro-metric spot, inside the SEM chamber under vacuum. This device has been found to be very reliable and adequate in order to measure different types of samples, such as black slag[17] or airborne particles.[18] Although those sample matrices are different from the one studied in this work, we believe that the information and characteristics of this methodology are adequate for the analysis of meteorites, as it is described and proved in the present work.
In the elemental composition determination of the three fragments of the sample carried out using the SEM-EDS system, the EDS analysis was performed with a set excitation energy of 20 keV and using imaging analysis. The Raman spectrometer coupled to this SEM-EDS system to measure the sample in the same
15
micro-metric spot performed the measurements simultaneously with a secondary electron imaging system inside the SEM chamber. Thereby, first, an electron scanning image of the sample surface was obtained using the SEM. Then, EDS allowed the elemental mapping of the area, and with this information, the Raman laser beam was focused on the area of interest to acquire the Raman spectra.
In order to perform this type of analysis, an EVO®40 Scanning Electron Microscope (Carl Zeiss NTS GmbH, Germany) was used coupled to an X-max Energy Dispersive X-ray spectroscopy system (Oxford Instruments, UK). SEM images were acquired at high vacuum employing an acceleration voltage of 20 kV. For a more detailed analysis, a secondary electron detector was used, reaching magnifications of up to 10 000×. The elemental mapping analysis was carried out using the EDS with a working distance of 8.5 mm, a take-off angle of 35° and an acceleration voltage of 20 kV.
For the Raman spectroscopy analyses, a Renishaw inVia Raman micro-spectrometer, with a Peltier-cooled (70°C) detector was used. Punctual measurements were made using a 514 nm excitation laser in the areas of interest inside the SEM chamber. The mean spectral resolution was around 1 cm1. The acquisition parameters used were 20 accumulations and 20 s of exposure for all the measurements. The applied power of the laser was set at the source at a maximum of 50 mW, while on the sample was always less than 20 mW. The software used for the data collection was the Renishaw Wire 3.2.
Results and discussion
The results obtained in the characterisation of the NWA 6148 nakhlite will be shown and discussed next.
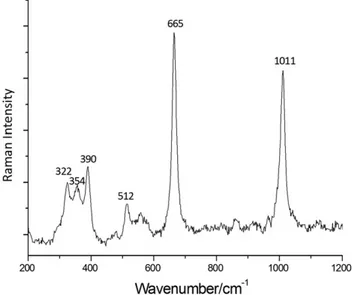
By means of Raman spectroscopy, it was found that the matrix of the analysed sample is formed mainly of augite, (Ca, Na)(Mg, Fe, Al, Ti)(Si, Al)2O6, as it is usual in nakhlites[19] (Fig. 1). This pyroxene mineral is characterised by the Si–O bridging vibration mode at 1011 cm1, the Si–O bending mode at 665 cm1and the Metal– O stretching vibration mode in the 300–400 cm1 range (322 cm1for the Fe–O, 354 cm1for the Ca–O and 390 cm1for the Mg–O). This mineral is usually defined by its content of Fe, Mg and Ca, given as ferrosilite (Fs, Fe2Si2O6), enstatite (En, Mg2Si2O6)
and wollastonite (Wo, Ca2Si2O6), respectively. Depending on the proportions of each element in the augite, the Raman spectra’s bands position changes accordingly. These changes are associated to the different stretching and bending modes of each bond present in the mineral molecule.[20]The changes of these bands position are used to calculate the proportion of the metals of interest, that is, Fe, Mg and Ca. Experimentally, all the Raman spectra of augite grains measured had the same band positions, which led to think that there was only a single metal composition of augite in the analysed NWA 6148 sample.
E. Huanget al.[20]published a work about the different stretching and bending modes of different pyroxenes and how they affect the Raman band position. They found that some band positions are correlated to the metal proportions present in the mineral phase. Moreover, they observed that the major-element composition of the (Mg, Fe, Ca)-pyroxenes can be semi-quantitatively determined on the basis of these band position variations. On the basis of this information and the different pyroxenes analysed in that work, the Fe, Ca and Mg proportions of the augite present in the analysed NWA 6148 meteorite were estimated. The results obtained were En34Fs16Wo50for the Mg, Fe and Ca. The confidence intervals for this result cannot be calculated as E. Huanget al.[20]did not provide them in their work.
In order to contrast this result, the work of A. Wanget al.[21]was used. They made a multiple linear regression, which correlates
XMg2þ
andXCa2þ
to the Raman band position of 665 cm1(v2) for Eqn (1) and to the Raman band position of 332 cm1(v3) for Eqn (2). Both equations form a system, where XMg2þ and XCa2þ are the unknown quantities that must be solved. The results obtained by means of this regression for the augite present in the analysed NWA 6148 meteorite were En26±3Fs36±4Wo38±4.
v2¼ð31:9±2:2ÞXMg
2þ
ð7:7±4:8ÞXCa2þþ655:0±1:5 (1)[21]
v3¼ð51:7±2:6ÞXMg
2þ
þð20:5±5:9ÞXCa2þþ297:3±1:9 (2)[21] Here, v2 and v3 are the Raman spectrum bands 665 and 322 cm1, respectively,XMg2þ
= [moles Mg2+/(moles Mg2++ moles Fe2++ moles Ca2+)] andXCa2þ
= [moles Ca2+/(moles Mg2++ moles Fe2++ moles Ca2+)].
Besides the results obtained through these two works, in the Meteoritical Bulletin Database,[5]it is stated that the augite metal composition for the NWA 6148 is En35Fs23Wo42.
[5]
As it can be observed, the obtained three results of the augite composition (from the works of Huang et al.,[20] Wang et al.[21] and the Meteoritical Bulletin Database[5]) have significant differences. To check which one of these sources was more reliable in order to characterise the augite in the NWA 6148 sample, a SEM-EDS imaging analysis was carried out in five augite grains, which were also measured by the Raman spectrometer through the SCA interface. The obtained results (Table 1) were compared with the ones previously mentioned (Fig. 2).
As it can be observed, the different augite grains measured by EDS have a high dispersion. As we performed all the EDS analyses with a set excitation energy of 20 keV, this parameter was not the source of the dispersion.
This dispersion was not observed when the metal composition of the augite was estimated through Raman spectroscopy, as the Raman spectra obtained had constant band positions. This fact led to the conclusion that the Raman methodology approach had
Figure 1. Augite Raman spectrum found in the matrix of the sample,
obtained with the 785 nm excitation laser.
15
less sensitivity to the changes in elemental composition than the EDS. Thus, by Raman spectroscopy, it was not possible to see the variations that were seen by EDS. However, the obtained mean values of the five grains for each metal (Table 1) are equal to the
ones from the work by Wanget al.[21]This fact led us to think that the work of Wanget al.[21]provided the best results for the augite composition of the meteorite NWA 6148 specimen in terms of accuracy.
Olivine, (Mg, Fe)2SiO4, was also found in the specimen as the second more relative abundant mineral. The first time this compound was found in the analysed sample was by means of Raman spectroscopy, in which the spectrum primary bands of the olivine were observed (817–819 and 841–847 cm1, corresponding to symmetricυ1and asymmetricυ3stretching vibrations of the SiO4 tetrahedra) along with some of its secondary bands (909 cm1, attributed toυ3derived vibrations and 522 cm1, assigned to the asymmetric deformationυ4of the SiO4) (Fig. 3). The position of the bands of the olivine varied from one spectrum to another, because of the presence of olivines with different chemical compositions.
In this case, the two main bands present in the spectra, which appear in the range of 841–847 cm1(K1) and 817–829 cm1(K2), are related to the Si–O symmetric stretching and to the Si–O asymmetric stretching, respectively.[22]This variation in the position of the bands is related to the proportion of Fe and Mg present in the mineral, given as content of fayalite (Fa, Fe2SiO4) and forsterite (Fo, Mg2SiO4), respectively.[19]The fact that the wavenumber of the main bands of olivine varied experimentally leads to the conclusion that there were different types of olivines in the matrix of the NWA 6148 meteorite sample regarding the proportion of Mg and Fe. In order to characterise them, four different calibration curves were considered (Eqns (3)–(6)), obtained from two published works.[22,23] In them, the correlation of the position of the two main bands (K1 and K2) is studied regarding %Mg, where %Mg is given as a decimal fraction and is defined as Mg/(Mg + Fe). On the one hand, in the work of T. Mouri et al.,[22]several natural and synthetic olivine crystals of different chemical compositions were characterised by means of Wavelength Dispersive Spectroscopy, Energy Dispersive Spectroscopy and Raman spectroscopy, and the %Mg of the different olivines was correlated with the band position of the two main bands of this mineral. On the other hand, in the work of K. E. Kuebleret al.,[23]Electron Microprobe and Raman spectroscopy were the techniques used in order to correlate the %Mg and the Raman bands position.
Figure 2. Representation ofXi(whereX= [molesi/(moles Mg + moles
Fe + moles Ca)] andi= Mg, Fe, Ca) for the five augite grains measured by Energy Dispersive X-ray Spectroscopy and for the results obtained through the works of Huanget al.,[20]Wanget al.[21]and the Meteoritical Bulletin Database.[5]
Figure 3. a) Olivine Raman spectrum measured in the sample, obtained with the 532 nm excitation laser and b) a zoom in of the 800–860 cm1range of the
spectrum, where it is observed the wavenumber variation in the different olivine spectra detected in the studied sample.
Table 1. Concentrations of the Mg, Fe and Ca that form the augite
observed by Energy Dispersive X-ray Spectroscopy
XMg XFe XCa
Grain 1 24.8 ± 3.2 35.6 ± 2.8 39.6 ± 2.6
Grain 2 33.5 ± 2.0 26.2 ± 1.4 40.3 ± 1.5
Grain 3 29.6 ± 0.8 29.2 ± 0.7 41.2 ± 0.7
Grain 4 24.9 ± 2.0 43.8 ± 1.8 31.3 ± 1.4
Grain 5 21.9 ± 1.1 39.0 ± 1.0 39.2 ± 0.9
Mean value 26.9 ± 4.4 34.8 ± 3.9 38.3 ± 3.5
15
%Mg¼ 610:65þ1:3981K10:00079869K21 (3) [22]
%Mg¼38847:1256þ86:9086K10:048382K 2 1
100 (4)
[23]
%Mg¼ 3715:8þ8:9889K20:0054348K22 (5) [22]
%Mg¼484679:0451þ1172:7260K20:70923K 2 2
100 (6)
[23]
These calibration curves were tested in the laboratory with a commercial standard of olivine, which had a known composition of Fo89Fa11. The mineral phase characterisation was carried out by X-ray diffraction, whereas wavelength dispersive X-ray fluorescence was used for the elemental quantification. It was confirmed that composition of this olivine was Fo89±2Fa11±2(confidence interval of 95%, considering the uncertainty associated to the standard deviation of the results).This olivine standard was then used to test the four calibration curves. Ten different grains of the olivine standard were measured, and the obtained Raman band positions were introduced in each calibration curve. Then, the mean value of the %Mg obtained with each equation was calculated, with the confidence interval at 95%, taking into account the uncertainty associated to each calibration curve and the standard deviation of the results. Observing the results (Table 2), it was concluded that Eqn (3) was the one that suited better with the real values of the olivine standard, as the results obtained with it were very accurate and had the smallest uncertainty.
Finally, the composition of the olivines present in the meteorite NWA 6148 sample was calculated using the selected calibration curve (Eqn (3)). The composition range of the olivines was Fo25.4
±3Fa74.6±3–Fo55.3±3Fa44.7±3, where the confidence interval is given as the uncertainty coming from the calibration curve. As it can be seen, the olivines present in the sample had, for the most part of the range, a higher content of iron than magnesium, which corresponds to the usual proportions found in nakhlites.[19] Furthermore, the olivine composition that is stated in literature for the NWA 6148 is Fo42.0Fa58.0for the core of grains of olivine and Fo25.5Fa74.5for the rims of the grains.[2]Experimentally, it was not possible to differentiate the cores and the rims of the grains of the analysed olivine. However, olivines with the richest iron content found experimentally (Fo25.4±0.3Fa74.6±0.3) match perfectly with the composition of the olivines in the rims found in the literature (Fo25.5Fa74.5). This high concentration of iron in the olivine would gradually decrease until reaching the centre of the core of the grain, which would explain the presence of different proportions of Fe and Mg found in the sample. For these olivine grain cores, where the highest amount of Mg is found in the
mineral phase, the composition found experimentally (Fo55.3
±0.3Fa44.7±0.3) differs significantly from the one stated in the literature (Fo42.0Fa58.0). This difference could be explained because the NWA 6148 nakhlite is heterogeneous in the composition of this mineral phase; thus, olivine with a higher content of Mg could have been found in the cores of the grains in the present work.
Regarding other nakhlites, in the literature, there is no mention of any other nakhlite olivine grains with a higher content of Mg than the ones found in this work in the NWA 6148.[19]In consequence, this meteorite would become the nakhlite with the highest amount of magnesium in the core of its olivine grains, with a 55.3%. The second one would be the NWA 817, with a 43% of magnesium in the core of its olivine grains.[24]As it can be seen, there exists a notable difference between both compositions, which could lead to think that some nakhlites may have more magnesium content in olivines than it was thought and stated in bibliography.
The distribution of Mg in the olivine grains is related to the element diffusion during the solidification and crystallisation process of the magma from which the mineral was formed.[19] The fact that different olivine compositions have been found in different meteorites leads to think that the crystallisation of that magma was not homogeneous. This fact would mean that the magma had different zones that crystallised faster than others, leading to different element diffusion among the formed mineral phases. In this case, the high Mg content would mean larger and sharper olivine grains.[19]
In addition to the common mineral phases of nakhlites (augite and olivine), more compounds were found in the NWA 6148 specimen. When the sample was analysed for the first time with the SEM-EDS coupled to the Raman system although SCA interface for the characterisation of the augite, the presence of cobalt was noticed in some small and isolated areas of one of the meteorite fragments (Fig.4). Cobalt was not distributed homogeneously through the area, a fact that would be observed if this element appeared as substitutional atoms in crystallographic defects of other mineral phases. Both facts led to think that the analysed area was composed of at least one compound where the cobalt was the main metal, as its distribution was neither homogeneous nor large. Using the Raman spectrometer coupled to the SEM-EDS system, the Raman spectrum of the area rich in cobalt was obtained (Fig. 5).
Table 2. Results of the composition of the standard of olivine using the
four considered calibrates
Real composition of olivine (WD-XRF)
Eqn (3) Eqn (4) Eqn (5) Eqn (6)
Fo (%) 89 ± 2 89 ± 3 91 ± 6 89 ± 5 96 ± 5
Fa (%) 11 ± 2 11 ± 3 9 ± 6 11 ± 5 4 ± 5
WD-XRF, wavelength dispersive X-ray fluorescence.
Figure 4. Scanning Electron Microscope image of one side of one of the
Northwest Africa 6148 fragments and the Co presence (energy of the Co represented in red) analysed by Energy Dispersive X-ray Spectroscopy.
15
In the collected experimental spectrum, it can be seen the band attributed to the stretching vibrations of the oxygen atoms inside the octahedral unit Co(III)O6(691 cm1) and the bands assigned to the second F2gsymmetry species (484 and 521 cm
1 ).
As can be seen, the signals of the compound present in that area are located at 482, 521 and 691 cm1, which coincide with the main and the two most intense secondary Raman-active modes of the Co3O4(691, 618, 521, 482 and 194 cm
1 ).[25]
A larger area (200 × 150μm) was analysed by Renishaw inVia Raman micro-spectrometer doing punctual analysis. It was found that in the same grain, Co3O4and augite were present (Fig. 6).
This cobalt (II, III) oxide is a mixed valence black compound with antiferromagnetic properties.[26] Regarding its presence in meteorites, it is not stated in the literature that this oxide has been observed earlier in any kind of meteorite. In order to explain the presence of this compound in the sample, two hypotheses were
proposed. On the one hand, it could be an original compound that comes from Mars with the meteorite. However, this statement cannot be ensured with the available data. On the other hand, it could be an alteration product formed on Earth because of weathering processes or because of the impact of the meteorite on the Earth’s surface.
This last theory could be supported by several facts found in the literature. The NWA 6148 nakhlite, as it was explained previously, was first documented when it was purchased from a meteorite dealer in Erfoud, Morocco. Although its fall was not observed, it is known that it occurred in the region of Northwest Africa. According to bibliography,[27]there is a geographic range in Morocco where rocks are rich in cobalt, which is the so-called Anti-Atlas range. In fact, in this range, the Bou Azzer mine can be found, which is the only mine in the world that extracts cobalt as a primary product. In addition, the city of Erfoud, where the meteorite was first documented, is located on the northeast limit of the Anti-Atlas range, only 325 km far away from Bou Azzer. Taking into account these facts, it was thought that the meteorite could have fallen in the Anti-Atlas range, impacting into an area rich in cobalt. Because of the heat and pressure generated in this impact, the cobalt would have integrated into the structure of the NWA 6148 nakhlite meteorite, forming the cobalt (II, III) oxide. This would explain the presence of cobalt along with augite in different proportions in the same grains of the sample. If this hypothesis was true, the Co3O4 would not be an original compound from Mars but one formed because of the impact of the NWA 6148 with the terrestrial surface.
However, Co3O4is formed when CoO is heated at around 600– 700°C in presence of oxygen.[26]It is not found on Earth surface, as cobalt appears in our planet as a metallic component along with arsenic in minerals such as cobaltite, safflorite, glaucodot and skutterudite.[28]This fact provides another possible explanation to the presence of Co3O4in the sample, as an original compound of the meteorite. If this was true, it would mean the discovery of a new compound present in Mars. Because of the formation conditions that the Co3O4needs, it would have formed at the same time with olivine or augite during the crystallisation of magma. As it is the thermodynamically stable form of cobalt oxide,[29]it would
Figure 5. Raman spectrum obtained inside the Scanning Electron
Microscope chamber in the highest Co presence spot by means of Structural and Chemical Analyser interface, obtained with the 514 nm excitation laser.
Figure 6. Raman spectrum of a Co3O4rich area in which there is presence
of both augite and Co3O4, obtained with the 532 nm excitation laser.
Figure 7. Calcite spectrum found in the Northwest Africa 6148 sample,
obtained with the 785 nm excitation.
15
have remained in that form without any chemical transformation until nowadays.
Finally, calcite was also found in the sample by means of Raman spectroscopy (Fig. 7). In the collected experimental spectrum, it can be seen theυ1symmetric CO3stretching at 1087 cm
1
and external vibration of the CO3 group that involve translatory oscillations between the anionic group and the Ca at 282 cm1. Contrarily to the case of the Co3O4, in this case, the presence of calcite is usual in this type of samples and justified because of the weathering processes that take place in desert areas,[6,30–32]because calcite crystallises by the evaporation of water, rich in carbonates, that may flow through the veins of the meteorite. This process of formation would explain the fact that calcite is scarce in the sample, as it would be only present in the veins or pores of the NWA 6148. Nevertheless, it must be noted that calcite is present in Mars surface, as it was detected by Phoenix Mars lander.[33]In the case of the analysed NWA 6148 sample, experimentally, it was detected only in a few spots of the sample, and its Raman bands intensity was always very low, which led to think that it was present in the sample in a low relative presence and it was the result of weathering in the veins and pores of the meteorite.
Conclusions
The geochemical characterisation of the NWA 6148 Martian meteorite has been meaningful in order to have a deeper knowledge of the mineral composition present in Mars surface. In this regard, several olivines that were found in this meteorite sample had a higher content of Mg than the ones found in other nakhlites until now. This fact means that there are still things to be discovered in already known mineral phases. In order to obtain these results, the position of the Raman spectra bands was used to estimate the metal proportions of the main mineral phases of nakhlites. Although this methodology does not provide quantitative results and is estimative, it can be a good alternative to other methods, which may be more expensive, tedious or destructives.
In addition to olivines, the augite present in the meteorite was characterised. Several approaches were tested in order to determine the metal concentrations through the position of the Raman bands and finally compared with the EDS results. It was noticed that while augite’s composition seemed to be constant by Raman band positions, EDS analysis showed that the composition was heterogeneous. However, the mean composition of the augite grains analysed by EDS was similar to that predicted by Raman analysis.
Besides, other materials were found in the NWA 6148 sample, such as calcite. In this case, it was crucial to know the impact and finding place of the meteorite in order to determine if the calcite was original from Mars or a weathering product.
Regarding the finding of the Co3O4, the results do not let us confirm the origin of its presence. However, it is possible to point out two sources. On the one hand, this compound could have been formed after the NWA 6148 impacted Earth surface. This hypothesis would be supported by the place where the meteorite NWA 6148 was found, a rocky area in Morocco rich in cobalt. On the other hand, the Co3O4could be an original compound formed in Mars. This hypothesis would be supported by the conditions needed for its formation and by the fact that it is not formed or found naturally on Earth.
In this regard, non-destructive techniques such as the ones used in this work were found insufficient to explain the provenance of
the Co3O4. Because of this, we believe that destructive techniques may be suitable for specific needs of analysis in this type of sample, even though they are not recommended because of the limited amount of this kind of samples that exist on our planet. Thus, we prefer to be cautious and say that the presence of Co3O4in this specimen is due to an Earth weathering process.
Acknowledgements
This work has been financially supported by the project
‘Development of the Raman instrument for the ESA Mission Exomars 2018: Science support, equipment testing and operation support’ (ref. ESP2014-56138-C3-2-R) funded by the Spanish Ministry of Economy and Competitiveness and the European Regional Development Fund. Authors would like to thank to the Advanced Research Facilities (SGIker) of the University of the Basque Country for all their support (General X-rayService and LASPEA laboratory).
References
[1] J. D. Stopar, G. J. Taylor, M. A. Velbel, M. D. Norman, E. P. Vicenzi, L. J. Hallis,Geochim. Cosmochim. Ac.2013,112, 208.
[2] Meteoritical Bulletin Database, Lunar and Planetary Institute, http:// www.lpi.usra.edu/meteor/ [16 September 2016].
[3] M. Humayun, S. Yang, K. Righter, B. Zanda, R. h Hewins, Lunar & Planetary Science Conference XLVII2016.
[4] S. Yang, M. Humayun, K. Righter, G. Jefferson, D. Fields, A. J. Irving,
Meteorit. Planet. Sci.2015,50, 691.
[5] A. Ruzicka, J. Grossman, A. Bouvier, C. D. K. Herd, C. B. Agee,The Meteoritical Bulletin2015,102, 34.
[6] T. Tomkinson, M. R. Lee, D. F. Mark, K. J. Dobson, I. A. Franchi,Meteorit. Planet. Sci.2015,50, 287.
[7] M. D. Dyar, A. H. Treiman, C. M. Pieters, T. Hiroi, M. D. Lane, V. O’Connor,
J. Geophys. Res.2005, 110.
[8] S. A. Sanford, J. Aléon, C. M. O’D Alexander, T. Araki, S. Bajt, G. A. Baratta, J. Borg, J. P. Bradley, D. E. Brownlee, J. R. Brucato, M. J. Burchell, H. Busemann, A. Butterworth, S. J. Clemett, G. Cody, L. Colangeli, G. Cooper, L. D’Hendecourt, Z. Djouadi, J. P. Dworkin, G. Ferrini, H. Fleckenstein, G. J. Flynn, I. A. Franchi, M. Fries, M. K. Gilles, D. P. Gravin, M. Gounelle, F. Grossemy, C. Jacobsen, L. P. Keller, A. L. David Kilcoyne, J. Leitner, G. Matrajt, A. Meibom, V. Mennella, S. Mostefaoui, L. R. Nittler, M. E. Palumbo, D. A. Papanastassiou, F. Robert, A. Rotundi, C. J. Snead, M. K. Spencer, F. J. Stadermann, A. Steele, T. Stephan, P. Tsou, T. Tyliszczak, A. J. Westphal, S. Wirick, B. Wopenka, H. Yabuta, R. N. Zare, M. E. Zolensky, Science 2006,
314, 1720.
[9] M. E. Zolensky, R. J. Bodnar, E. K. Gison Jr., L. E. Nyquist, Y. Reese, C. Y. Shih, H. Wiesmann,Science1999,285, 1377.
[10] E. L. Walton, T. G. Sharp, J. Hu, J. Filiberto,Geochim. Cosmochim. Ac. 2014,140, 334.
[11] T. G. Sharp, A. El Goresy, B. Wopenka, M. Chen,Science1999,284, 1511. [12] R. Hochleitner, N. Tarcea, G. Simon, W. Kiefer, J. Popp, J. Raman
Spectrosc.2004,35, 515.
[13] J. J. Freeman, A. Wang, K. E. Kuebler, B. L. Jolliff, L. A. Haskin,Can. Mineral.2008,46, 1477.
[14] M. Perez-Alonso, K. Castro, J. M. Madariaga,Curr. Anal. Chem.2006,
2, 89.
[15] K. Castro, M. Perez-Alonso, M. D. Rodriguez-Laso, L. A. Fernandez, J. M. Madariaga,Anal. Bioanal. Chem.2005,382, 248.
[16] R. T. Downs, The RRUFF Project: an integrated study of the chemistry, crystallography, Raman and infrared spectroscopy of minerals. Program and Abstracts of the 19th General Meeting of the International Mineralogical Association in Kobe, Japan,2006, 003-13. http://rruff.info/.
[17] L. Gomez-Nubla, J. Aramendia, S. F.-O. De Vallejuelo, K. Castro, J. M. Madariaga,J. Raman Spectrosc.2013,44, 1163.
[18] J. Aramendia, L. Gomez-Nubla, K. Castro, J. M. Madariaga,Microchem. J. 2015,123, 267.
[19] A. H. Treiman,Chem. Erde2005,65, 203.
15
[20] E. Huang, C. H. Chen, T. Huang, E. H. Lin, J. A. Xu,Am. Mineral.2000,85, 473.
[21] A. Wang, B. L. Jolliff, L. A. Haskin, K. E. Kuebler, K. M. Viskupic,Am. Mineral.2001,86, 790.
[22] T. Mouri, M. Enami,J. Mineral. Petrol. Sci.2008,103, 100.
[23] K. E. Kuebler, B. L. Jolliff, A. Wang, L. A. Haskin,Geochim. Cosmochim. Ac. 2006,70, 6201.
[24] V. Sautter, J. A. Barrat, A. Jambon, J. P. Lorand, P. Gillet, M. Javoy, J. L. Joron, M. Lesourd,Earth Planet. Sc. Lett.2002,195, 223.
[25] V. G. Hadjiev, M. N. Iliev, I. V. Vergilov,J. Phys. C Solid State1988,21, 199. [26] N. N. Greenwood, A. Earnshaw,Chemistry of the Elements,
Butterworth-Heinemann, Oxford,1997, p. 1118.
[27] U. S. Department of the Interior, U. S. Geological Survey,Minerals Yearbook, Area Reports: International 2011, Africa and the Middle East, volume III, USGS: Washington, DC,2011, p. 312.
[28] A. F. Holleman, E. Wiberg, N. Wiberg, Lehrbuch der AnorganischenChemie, de Gruyter: Berlin, pp. 1146–52.
[29] S. C. Petitto, E. M. Marsh, G. A. Carson, M. A. Langell,J. Mol. Catal. A-Chem.2008,281, 49.
[30] F. Rull, J. Martinez-Frias, A. Sansano, J. Medina, H. G. M. Edwards,
J. Raman Spectrosc.2004,35, 497.
[31] L. J. Hicks, J. C. Bridges, S. J. Gurman,Geochim. Cosmochim. Ac.2014,
136, 194.
[32] A. H. Treiman, A. J. Irving,Meteorit. Planet. Sci.2008,43, 829. [33] W. V. Boynton, D. W. Ming, S. P. Kounaves, S. M. M. Young,
R. R. Arvidson, M. H. Hecht, J. Hoffman, P. B. Niles, D. K. Hamara, R. C. Quinn, P. H. Smith, B. Sutter, D. C. Catling, R. V. Morris,Science 2009,325, 61.
Supporting information
Additional Supporting Information may be found online in the supporting information tab for this article.