An epidemiologic view of the etiology of multiple sclerosis
Arch Neurocien (Mex) Vol 11, No. 2: 90-99, 2006
medigraphic.com
An epidemiologic view of the etiology of multiple
sclerosis
John F. Kurtzke
Arch Neurocien (Mex)Vol. 11, No. 2: 90-99, 2006 ©INNN, 2006
Recibido: 20 febrero 2006. Aceptado: 3 marzo 2006.
Consultant in Neurology and Neuroepidemiology, Neurology Service, Veterans Affairs Medical Center, Washington, D.C; and Professor Emeritus, Department of Neurology, Georgetown University School of Medicine, Washington, D.C. Correspondence: John F. Kurtzke. Neurology Service (127). VA Medical Center. Washington, D.C. 20422. E-mail: [email protected]
Artículo revisión
VISIÓN EPIDEMIOLÓGICA DE LA ETIOLOGÍA DE LA ESCLEROSIS MÚLTIPLE
RESUMEN
La distribución geográfica de la esclerosis en placas ha cambiado notablemente en la segunda mitad del siglo pasado con un lento crecimiento de un origen aparente en escandinavia hacia una alta frecuencia uniforme en toda europa, una disminución en la diferencia de incidencia norte-sur en norteamérica y frecuencias medias en el norte de África, sudamérica y aún en Japón. Los migrantes de regiones de alta frecuencia a la baja mantienen su riesgo si se cambian después de los 15 años, mientras que los que cam-bian de zonas de baja a alta frecuencia aumentan su riesgo, si se cambian entre el nacimiento y los 40 años. En las Islas Faroe aparecieron epidemias sucesivas después de la ocupación por tropas británicas en la Segunda Guerra Mundial. Esto parece indicar que la esclerosis múltiple es el resultado de una infección única y desconocida que se adquiere entre los 11 y 45 años con un largo periodo de incubación, a la aparición de la enfermedad.
Palabras clave: esclerosis múltiple, infección persona a persona, susceptibilidad a cierta edad, exposición prolongada.
ABSTRACT
The geographic distribution of multiple sclerosis has been changing markedly in the last half century, with a slow spread from an apparent origin in Scandinavia toward one of almost uniform high frequency throughout Europe; a lessening of a high-north-lower-south diffe-rence in North America; and medium frequency rates for much of northern Africa, South America, and (now)
even Japan. Migrants from high MS areas to low keep the risk of their birthplace only if they move beyond age 15, while those who move from low to high increase their risk of MS even beyond that of their new homeland for moves between birth and age 40 or so. MS occurred in the Faroe Islands as successive epidemics following their occupation by British troops in World War II. All these findings are compatible with the view that clinical MS is the rare result of a unique, but unknown, wides-pread persistent infection most often acquired between age 11 and 45 or so, and with a prolonged latent or incubation period between acquisition and clinical disease.
Key words: multiple sclerosis (m-s), changes of distribution, person to person infection, age suscep-tibility, prolonged exposure.
he generally accepted view is that multiple sclerosis is primarily an autoimmune disease precipitated by (undefined) environmental factors in a genetically predisposed host. My interpretation of the epidemiologic information, however, is that the “environmental factors” include the principal cause of this illness. Epidemiologic works are concerned with the frequency of diseases, and their characteristics by race, sex, geography, and other risk factors, as well with as the severity and course of the illness. Such information is needed and should be used
T
John F. Kurtzke Vol 11, No. 2: 90-99, 2006
medigraphic.com
by all aspects of the health care system, from govern-ment to clinician. And if there is enough epidemiologic information about a disease, this should provide strong clues to its etiology. The epidemiologic unit is a person with a given disorder. After diagnosis, the basic question is how common is the disease. This frequency should be described by the best count of the number of cases as numerator within the specific populations at risk as denominator. These ratios, with the addition of the time period to which they pertain, are referred to as rates.
The population-based rates in common use are the incidence rate, the mortality rate, and the prevalence “rate.” The incidence or attack rate is defined as the number of new cases of the disease beginning clinically in a unit of time within the specified population. This is usually given as an annual incidence rate in cases per 100,000 population per year. The
mortality or death rate refers to the number of deaths with the disease as the (underlying) cause of death occurring within a unit of time and population, and thus an annual death rate per 100,000 population. The point prevalence “rate” is more properly called a prevalence ratio, and it refers to the number of the affected within the community at one point in time, again expressed per unit of population.
The Association for Research in Nervous and Mental Disease meets annually in New York to present a symposium on one specific topic. Their first session in 1920 dealt with von Economo’s encephalitis. The second was on multiple sclerosis. This was the first comprehensive assessment of MS in the United States. (References to this and other uncited works are in Kurtzke 20001.) The Commission then concluded that
MS affected chiefly young adults and men more than women. Duration averaged eight years, and it seemed to affect skilled manual workers more often. Geographically, in the United States it was most common near the Great Lakes, and in Europe more in the north than the south. The male excess was found for most of the European studies and all those from the US, with an overall average of 3:2, male : female.
Male preponderance was also seen for MS death rates near 1960 in the US, but only among those of higher age. White women were clearly in excess at younger ages (figure 1). Incidence and prevalence rates in Denmark near 1950 had a similar pattern, with higher rates for women among the younger patients and equal rates by sex in the older ones. However, an increasing excess of women in Denmark has characterized the incidence rates for over 50 years. Two regions of Norway also demonstrated a growing
female excess over time. Sweden too has shown an increasingly higher majority among women3. By 1980
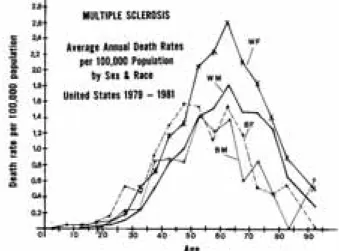
white women had the highest death rates in the US at all ages (figure 2). Note that young black women seemed then to have rates similar to the whites.
We have studied MS in the United States among some 5,300 veterans of World War II or the Korean Conflict, who were service connected by the Department of Veterans Affairs (VA) for MS. They were matched with preillness peers from the military. White women had nearly twice the risk of MS as the white men, with a relative risk ratio of 1.79. There does then seem to have been a change from a disorder more often affecting men to one that shows an increasing preponderance among women. The excess among whites versus those of other races had persisted, however. Relative risk ratios were 0.44 for black males and 0.22 for other males (non-white, non-black.)
Figure 2. Average annual age specific death rates per 100,000 population for MS by sex and race, United States 1979-1981. From Kurtzke 20001.
medigraphic.com
A more recent series is under study. This comprises over 5,000 US veterans with military service in the Vietnam War or later up to 1994, who also were service connected for MS by the VA, and who were matched on a 1:2 basis with military peers4. Women of
all races, whether white, black or other, now have a greater risk of MS than the white men, with relative risk ratios each nearly 3 to 1. Black men, though still below the whites, have a significantly higher risk ratio of 0.67 than they showed in the World War II series. Men of other races had little change, with relative risk of 0.30. There has to be an environmental reason for the growing predominance of women from an earlier male excess. The changing ratios by race also suggest that these differences too are also based more on environment than genes.
Geographic distributions are best defined by prevalence studies, of which there are now far more than 300 for MS. Prevalence surveys from the 1960s into 1980 indicated that most of northern Europe was of high frequency, with rates of 30 or more per 100,000 population (figure 3). Southern Europe then appeared distinctly lower, with rates reflecting medium frequency (5 to 29 per 100,000). Similar was the pattern in North America, with high rates in Canada and northern United States, while southern US was then medium. Southeastern Australia too was high and the rest medium. New Zealand was also then in the high range, while Asia was low (prevalence under 5 per 100,000 population).
time permit complete geographic coverage. When such studies are repeated at a later time, we can also see if distributions have changed. The country of Denmark was surveyed twice, the old series for 1921-1933 disability cases, the new for 1949 prevalence. Rates were maximal across the north-central part of the Jutland peninsula on to the island of Funen just to the east. Switzerland also had two national estimates, the old one for 1918-1922, the new for 1956, both showing a strong northwestern geographic concentration. Norway too had two surveys over time, with highest rates in the southeast. When percentages by county of each national mean are compared between the old and the new series in each of these three countries, we see they are each highly correlated, old vs. new, but with the same regression line that shows a clear diffusion over time, with an intercept far off the 0 point on the X-axis (figure 4).
MULTIPLE SCLEROSIS
PREVALENCE RATES PER 100,000 POPULATION EUROPE & MEDITERRANEAN AREA
1980
Figure 3. Prevalence rates per 100,000 population for probable MS in Europe and the Mediterranean area as of 1980, correlated with geographic latitude. From Kurtzke 19805.
Prevalence studies, however, are mostly “spot surveys” of small areas, and may tell little about areas not examined. Nationwide surveys by one team at one
Figure 4. Correlation of the distributions of multiple sclerosis by county between old series and new series of nationwide prevalence studies of three countries, each covering different generations of patients: Denmark (solid circles), Switzerland (Xs), Norway (open squares). Each county rate is expressed as the percentage of its res-pective national (mean) rates. From Kurtzke 19746.
John F. Kurtzke Vol 11, No. 2: 90-99, 2006
medigraphic.com
region of Sweden (figure 5). Spread from this region eastward to Finland, southward to the continent, and westward to Norway and then Denmark would provide the diffusion. Currently under investigation is whether the European spread outside the Baltic region may have had its first dissemination with the movements of the army of King Gustav Adolf of Sweden into Germany from 1630 to 1632 during the Thirty Years War of 1618 to 16487.
earlier. However, by 1994 there were major differences. This figure (figure 6) from Lauer8 shows that the entire
northern Mediterranean basin is now an area of high frequency, and both Portugal and Greece are now also high with prevalence rates in the 40s. Diffusion is a hallmark of this disease.
Figure 5. Distribution of multiple sclerosis in Fennoscandia from nationwide surveys. Areas significantly above their respective national means are in solid black, those high but of dubious statistical significance are cross-hatched, those insignificantly high are diago-nal-lined, and those below the national means are unshaded. Unit boundaries are omitted. Fine horizontal shading represents lakes in Sweden and Finland. From Kurtzke 19746.
The long held view of a north-south gradient for MS may then be little more than a reflection of this spread from Sweden – a different type of big bang theory. Compatible with this view is the finding that the high frequency regions of France are mostly in the northeast, and those of Switzerland in the northwest. But this spread takes years. The prevalence rates of Figure 3 for Europe in 1980 were similar to those seen
Figure 6. Prevalence rates per 100,000 population for MS in Europe and the Mediterranean basin from publications 1980-1994, modified from Lauer 19948, with permission.
And the spread is not limited to Europe. In the US, the World War II series showed a marked excess for residence in the north (figure 7). This was seen for both sexes among whites and for black males, with a north to south difference of almost 3 to 1. The Vietnam and later service veterans still showed a gradient, but it was much less. All southern states were now calculated to lie within the high frequency zone, with prevalence rates estimated at well over 30 per 100,000 population. For all races and sexes, the north to south difference was now only some 2 to 1.
In Asia and Africa earlier assessments provided low prevalence rates, less than 5 per 100,000, except for English-speaking whites of South Africa with medium prevalence. This distribution is now more complex. Rates are still low in the few surveys in Korea, China and southeast Asia, but not in the former USSR or in Japan. For the latter, two recent studies reported rates of 99 and 1010 per 100,000, respectively. Boiko of
medigraphic.com
Russia and other parts of the former Soviet Union11. In
the southern region of the Ukraine, the Volga area, the Caucasus, and into Novosibirsk and Kazakhstan, rates were generally in the medium prevalence range, while more easterly lands were low. In easternmost Russia medium rates reappeared, with high rates in parts of the Amur region near the Pacific Ocean above China.
And it is now the southern littoral of the Mediterranean that is of medium prevalence, and the Canary Islands, Cyprus, Jordan, and Israel are high. In the western hemisphere, all of Canada and the coterminous United States are high, and most of Latin America from Mexico to Patagonia appears to be of medium frequency now, while Venezuela and Colombia may be low. Indeed Cuba may even have high prevalence.
The general worldwide distribution of MS still seems well described by this division into three regions, of high prevalence at 30+ per 100,000 population, medium prevalence of 5-29 per 100,000, and low prevalence, under 5 per 100,000 population (figure 8). With each iteration of this map in the last
quarter century, the areas in white (unstudied) have shrunk appreciably, as expected, but there has also been progressively more of the world marked in black (high).
A
B
Figure 7. Adjusted case control ratios (x100) for white male US veterans service connected for MS by state of residence at entry into service: (figure 7a) World War II and Korean Conflict; (figure 7b) Vietnam era and later service. From Wallin et al 20044.
Figure 8. Worldwide distribution of MS as of 2004 with high (prevalence 30+ per 100,000; solid), medium (prevalence 5-29; dotted), and low (prevalence 0-4; dashed) regions defined. Blank areas are regions without data, or people. Modified from Kurtzke 20037.
The fate of migrants who move into regions of differing risk of MS is critical to our understanding of this disease. If migrants retain the risk of their birthplace, then either the disease in innate, or it is acquired early in life. However, if upon moving they do change their risk, then clearly there is a major environmental cause or precipitant active in their disorder well after birth.
MS-control ratios for birthplace and for pre-illness residence at service entry were compared for the white veterans of World War II or Korean service to assess migration. Ratios where these are the same locations (north-north, middle-middle, south-south tiers of residence) give MS-control ratios for non-migrants, and cells off this diagonal define the ratios for migrants. All ratios decrease as we go from north to south. The non-migrant ratios are 1.48 north, 1.03 middle, and 0.56 south. For the migrants, those born north and entering service from the middle tier have a ratio of 1.27. If they enter from the south their ratio is 0.74, only half that of the non-migrants. Birth in the middle tier is marked by an increase in the MS/C ratio for northern entrants to 1.40, and a decrease to 0.73 for the southern ones. Migration after birth in the south seems to raise the ratios to 0.65 (middle) and 0.70 (north). All these changes save the last are statistically significant. The southern-born migrants were really too few for valid ratios.
John F. Kurtzke Vol 11, No. 2: 90-99, 2006
medigraphic.com
ESTE DOCUMENTO ES ELABORADO POR MEDI-GRAPHIC
age 15, which was the same medium prevalence rate as for the native-born English-speaking white South Africans. But for age groups older at immigration, the prevalence was some 30 to 80 per 100,000, the same as expected from their high-risk homelands. This change was sharp and occurred exactly at age 15 (fi-gure 9). Here each patient is represented by a bar, whose location on the Y axis denotes age at immigration, and whose length on the X axis shows the number of years between immigration and clinical onset. This also indicates that natives of high risk areas are not susceptible to MS acquisition much before age 15, and that there is a long incubation period between acquisition and onset of symptoms.
enter France before onset in the fifth decade of life. In this figure each patient is represented as a solid circle on the line reflecting age at immigration on the Y axis, and whose location on the X axis shows years between immigration and onset of symptoms (figure 10). Note the solitary patient who migrated at 1 year of age and had onset of symptoms at age 9, supporting again the rarity of childhood MS.
Figure 9. Multiple sclerosis in migrants from northern Europe to South Africa by age at immigration (Y axis) and years between immigration and clinical onset (X axis) who were ascertained in 1960 MS prevalence survey of South Africa. Each patient is represented by a bar whose locus on Y axis ± years from immigration on X axis indicates age at clinical onset. Diagonal reflects mean age at onset for this series. Modified from Kurtzke et al 197012.
Inferences as to the opposite migration, low to high, were afforded by the mostly white North African migrants to France. They came from Morocco, Tunisia, and especially Algeria. The migrants with onset more than one year after immigration provided an age-adjusted MS prevalence rate 1.5 times that for all France. If the latter is taken at 50 per 100,000 population, their adjusted rate is 77. The others with presumed acquisition in North Africa gave the same rate of 17 per 100,000 as expected for residents of those lands. For those migrants with acquisition in France, there was at each year of age at migration a mean interval of 13 years between immigration or age 11 and clinical onset, with a minimum of 3 years. The oldest patient at immigration (age 48) was the only one to
Figure 10. Multiple sclerosis in migrants from French North Africa (2/3 from Algeria) by age at immigration (Y axis) and years between immigration and clinical onset of MS (X axis). Each patient is represented by a solid circle whose locus reflects age at onset as the algebraic sum of age at immigration and years from immigration to onset. From Kurtzke et al 199813.
The migrant series provide further support for the theses that multiple sclerosis is primarily an environmental disease acquired after childhood, and that acquisition requires prolonged or repeated exposure, followed by a prolonged latent or incubation period between acquisition and symptom onset.
medigraphic.com
is exposed to a type 1 epidemic, the ages of those affected clinically will define the age range of susceptibility to the infection. Type 2 epidemics will tend to have a young age at onset, as the effective exposure of the patients will be greatest for those then first reaching the age of susceptibility.
We seem to have encountered epidemics of MS in the ethnically similar populations of several groups of islands in the North Atlantic Ocean: Iceland, the Shetland-Orkneys, and the Faroe Islands.
All known MS patients in Iceland with onset 1900-1975 were collected in 1980. Annual incidence rates reveal that there does seem to have been at least one definite Type 2 epidemic of MS in Iceland beginning in 1945. The average annual incidence rate from 1923 to 1944 was 1.6 per 100,000. For 1945-54 it was significantly higher at 3.2, and then it declined significantly to 1.9 for 1955-74. Age at clinical onset in the 1945 to 1949 interval (23 years) was significantly lower than for any other 5-year period from 1935 to 1969.
For each of Shetland and the Orkneys for 1911-1985, average annual incidence rates indicated that the occurrence after 1970 was significantly lower than that for the prior 30 or 35 years. With the small populations of these islands, the incidence rates showed conside-rable fluctuations, and did apparently differ in peaks and valleys between the islands. But the overall impression of at least one epidemic between 1941 and 1970 seems valid, as does the clear decline after 1970. The Faroe Islands are a semi-independent part of the Kingdom of Denmark lying in the North Atlantic at 62 degrees north latitude and 7 degrees west longitude. Population numbered over 44,000 in 1998. They comprise 17 major volcanic islands made of basaltic rock, all with steep hills reaching the shore or the bays and fjords. Almost all the villages are in such inlets. Travel between many islands and even between a few villages on the same island is still by boat.
I have been working with the late Kay Hyllested and Anne Heltberg, both neurologists of Denmark, investigating MS on the Faroes since the early 1970s. Between 1960 and June 1999, at least one of us has examined every person alive on the Faroes in whom MS was suspected between. To find all possible cases from 1900 on, we used every conceivable resource of medical information. Denmark, including the Faroes, has had state-provided health care since the early 1920s, and Danish medical and health records are unsurpassed. All medical records for all suspected ca-ses were obtained and independently reviewed by each of us.
The capital is Tórshavn on the island of Streymoy, with a population of 14,000. This is where the National Hospital is located. There are two other hospitals on the Faroes, one at Klaksvlk on the northern island of Bordoy, the other in Tvøroyri in the southern island of Suduroy.
There is no evidence, despite all our efforts to find any, that MS occurred in this century before 1943 among native-born resident Faroese who had not lived off the islands for 3 or more years before clinical onset. July 1943 is the earliest date when symptom-onset was discovered to have taken place in such residents. There were 21 patients among the 26,000 Faroese who constituted a point source Type 1 epidemic of MS on the Faroes, beginning in 1943.
Inclusion of patients for this epidemic – and later ones - was dependent on two criteria: age 11+ years at “exposure,” and “exposure” for two years. The “exposure” period here was thus 1941-1942 (two years before earliest onset) for 20 patients, and 1943-44 for the last. What the Faroese must have been “exposed” to had to be an exogenous agent brought into the Faroe Islands in 1941-44. We believe this agent is a specific infection we call the primary multiple sclerosis affection (PMSA). Age at first exposure to PMSA exten-ded from age 11 to age 45. Thus susceptibility to PMSA in this populace is limited to Faroese age 11 to 45. Older and younger Faroese were not then suscep-tible. Annual incidence rates show the striking appearance – and disappearance – of this epidemic, which peaked at annual incidence rates of 10 per 100,000 population for 1945 and 1946 (figure 11). Residence at time of exposure indicates the wide scattering of these cases throughout the islands (see below). But where did this disease come from?
The Faroe Islands were occupied by British military forces for five years during World War II, from April 1940 to September 1945. Army troops were the main force, although there were Navy and Air Force units as well. The War Diaries identified the units by type, time, manning, and location. Local sources were used to confirm or deny the recorded British occu-pation sites.
John F. Kurtzke Vol 11, No. 2: 90-99, 2006
medigraphic.com
concluded that the British troops brought MS to the Faroese in the Faroe Islands in 1941-1944.
have to be the result of transmission from F1 A to the next cohort of Faroese. If all the F1 A persons were able to transmit PMSA lifelong, there would have been a steady input for new cases into the 21st century, and
no further epidemics. Now, clinical MS patients do not transmit any disease. This, if this concept is valid, then, if there were later epidemics, transmissibility should have ended by the usual age of clinical onset – which we have taken as age 27. This F1 A+T cohort would therefore decrease each year by the number of Faroese then reaching age 27, and it would disappear by 1958. As seen in figure 14, this cohort would contain some three times as many Faroese in the first seven years (1945-51) as in the next six (1952-57). On the basis that the number of persons available to transmit determines the frequency of acquisition for the newly exposed Faroese (F2 E+S) as they reach age 11 each year in essentially equal numbers, this would then provide three times as many PMSA-affected in the first seven
Figure 11. MS in native resident Faroese. Annual incidence rates per 100,000 population calculated as 3-year centered moving averages for the 21 subjects of epidemic I. From Kurtzke and Heltberg 200114.
The troops therefore brought something to the Faroes which later resulted in an epidemic of clinical MS. This had to be either an infection or a toxin, with either one geographically widespread on the islands from 1941. Now a toxin could not be responsible for later epidemics. Therefore, if there are such (and there are), then there must have been an infection carried by a large proportion of British troops (because of its wide distribution) in an asymptomatic fashion (because they were healthy troops). This must be a persistent infection which takes time (here two years) to be transmitted to a naïve populace, the Faroese. As noted, we call this agent the primary multiple sclerosis affection, which we have defined as a specific, but unknown, widespread, persistent infection that will only rarely lead to clinical neurologic MS years after its acquisition.
This figure provides a model of transmission of PMSA from the British troops to that population cohort of Faroese of all ages which was first geographically exposed to this agent in 1941 (figure 14). This is called the F1 E cohort, i.e. the first cohort of the Faroese population exposed. The age range of the epidemic I MS patients in 1941 (age 11-45) defines the portion of the F1 E cohort that was susceptible to PMSA (F1 E+S), which portion becomes the affected part of this cohort ( F1 A ) after two years of exposure. Proportions of exposed actually affected are unknown, but must be high.
After the British left, any further disease would
medigraphic.com
years as in the next six, and this high-low pattern would repeat itself over time. If, in turn, there is a relatively fixed ratio between PMSA and CNMS, such a model could explain the later occurrence of consecutive type 2 epidemics with peaks at 13-year intervals, as illustrated in the upper part of figure 15.
And, in fact, after epidemic I there have been three later epidemics of clinical disease. Indeed, the occurrence of epidemic IV had been predicted by this transmission model. Membership in the epidemics has been defined by the time of exposure to PMSA for each patient, as seen in the lower part of figure 15. The 10 epidemic II patients were exposed in 1945-57; the 10 of epidemic III in 1958-70. Open boxes indicate first exposure beyond age 11 (because of residence), as found for 4 of the 13 epidemic IV patients whose exposure period was 1971-83. Annual incidence rates per 100,000 population do show four epidemic peaks (figure 16). The top panel provides the rates for the to-tal series, the lower panel the rates for the individual epidemics. Furthermore, the male excess of epidemic
Figure 13. Residence of patients of epidemic I (circles) superimposed on British occupation sites. From Kurtzke and Heltberg 200114.
I has changed to an increasing female preponderance for each later epidemic.
The MS patients of epidemics II-IV lived mostly
Figure 14. Transmission model for the first population cohort of Faroese (F1) exposed to PMSA. Rectangle at lower left represents British occupation 1941-1944 when at least 1,500 troops were stationed on the Faroes. Long vertical bar represents the entire 1941 Faroese population, all ages, geographically at risk of PMSA: the F1 E (exposed) cohort. Only those age 11-45 in 1941 were susceptible to PMSA (F1 E+S) based upon ages of the epidemic I MS patients (shaded part of bar). After two years the F1 E+S cohort became the F1 A (affected) cohort. Were the entire F1 A cohort able to transmit PMSA, transmissibility would have persisted from 1945 into the 21st century
(«number surviving» curve). If transmissibility ceases by age 27, then only that part of the F1 A cohort age 13 to 26 would comprise the F1 A+T cohort (affected and transmissible), which would decline to 0 in 1958 as its members attain age 27. From Kurtzke et al 199515.
Figure 15. Summation of PMSA transmission with actual population numbers for British, and for Faroese geographically at risk, F1 through F4 cohorts, with time of exposure of patients of epidemics II-IV (lower portion); each rectangle there represents one patient at age 11 (dotted) or at older age of first exposure (open), by calendar time. From Kurtzke and Heltberg 200114.
John F. Kurtzke Vol 11, No. 2: 90-99, 2006
medigraphic.com
• A small proportion of persons with PMSA will years later develop clinical neurologic multiple sclerosis.
• Prolonged exposure is needed to acquire PMSA. Acquisition follows first adequate exposure. • Susceptibility to PMSA is limited to about age
11 to 45 at start of exposure. • CNMS is not transmissible.
• Therefore PMSA transmissibility is limited to a period under usual age of CNMS onset. On the Faroes this period is about age 13 to 26. • At present the existence of PMSA can only be
inferred from presence of CNMS.
REFERENCES
1. Kurtzke JF. Epidemiology of multiple sclerosis. Does this really point toward an etiology? Lectio Doctoralis. Neurol Sci 2000; 21: 383-403.
2. Kurland LT, Kurtzke JF, Goldberg ID. Epidemiology of
Neurologic and Sense Organ Disorders. Harvard University Press, Cambridge MA, 1973: 64-107.
3. Landtblom A-M, Riise T, Boiko A, Söderfeldt B. Distribution of multiple sclerosis in Sweden based on mortality and disability compensation statistics. Neuroepidemiology 2002; 21: 167-79. 4. Wallin MT, Page WF, Kurtzke JF. Multiple sclerosis in United States veterans of Vietnam era and later military service. 1. race, sex and geography. Ann Neurol 2004; 55: 65-71. 5. Kurtzke JF. Geographic distribution of multiple sclerosis: an
update with special reference to Europe and the Mediterranean region. Acta Neurol Scand 1980; 62: 65-80.
6. Kurtzke JF. Further features of the Fennoscandian focus of multiple sclerosis. Acta Neurol Scand 1974; 50: 478-502. 7. Kurtzke JF. Epidemiology and multiple sclerosis: a personal
review. Notebooks on Multiple Sclerosis. 2003;16:6-31.
(Spanish).
8. Lauer K. Multiple sclerosis in the old world: the new old map. In: Firnhaber W, Lauer K (eds): Multiple Sclerosis in Europe. An Epidemiological Update. LTV Press, Darmstadt, 1994: 14-27. 9. Houzen H, Niino M, Kikuchi S, Fukazawa T, Nogoshi S,
Matsumoto H, et al. The prevalence and clinical characteristics of MS in northern Japan. J Neurol Sci 2003; 211: 49-53. 10. Itoh T, Aizawa H, Hashimoto K, Kimura T, Katayama T, Koyama
S, et al. Prevalence of multiple sclerosis in Asahikawa, a city in northern Japan. J Neurol Sci 2003; 214: 7-9.
11. Boiko AN. Multiple sclerosis prevalence in Russsia and other countries of the former USSR. In: Firnhaber W, Lauer K (eds):
Multiple Sclerosis in Europe. An Epidemiological Update. LTV Press, Darmstadt, 1994.
12. Kurtzke JF, Dean G, Botha DPJ. A method of estimating the age at immigration of White immigrants to South Africa, with an example of its importance. S Afr Med J 1970; 44: 663-9. 13. Kurtzke JF, Delasnerie-Lauprêtre N, Wallin MT. Multiple sclerosis
in North African migrants to France. Acta Neurol Scand 1998; 98: 302-9.
14. Kurtzke JF, Heltberg A. Multiple sclerosis in the Faroe Islands: an epitome. J Clin Epidemiol 2001; 54: 1-22.
15. Kurtzke JF, Hyllested K, Heltberg A. Multiple sclerosis in the Faroes: transmission across four epidemics. Acta Neurol Scand
1995; 91: 321-5.
Figure 16. Annual incidence rates per 100,000 population for clinical MS in native resident Faroese, calculated as 3-year centered moving averages, 1998. Upper panel: total series, lower panel: rates for each of the four epidemics. From Kurtzke and Heltberg 200114.
lived at time of PMSA exposure in any location where there had not lived epidemic I patients or occupying troops. The disease has remained geographically stable for over half a century on the Faroes, the ideal location then to search for this agent, a task we must leave for others. Since we could not receive permission from the Faroese authorities to draw the necessary samples, our own work on the Faroes, unfortunately, has had to come to an end.
In summation, I believe the Faroese Saga provides major insight into what seems to me be the essential nature of MS:
• There is a specific, widespread but unidentified infection we call the primary multiple sclerosis affection.