Diagnostic value of fibronectin discriminant score for predicting
liver fibrosis stages in chronic hepatitis C virus patients
Abdelfattah M. Attallah,* Sanaa O. Abdallah,† Ahmed A. Attallah,* Mohamed M. Omran,* Khaled Farid,§ Wesam A. Nasif,¶ Gamal E. Shiha,‡ Abdel-Aziz F. Abdel-Aziz,|| Nancy Rasafy,* Yehia M. Shaker**
*Research Department, Biotechnology Research Center, New Damietta City, Egypt. † Faculty of Science, Cairo University, Giza, Egypt. ‡Internal Medicine Department, Faculty of Medicine, Mansoura University, Mansoura, Egypt.
§ Faculty of Science, Helwan University, Helwan, Egypt. Tropical Medicine Unit, Faculty of Medicine, Mansoura University, Mansoura, Egypt. ¶Genetic Engineering and Biotechnology Research Institute, Minufiya University, Minufiya, Egypt. ||Faculty of Science, Mansoura University, Egypt.
** National Research Center, Cairo, Egypt.
ABSTRACT
Background. Several noninvasive predictive models were developed to substitute liver biopsy for fibrosis as-sessment. Aim. To evaluate the diagnostic value of fibronectin which reflect extracellular matrix metabo-lism and standard liver functions tests which reflect alterations in hepatic functions. Material and methods. Chronic hepatitis C (CHC) patients (n = 145) were evaluated using ROC curves and stepwise multi-variate discriminant analysis (MDA) and was validated in 180 additional patients. Liver biochemical profile in-cluding transaminases, bilirubin, alkaline phosphatase, albumin, complete blood count were estimated. Fibronectin concentration was determined using monoclonal antibody and ELISA. Results. A novel index named fibronectin discriminant score (FDS) based on fibronectin, APRI and albumin was developed. FDS produced areas under ROC curves (AUC) of 0.91 for significant fibrosis and 0.81 for advanced fibrosis. The FDS correctly classified 79% of the significant liver fibrosis patients (F2-F4) with 87% sensitivity and 75% spe-cificity. The relative risk [odds ratio (OR)] of having significant liver fibrosis using the cut-off values deter-mined by ROC curve analyses were 6.1 for fibronectin, 4.9 for APRI, and 4.2 for albumin. FDS predicted liver fibrosis with an OR of 16.8 for significant fibrosis and 8.6 for advanced fibrosis. The FDS had similar AUC and OR in the validation group to the estimation group without statistically significant difference. Conclusion. FDS predicted liver fibrosis with high degree of accuracy, potentially decreasing the number of liver biopsy required.
Key words. Noninvasive. Blood markers. Discriminant analysis. Significant liver fibrosis. Advanced liver fibrosis.
Correspondence and reprint request: Abdelfattah M. Attallah, Ph.D. Biotechnology Research Center
P.O. Box (14), 23 July St., Industrial Zone, New Damietta 34517, Egypt. Tel: 02/057/2402889–2403889–2404889. Fax: 02/057/2401889 E-mail: [email protected]
Manuscript received: June 31, 2012. Manuscript accepted: July 25, 2012. INTRODUCTION
In the last decade, clinical investigators have been searching for non-invasive methods for accura-te information about liver fibrogenesis activity and fibrosis stages in patients with hepatitis virus C (HCV).1 Guidelines and recommendations indicate that staging of liver fibrosis is the most important parameter for the definition of prognosis and for the subsequent management of the patient with CHC.2 Currently, the standard procedure for evaluating
(AST)/alanine aminotransferase (ALT) AST/ALT ra-tio, albumin, prothrombin time, platelet count and APRI. These markers usually used in combination, have been evaluated.8-13 Fibronectin is a glycopro-tein, the major sources of which are hepatocytes, Kupffer cells and endothelial cells.14 Circulating fibronectin represents a viable marker for the presence of significant fibrosis or a lack thereof.15 Recently, fibronectin was identified at 90 kDa and quantified in sera of individuals with CHC using ELISA.16 Here, we have created a predictive model for discriminating patients with significant and advanced liver fibrosis in CHC patients.
MATERIAL AND METHODS
Patients
We have found 325 patients with chronic viral he-patitis who fulfilled our criteria. Patients used in the estimation group (n = 145) and patients used in validation group (n = 180) were prospectively recruited from the Tropical Medicine Unit, Mansoura University hospitals, Mansoura, Egypt during the period from October 2008 to April 2012. An infor-med consent was obtained from each individual par-ticipated in the present study and all were fully informed concerning the nature of the disease and the diagnostic procedures involved. In the estimation group, blood samples and liver biopsies were taken from untreated consecutive Egyptian indivi-duals (90 males and 55 females aged 42.2 ± 10.3 years). Patients were retrospectively evaluated and assessed with complete laboratory tests needed to decide eligibility for antiviral therapy. Detailed his-tory taking and clinical examination were performed for every patient. Ultrasonographic examination of the liver, spleen and portal vein was done for all pa-tients. Blood tests included liver function tests, kidney function tests, complete blood count, prothrombin time and INR, α fetoprotein, blood glucose, anti-schistosomal antibody, hepatitis B surface antigen, antinuclear antibody, thyroid stimulating hormo-ne and pregnancy test for females. In addition, elec-trocardiography was conducted for men older than 40 years and for females older than 50 years. Patients with the following conditions were exclu-ded from the study: patients with other causes of chronic liver injury or hepatocellular carcinoma, co-infection with hepatitis A, B viruses and human immunodeficiency virus, hepatocellular carcinoma, prior antiviral or immunosuppressive therapy, metabolic liver disease, insufficient liver tissue for
staging of fibrosis, and incomplete data on liver function tests or platelet count within 1 month from the date of biopsy. The clinical and pathological in-vestigation, as well as inclusion and exclusion crite-ria for the study, and classification adopted in the validation group of patients (124 males, 56 females; aged 40.1 ± 10.5) were the same as those used in pa-tients in the estimation study. The HCV infection was diagnosed based on biochemical, serological and histological criteria. Moreover, all individuals were diagnosed based on a positive test for HCV anti-body (ETI-AB-HCVK-3 kit, Sorine Biomedica, Sulu-ggia, Italy). All patients had detectable HCV-NS4 antigen according to Attallah, et al.17 and HCV-RNA (COBAS Ampliprep/COBAS TaqMan, Roche Diag-nostics, Pleasanton, USA). The study protocol con-forms to the ethical guideline of the 1975 Declaration of the Helsinki.
Liver biopsy and blood collection
Hyogo, Japan). APRI test refers to the AST to plate-let ratio index reported by Wai, et al.,19 and was cal-culated as shown figure 1.
Quantitation of fibronectin using ELISA
Quantitation of fibronectin was determined as previously described by Attallah, et al.16 In brief (50 µL/well) diluted serum samp1es (1: 10) in coating buffer (50 mM Carbonate/Bicarbonate buffer, pH 9.6) were coated ELISA plate. The ELISA plate sea-led with an acetate plate sealer and incubated over-night at 2-8 oC. After five washes with phosphate buffered saline-Tween 20 (PBS-T20), the wells free binding sites were blocked with 0.2 % (w/v) BSA in coating buffer (200 µL/well). Fibronectin monoclonal antibody (ABC Diagnostics, New Damietta, Egypt) at dilution 1:100 in PBS was added separately (50 µL/well) and incubated at 37 oC for 2 h. Diluted alkaline phosphatase-conjugated goat anti-mouse lgG (Sigma), 1:500 in 0.2% (w/v) BSA in PBST20, were incubated (50 µL/well) at 37 oC for 1 h. After washing the plates; the amount of coupled conjuga-te was deconjuga-termined by incubation with 1 mg/mL p-nitro-phenyl phosphate in substrate buffer for 30 min at 37 oC. The absorbances were read at 405 nm using a microtiter plate reader (∑960, Metertech, Inc., Taipei, Taiwan).
Statistical analyses
All statistical analyses were done by a Statistical Package for the Social Sciences (SPSS); version 15.0 on Microsoft Windows XP (SPSS Inc., Chicago, IL, USA). Continuous variables were expressed as mean ± SD, whereas categorical variables were expressed as numbers (percentages). A value of p < 0.05 was considered statistically significant. The correlation was evaluated by Pearson correlation coefficient. Pa-tients were divided by time of assessment into two groups: approximately 44.6% of all cases in estima-tion group (n = 145) and 55.4% in validaestima-tion group (n = 180). In accordance with the METAVIR scoring system, patients were divided into several groups. The main endpoint was the identification of patients with significant liver fibrosis (F2-F4) versus those without (F0-F1). F2, F3, and F4 categories were
grouped together because F2 is generally chosen as a threshold for treatment of chronic HCV infection.5 In secondary analyses, patients were also classified into advanced liver fibrosis (F3-F4). First, factors that differed significantly between these groups were identified by univariate analyses: χ2, student t test, and ANOVA. The independent discriminative value of blood markers for the diagnosis of significant li-ver fibrosis was then assessed by ROC curves and stepwise multivariate discriminant analysis. The third step was to construct a score that combined the independent factors. The best score for discrimi-nation was the logistic regression function that combined the most discriminatory independent fac-tors. The best cut-off values for optimal prediction of significant liver fibrosis (F2-F4) were determined from the ROC curves. Common indicators of the candidate blood markers and the model performance (sensitivity, specificity, efficiency, positive and nega-tive predicnega-tive values and odds ratio) derived from such a 2 x 2 contingency table. Odds ratios (with 95% confidence intervals) were calculated to estima-te the risk of a target disorder from subjects without it.
RESULTS
Clinical
characteristics of patients
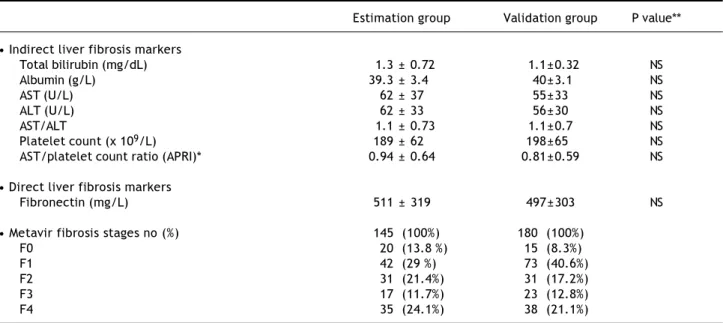
The blood liver fibrosis markers (direct and indi-rect) and Metavir fibrosis stages of the estimation (n = 145) and validation groups (n = 180) are pre-sented in table 1. There is no significant difference (p > 0.05) between the estimation and the valida-tion groups in the blood liver fibrosis markers and Metavir scoring system.
Markers associated with significant fibrosis
The distribution of albumin, AST, AST/ALT, pla-telet count and APRI differed significantly (P < 0.05-P < 0.0001) between patients with minimal li-ver fibrosis and patients with significant lili-ver fibro-sis. ALT and total bilirubin didn’t differ significantly which were excluded from subsequent analyses. The level of fibronectin was increased
sig-Figure 1.
nificantly with the progression of fibrosis stages but decreased in cirrhosis. Areas under ROC curves were used for evaluating the overall diagnostic per-formance of direct and indirect liver fibrosis mar-kers for discriminating patients with minimal liver fibrosis (F0-F1) from patients with significant liver fibrosis (F2-F4). Areas under ROC curves ran-ged from 0.83 for fibronectin to 0.59 for AST/ALT ratio (data not shown). Based on the areas under
Table 1. Comparison between laboratory blood tests and Metavir fibrosis stages in estimation and validation groups.
Estimation group Validation group P value**
• Indirect liver fibrosis markers
Total bilirubin (mg/dL) 1.3 ± 0.72 1.1±0.32 NS
Albumin (g/L) 39.3 ± 3.4 40±3.1 NS
AST (U/L) 62 ± 37 55±33 NS
ALT (U/L) 62 ± 33 56±30 NS
AST/ALT 1.1 ± 0.73 1.1±0.7 NS
Platelet count (x 109/L) 189 ± 62 198±65 NS
AST/platelet count ratio (APRI)* 0.94 ± 0.64 0.81±0.59 NS
• Direct liver fibrosis markers
Fibronectin (mg/L) 511 ± 319 497±303 NS
• Metavir fibrosis stages no (%) 145 (100%) 180 (100%)
F0 20 (13.8 %) 15 (8.3%)
F1 42 (29 %) 73 (40.6%)
F2 31 (21.4%) 31 (17.2%)
F3 17 (11.7%) 23 (12.8%)
F4 35 (24.1%) 38 (21.1%)
References values: Aspartate aminotransferase (AST) up to 40 U/L; alanine aminotransferase (ALT) up to 45 U/L; albumin 38-54 g/L; platelet count 150-400 (x 109/L); fibronectin 250-400 mg/L according to Fortunato, et al.32. *APRI = [AST (U/L)/(40)]/[Platelet count 109/L] x 100. **P > 0.05 is considered not
signi-ficant (NS), p < 0.05 is considered signisigni-ficant.
Table 2. Levels of candidate markers and fibronectin discriminant score (FDS) to differentiate patients with different liver fibro-sis stages in the estimation and validation groups.
Analyte* Estimation study (n = 145) Validation study (n = 180)
Metavir scoring system P value** Metavir scoring system P value**
F0-F1 (n = 62) F2-F4 (n = 83) F0-F1 (n = 88) F2-F4 (n = 92)
Albumin (g/L) 40.7 ±1.87 38.4 ± 3.9 < 0.0001 40.8 ±1.8 38.4 ±2.9 < 0.0001
APRI* 0.59 ±0.39 1.2 ± 0.67 < 0.0001 0.52 ±0.36 1.1 ±0.62 < 0.0001
Fibronectin (mg/L)* 317 ±184 656 ± 323 < 0.0001 301 ±173 583 ±321 < 0.0001
FDS 0.29 ±0.19 0.74 ± 0.34 < 0.0001 0.26 ±0.18 0.67 ±0.29 < 0.0001
F0-F2 (n = 93) F3-F4 (n = 52) F0-F2 (n = 119) F3-F4 (n = 61)
Albumin (g/L) 40.3 ±2.5 37.8 ± 4.3 < 0.0001 40.6 ±1.8 38.2 ±3.1 < 0.0001
APRI* 0.78 ±0.58 1.2 ± 0.68 < 0.0001 0.58 ±0.42 1.1 ±0.64 < 0.0001
Fibronectin (mg/L) 401 ±240 707 ± 351 < 0.0001 324 ±200 597 ±327 < 0.0001
FDS 0.41 ±0.28 0.79 ± 0.36 < 0.0001 0.29 ±0.21 0.68 ±0.32 < 0.0001
References values: *albumin 38-54 g/L; APRI = [AST (U/L)/(40)]/[Platelet count x 109/L] x 100. Fibronectin 250-400 mg/L according to Fortunato,
et al.32 **p > 0.05 is considered not significant, p < 0.05 is considered significant; p < 0.001 is considered very significant, p < 0.0001 is considered extremely
signifi-cant.
fibronectin was chosen as the basic marker to com-bine with other indices to discriminate patients with significant liver fibrosis (F2-F4) from minimal liver fibrosis (F0-F1).
Predictive model
Table 3 presents the diagnostic performances of the investigated markers and combined markers at the optimal cutoff. The values were based on
the differentiation between minimal liver fibrosis and significant liver fibrosis. The best combina-tion of blood markers was selected by stepwise MDA using the minimum Wilk’s lambada test. A function was selected based on absolute values of two routine laboratory tests (APRI and albumin) which reflect alterations in hepatic functions and one direct liver fibrosis marker (fibronectin) which reflects fibrogenesis. We developed a novel nonin-vasive index for predicting liver fibrosis groups,
Figure 2.
FDS = [1.812 (numeric constant) + fibronectin (mg/L) x 0.00052 + APRI x 0.276 - albumin (g/L) x 0.046]
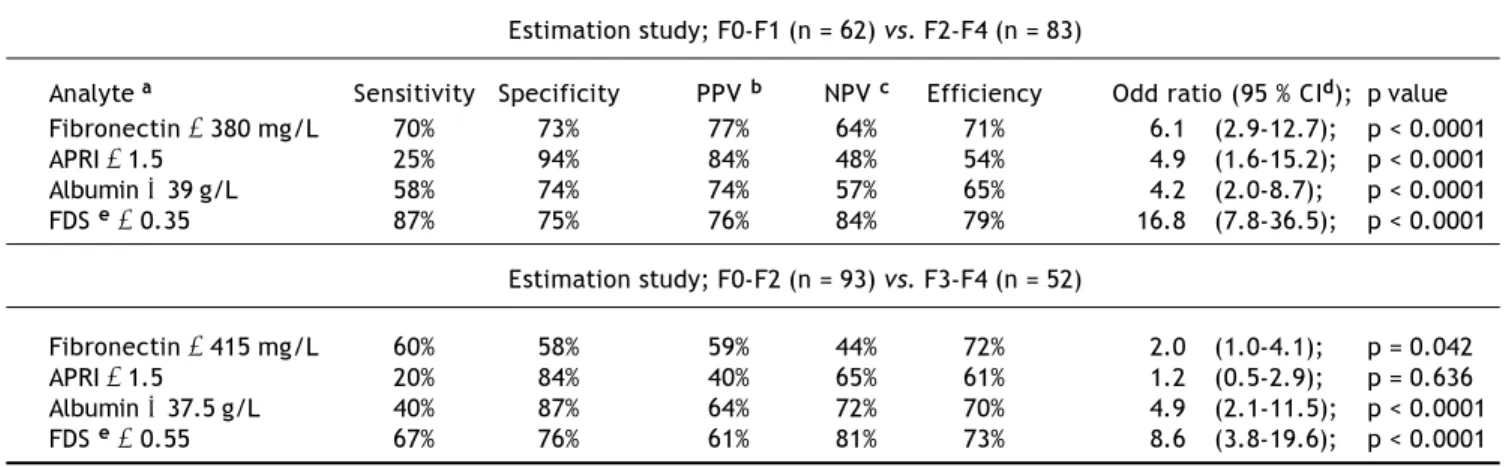
Table 3. The diagnostic performances of single marker and combined markers (FDS) to differentiate patients with significant liver fibrosis (F2-F4) and advanced liver fibrosis (F3-F4) in the estimation groups.
Estimation study; F0-F1 (n = 62) vs. F2-F4 (n = 83)
Analyte a Sensitivity Specificity PPV b NPV c Efficiency Odd ratio (95 % CId); p value
Fibronectin ≥ 380 mg/L 70% 73% 77% 64% 71% 6.1 (2.9-12.7); p < 0.0001
APRI ≥ 1.5 25% 94% 84% 48% 54% 4.9 (1.6-15.2); p < 0.0001
Albumin ≤ 39 g/L 58% 74% 74% 57% 65% 4.2 (2.0-8.7); p < 0.0001
FDS e≥ 0.35 87% 75% 76% 84% 79% 16.8 (7.8-36.5); p < 0.0001
Estimation study; F0-F2 (n = 93) vs. F3-F4 (n = 52)
Fibronectin ≥ 415 mg/L 60% 58% 59% 44% 72% 2.0 (1.0-4.1); p = 0.042
APRI ≥ 1.5 20% 84% 40% 65% 61% 1.2 (0.5-2.9); p = 0.636
Albumin ≤ 37.5 g/L 40% 87% 64% 72% 70% 4.9 (2.1-11.5); p < 0.0001
FDS e≥ 0.55 67% 76% 61% 81% 73% 8.6 (3.8-19.6); p < 0.0001
a a a a
a The best cut-off values were determined from the ROC curves. b b b b b PPV: positive predictive value. c c c c c NPV: negative predictive value. d d d d d CI: confidence interval. e
e e e
e FDS: fibronectin discriminant score based on fibronectin, APRI and albumin.
Figure 3. Box plots for fibronectin discriminant score (FDS) based on fibronectin, APRI and albumin in significant liver fibrosis
(F2-F4) and advanced liver fibrosis (F3-F4). A. Box plots for patients with significant liver fibrosis (F2-F4). B. Box plots for
pa-tients with advanced liver fibrosis (F3-F4). The box represents the interquartile range. The whiskers indicate the highest and lo-west values, and the line across the box indicates the median value. Overall significance of differences between the liver fibrosis groups was determined by t-test.
Fibronectin discriminant score
1.40 1.20 1.00 0.80 0.60 0.40 0.20 0.00
F0-F1 F2-F4
P < 0.0001
A B
Fibronectin discriminant score
1.40 1.20 1.00 0.80 0.60 0.40 0.20 0.00
F0-F2 F3-F4
named fibronectin discriminant score (FDS) (Fi-gure 2).
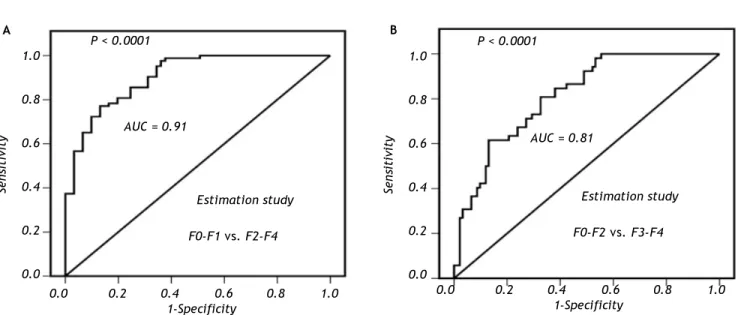
There was significant correlation between liver fibrosis stages and FDS (r = 0.571; P < 0.0001). FDS shows a highly significant difference (P < 0.0001) between liver fibrosis stages in significant and advanced liver fibrosis (Figure 3). The AUCs of FDS for prediction of significant liver fibrosis and advanced liver fibrosis were 0.91 and 0.81 respecti-vely, with highly significant difference (P < 0.0001)
(Figure 4). The AUC was 0.91 (p < 0.0001) for dis-criminating patients with minimal liver fibrosis (F0-F1) from significant liver fibrosis (F2-F4) and the best cutoff value was 0.35. The FDS correctly classi-fied 79% of the significant liver fibrosis patients (F2-F4) (i.e. less than 0.35 indicated minimal liver fibrosis and greater than 0.35 indicated significant liver fibrosis) with 87% sensitivity and 75% specifi-city; respectively. The relative risk [odds ratio, (OR)] of having significant liver fibrosis using the
Figure 4. ROC curves for fibronectin discriminant score (FDS) based on fibronectin, APRI and albumin in the estimation group.
A. For discriminating patients with significant liver fibrosis (F2-F4) with AUC = 0.91 (p < 0.0001) and best cutoff value at ≥ 0.35.
B. For discriminating patients with advanced liver fibrosis (F3-F4) with AUC = 0.81 (p < 0.0001) and best cutoff value at ≥ 0.55.
1.0
0.8
0.6
0.4
0.2
0.0
Sensitivity
P < 0.0001
AUC = 0.91
0.0 0.2 0.4 0.6 0.8 1.0
1-Specificity
Estimation study
F0-F1 vs. F2-F4
1.0
0.8
0.6
0.4
0.2
0.0
Sensitivity
P < 0.0001
AUC = 0.81
0.0 0.2 0.4 0.6 0.8 1.0
1-Specificity
Estimation study
F0-F2 vs. F3-F4
Figure 5. ROC curves for fibronectin discriminant score (FDS) based on fibronectin, APRI and albumin in the validation group.
A. For discriminating patients with significant liver fibrosis (F2-F4) with AUC = 0.90 (p < 0.0001) and best cutoff value at ≥ 0.35.
B. For discriminating patients with advanced liver fibrosis (F3-F4) with AUC = 0.86 (p < 0.0001) and best cutoff value at ≥ 0.55.
A B
1.0
0.8
0.6
0.4
0.2
0.0
Sensitivity
P < 0.0001
AUC = 0.90
0.0 0.2 0.4 0.6 0.8 1.0
1-Specificity Validation study
F0-F1 vs. F2-F4
1.0
0.8
0.6
0.4
0.2
0.0
Sensitivity
P < 0.0001
AUC = 0.86
0.0 0.2 0.4 0.6 0.8 1.0
1-Specificity Validation study
F0-F2 vs. F3-F4
cut-off values determined by ROC curve analyses were 6.1 for fibronectin, 4.9 for APRI, and 4.2 for al-bumin. FDS predicted liver fibrosis with an OR of 16.8 for significant fibrosis and 8.6 for advanced fi-brosis. The diagnostic values of FDS in significant liver fibrosis and advanced liver fibrosis are listed in table 3.
Validation study
The validation group included 180 CHC patients (124 males, 56 females; aged 40.1 ± 10.5). The clini-cal and pathologiclini-cal investigations, as well as the inclusion and exclusion criteria for the estimation study were the same. Classifications adopted in this second group of patients were the same as those used in patients in the estimation study. There is no significant difference between the laboratory blood tests in the estimation and the validation studies, table 1. The FDS score was evaluated for discrimi-nating patients with significant liver fibrosis (F2-F4) from minimal liver fibrosis (F0-F1) at cutoff 0.35 in the validation group. The AUCs of FDS for prediction of significant liver fibrosis and advanced liver fibrosis were, 0.90 and 0.86; respectively with highly significant difference (P < 0.0001) (Figure 5). The FDS correctly classified 79% of the significant liver fibrosis patients (F2-F4) (i.e. less than 0.35 indicated minimal liver fibrosis and greater than 0.35 indicated significant liver fibrosis) with 77% sensitivity and 82% specificity; respectively. The FDS correctly classified 73% of the advanced liver fi-brosis patients (F3-F4) (i.e. greater than 0.55 indi-cated advanced liver fibrosis) with 74% sensitivity
and 73% specificity; respectively. FDS predicted liver fibrosis with an OR of 15.6 for significant fibrosis and 8.9 for advanced fibrosis (Table 4). There is no significant difference between the diagnostic perfor-mances of FDS in the estimation and the validation studies.
DISCUSSION
Fibrosis prediction is an essential part of the as-sessment and management of patients with chronic liver disease. Blood-based biomarkers offer a num-ber of advantages over the traditional standard of fibrosis assessment of liver biopsy, including safe-ty, cost-savings and wide spread accessibility.20 In the present study, the most informative blood mar-kers were, in decreasing rank: fibronectin, APRI and albumin. Fibronectin is multifunctional extra-cellular matrix glycoprotein that is important com-ponent of the extracellular matrix in normal and fibrotic liver and seems to play a pacemaker role in liver fibrogenesis.21 The excessive synthesis of fibronectin and other extracellular matrix proteins deteriorates hepatic architecture and results in liver fibrosis.22 The level of fibronectin was increased significantly with the progression of fibrosis staging but decreased in cirrhosis. This could be explained by the fibronectin level is increased in the development of early liver fibrosis and fibronec-tin may act as a chemotactic factor for collagen producing cells and as a skeleton for the new colla-gen formation.23 The decreased levels of fibronectin in patients with liver cirrhosis are related to hepa-tic dysfunction.24-25 The finding of decreased platelet
Table 4. The diagnostic performances of single marker and combined markers (FDS) to differentiate patients with significant liver fibrosis (F2-F4) and advanced liver fibrosis (F3-F4) in the validation groups.
Validation study; F0-F1 (n = 88) vs. F2-F4 (n = 92)
Analytea Sensitivity Specificity PPV b NPV c Efficiency Odd ratio (95 % CI d); p value
Fibronectin ≥ 380 mg/L 72% 81% 79% 75% 77% 11.1 (5.5-22.5); p < 0.0001
APRI ≥ 1.5 20% 94% 78% 54% 57% 4.1 (1.4 -11.7); p < 0.0001
Albumin ≤ 39 g/L 36% 91% 81% 58% 63% 5.7 (2.5-13.4); p < 0.0001
FDS e≥ 0.35 77% 82% 85% 73% 79% 15.6 (6.8-35.8); p < 0.0001
Validation study; F0-F2 (n = 119) vs. F3-F4 (n = 61)
Fibronectin ≥ 415 mg/L 72% 68% 52% 84% 69% 5.4 (2.5-11.7); p < 0.0001
APRI ≥ 1.5 15% 92% 47% 70% 67% 1.9 (0.7-5.9); p < 0.0001
Albumin ≤ 37.5 g/L 37% 94% 74% 76% 70% 7.7 (3.5-17.2); p < 0.0001
FDS e≥ 0.55 74% 73% 57% 86% 73% 8.9 (3.2-27.7); p < 0.0001
a a a a
a The best cut-off values were determined from the ROC curves. b b b b b PPV: positive predictive value. c c c c c NPV: negative predictive value. d d d d d CI: confidence interval. e
e e e
count and increased AST level with progression of liver fibrosis has been reported in many studies.26-28 The liver has large reserves of albumin synthetic capacity, and thus decreased serum albumin from liver impairment is highly important and was al-ready used to assess liver fibrogenesis.29-30 Several previous studies described the use of blood markers to assess stages of liver fibrosis.31-32 The FDS had sensitivity 87%, and accuracy 79%, which was higher than APRI sensitivity (25%) and accuracy (54%) when using APRI alone. FDS is much simpler and practical score than other scores such as Fibrotest including (total bilirubin, γ -glutamyl-transpep-tidase, 2-macroglobulin, apolipoprotein A1 and haptoglobin, corrected for age and gender).33 In a large study (n = 1,307), Degos, et al.34 comparing prospectively several scores (FibroTest, Fibrometre, Hepacore and APRI), the AUCs ranged from 0.72 to 0.78 for significant fibrosis and from 0.77 to 0.86 for cirrhosis. In the present study, FDS produced higher areas under ROC curves (AUC) of 0.91 for significant fibrosis. The sensitivity, specificity and efficiency of FDS to differentiate significant liver fi-brosis from minimal liver fifi-brosis were 87%, 75% and 79%, respectively. The sensitivity, specificity, positive predictive value and negative predictive va-lue of the Fibrotest to differentiate significant liver fibrosis from minimal liver fibrosis were 80%, 63%, 79% and 66%, respectively.35 The FDS showed a diagnostic sensitivity for significant liver fibrosis higher than FIBROSpect (72%).36 Fibroscan is a noninvasive method that evaluates liver stiffness. The development of fibroscan provides clinicians with a non-invasive, accurate, and reproducible tool to estimate liver fibrosis.37 The fibroscan mig-ht be convenient in clinical practice but the device for fibroscan is costly; and required higher expe-rience operator.38 Obesity, and general features of the metabolic syndrome were the main obstacle for fibroscan and elastography failure or unreliable re-sults39 Fibroscan produced AUC of 0.79 for signifi-cant fibrosis and 0.91 for liver cirrhosis in 935 patients with CHC40 Takemoto, et al.41 reported higher diagnostic value of FibroScan for predicting advanced liver fibrosis, in 44 patients with CHC (sensitivity, specificity, positive predictive value, negative predictive value and accuracy were 100%, 74%, 78%, 100% and 86%, respectively). The esti-mated OR was 16.8 for the FDS, which was better than the individual markers alone (6.1, 4.9 and 4.2). Once FDS was above the cut-off value (0.35) in a given patient, this patient was 16.8 times more likely to have significant liver fibrosis. OR of
signi-ficant liver fibrosis in the FDS was higher than OR of Forns’ score (6.3); OR of Fibrotest (15.7) and lo-wer than OR of SHASTA (19.1).42 We applied the MDA function of the score to the validation groups of CHC patients. The accuracy of FDS tends to de-crease slightly when applied to the validation study and it was found that no significant difference from the results of the estimation groups of patients. The ability of Hepascore to predict significant fi-brosis (F2-F4) as determined by AUC was lower than our work in the estimation (0.83) and the va-lidation study (0.81) and was comparable to the re-sults that had been seen in previous studies.31 Because treatment is generally recommended when significant liver fibrosis is present, patients with FDS at cutoff 0.35 may be considered for antiviral therapy without the requirement for liver biopsy.5 In addition, the exclusion of patients with advan-ced fibrosis, FDS cutoff at 0.55 may be particularly useful in providing prognostic information for patients who are reluctant to undergo biopsy. Also FDS may be useful for elderly patients who are un-likely to develop liver related morbidity or mortali-ty in the absence of advanced fibrosis.43 The FDS in our study has several unique features. FDS is based on a simple and easy to perform tests (albu-min and APRI) reflect alterations in hepatic func-tions and fibronectin reflect the process of fibrogenesis. Fibronectin is available to most labo-ratories and requires only a microplate colorime-tric reader. It is therefore less costly and more convenient to perform. An obvious advantage of the FDS is that it is published and freely availa-ble. In conclusion, FDS has good correlation with the progression of the hepatic fibrosis stages. Our score could be used as blood tests for the non-in-vasive diagnosis of liver fibrosis and to reduce the need for liver biopsy that cannot be completely avoided.
ABBREVIATIONS
• ALT: alanine aminotransferase. • AST: aspartate aminotransferase. • CHC: chronic hepatitis C.
• FDS: fibronectin discriminant score. • HCV: hepatitis virus C.
• MDA: multivariate discriminant analysis.
CONFLICT OF INTEREST
REFERENCES
1. Poynard T, Lebray P, Ingiliz P, Varaut A, Varsat B, Ngo Y, Norha P, et al. Prevalence of liver fibrosis and risk factors in a general population using non-invasive biomarkers
(Fi-broTest). BMC Gastroenterol 2010; 10: 40.
2 . Recommendations from the National Institutes of Health consensus development conference statement:
management of hepatitis C: 2002. Hepatol 2002;
36:1039.
3. Fierbinteanu-Braticevici C, Dina I, Petrisor A, Tribus L, Negreanu L, Carstoiu C. Noninvasive investigations for
non alcoholic fatty liver disease and liver fibrosis. WJ
Gas-troenterol 2010; 16: 4784-91.
4. Straub BK, Schirmacher P. Pathology and biopsy
assess-ment of non-alcoholic fatty liver disease. Dig Dis 2010; 28:
l97-202.
5. Chang DY, Shin EC. Immune-based therapy for chronic
he-patitis C. J Leukoc Biol 2009; 86: 33-9.
6. de Bruijne J, Weegink CJ, Jansen PL, Reesink HW. New
de-velopments in the antiviral treatment of hepatitis C. Vox
Sang 2009; 97: 1-12.
7. Yeshua H, Oren R. Non invasive assessment of liver
fibro-sis. Ann Transplant 2008; 13: 5-11.
8. Abenavoli L, Addolorato G, Riccardi L, Gasbarrini A, Gas-barrini G, Rapaccini GL. Elastography assessment in
pa-tients with chronic HCV infection. Int J Clin Pract 2008;
62: 1108-12.
9. Cross T, Antoniades C, Harrison P. Non-invasive markers for the prediction of fibrosis in chronic hepatitis C
infec-tion. Hepatol Res 2008; 38: 762-9.
10. Sebastiani G, Alberti A. Non invasive fibrosis biomarkers
reduce but not substitute the need for liver biopsy. WJ
Gastroenterol 2006; 12: 3682-94.
11. Han KH, Yoon KT. New diagnostic method for liver fibrosis
and cirrhosis. Lntervirol 2008; 51: 11-6.
12. Bourlière M, Pénaranda G, Adhoute X, Oules V, Castellani P. Combining non-invasive methods for assessment of liver
fibrosis. Gastroenterol Clin Biol 2008; 32: 73-9.
13. Guha IN, Rosenberg WM. Noninvasive assessment of liver fibrosis: serum markers, imaging, and other modalities.
Clin Liver Dis 2008; 12: 883-90.
14. Helvaci M, Ozkaya B, Ozbal E, Ozinel S, Yaprak I. Efficacy of interferon therapy on serum fibronectin levels in
chil-dren with chronic hepatitis B infection. Pediatr Int 1999;
41: 270-3.
15. Hackl NJ, Bersch C, Feick P, Antoni C, Franke A, Singer MV, Nakchbandi IA. Circulating fibronectin isoforms
pre-dict the degree of fibrosis in chronic hepatitis C. Scand J
Gastroenterol 2010; 45: 349-56.
16. Attallah AM, Zahran F, Ismail H, Omran MM, El-Dosoky I, Shiha GE. Immunochemical identification and detection of serum fibronectin in liver fibrosis patients with
chro-nic hepatitis C. J Immunoassay lmmunochem 2007; 28:
331-42.
17. Attallah AM, Ismail H, Shiha GE, Abou-Dobara MI, El-Sher-biny RE, El-Dosoky I. Immunochemical identification and partial characterization of a native hepatitis C viral
non-structural 4 antigen in sera of HCV infected patients. Clin
Chim Acta 2008; 388: 115-22.
18. Poynard T, Bedossa P, Opolon P. Natural history of liver fi-brosis progression in patients with chronic hepatitis C. The OBSVIRC, METAVIR, CLINIVIR, and DOS VIRC groups.
Lancet 1997; 349: 825-32.
19. Wai CT, Greenson JK, Fontana RJ, Kalbfleisch JD, Marrero JA, Conjeevaram HS, Lok AS. A simple noninvasive index
can predict both significant fibrosis and cirrhosis in
pa-tients with chronic hepatitis C. Hepatol 2003; 38:
518-26.
20. Adams LA. Biomarkers of liver fibrosis. J Gastroenterol
Hepatol 2011; 26: 802-9.
21. Tamkun JW, Hynes RO. Plasma fibronectin is synthesized
and secreted by hepatocytes. J Biol Chem 1983; 258:
4641-7.
22. Benyon D, Arthur MJP. Extracellular matrix degradation
and the role of stellate cells. Semin Liver Dis 2001; 21:
373-84.
23. Junge J, Horn T, Christoffersen P. The occurrence and significance of fibronectin in livers from chronic alcoho-lics. An immunohistochemical study of early alcoholic liver
injury. APMIS 1988; 96: 56-61.
24. Tormihira M. Changes in plasma vitronectin, fibronectin, and serum laminin P1 levels and immunohistochemical study of vitronectin in the liver of patients with chronic liver
di-seases. Fukuoka lgaku Zasshi 1991; 82: 21-30.
25. Simon K, Zalewska M, Gladysz A, Rotter K, Piszko P, Glowacki A. A Plasma fibronectin in chronic liver
disease-marker of fibrosis? Przegl Lek 1995; 52: 129-32.
26. Kawasaki T, Takeshita A, Souda K, Kobayashi Y, Kikuyama M, Suzuki F, Kageyama F, et al. Serum thrombopoietin le-vels in patients with chronic hepatitis and liver cirrhosis.
Am J Gastroenterol 1999; 94: 1918-22.
27. Aster RH. Pooling of platelets in the spleen: role in the
pa-thogenesis of ‘hypersplenic’ thrornbocytopenia. J Clin
In-vest 1966; 45: 645-57.
28. Kamimoto Y, Horiuchi S, Tanase S, Morino Y. Plasma clea-rance of intravenously injected aspartate aminotransfe-rase isozymes: evidence for preferential uptake by
sinusoidal liver cells. Hepatol 1985; 5: 367-75.
29. Field KM, Dow C, Michael M. Part I: Liver function in
onco-logy: biochemistry and beyond. Lancet Oncol 2008; 9:
1092-101.
30. Stolz A, Kaplowitz N. Biochemical tests for liver disease. In: Zakim D, Boyer TD (eds.). Hepatology. A Textbook of Liver Disease, Vol. 1. Philadelphia PA: Saunders; 1990, p. 637-67.
31. Adams LA, Bulsara M, Rossi E, DeBoer B, Speers D, George J, Kench J, et al. Hepascore: an accurate validated pre-dictor of liver fibrosis in chronic hepatitis C infection.
Clin Chem 2005; 51: 1867-73.
32. Fortunato G, Castaldo G, Oriani G, Cerini R, Intrieri M, Molinaro E, Gentile I et al. Multivariate discriminant func-tion based on six biochemical markers in blood can predict
the cirrhotic evolution of chronic hepatitis. Clin Chem
2001; 47: 1696-700.
33. Rossi E, Adams L, Prins A, Bulsara M, de Boer B, Garas G, MacQuillan G et al. Validation of the FibroTest biochemical markers score in assessing liver fibrosis in hepatitis C
pa-tients. Clin Chem 2003, 49: 450-4.
34. Degos F, Perez P, Roche B, Mahmoudi A, Asselineau J, Voi-tot H, Bedossa P, et al. FIBROSTIC study group: Diagnostic accuracy of FibroScan and comparison to liver fibrosis biomarkers in chronic viral hepatitis: a multicenter
pros-pective study (the FIBROSTIC study). J Hepatol 2010; 53:
1013-21.
35. Shaheen AA, Wan AF, Myers RP. FibroTest and FibroScan for the prediction of hepatitis C-related fibrosis: a
syste-matic review of diagnostic test accuracy. Am J
Gastroen-terol 2007; 102: 2589-600.
36. Zaman A, Rosen HR, Ingram K, Corless CL, Oh E, Smith K. Assessment of FIBROSpect II to detect hepatic fibrosis in
37. Wong VW, Chan HL. Transient elastography. J
Gastroen-terol Hepatol 2010; 25: 1726-31.
38. Castera L. Non-invasive assessment of liver fibrosis in
chronic hepatitis C. Hepatol Int 2011; 5: 625-34.
39. Nguyen D, Talwalkar JA. Noninvasive assessment of liver
fibrosis. Hepatol 2011; 53: 2107-10.
40. Kettaneh A, Marcellin P, Douvin C, et al. Features associa-ted with success rate and performance of FibroScan mea-surements for the diagnosis of cirrhosis in HCV patients: a
prospective study of 935 patients. J Hepatol 2007; 46:
628-34.
41. Takemoto R, Nakamuta M, Aoyagi Y, et al. Validity of FibroS-can values for predicting hepatic fibrosis stage in patients
with chronic HCV infection. J Dig Dis 2009; 10: 145-8.
42. Shaheen AA, Myers RP. Systematic review and meta-analy-sis of the diagnostic accuracy of fibrometa-analy-sis marker panels in
patients with HIV/hepatitis C coinfection. HIV Clin Trials
2008; 9: 43-51.
43. Strader DB, Wright T, Thomas DL, Seeff LB. American As-sociation for the Study of Liver Diseases. Diagnosis,
ma-nagement, and treatment of hepatitis C. Hepatol 2004;