Microsoft Word - Presentació.doc
186
0
0
Texto completo
(2)
(3) TESI DOCTORAL UNIVERSITAT DE BARCELONA FACULTAT DE BIOLOGIA DEPARTAMENT DE BIOLOGIA ANIMAL Programa: Zoologia Bienni: 2004-2006. BIOLOGIA I GENÈTICA DE POBLACIONS DE L’ASCIDI INVASOR Microcosmus squamiger BIOLOGY AND POPULATION GENETICS OF THE INVASIVE ASCIDIAN Microcosmus squamiger. Memòria presentada per Marc Rius Viladomiu, realitzada en el Departament de Biologia Animal per accedir al títol de Doctor en Ciències Biològiques de la Universitat de Barcelona, sota la direcció dels doctors Xavier Turon Barrera i Marta Pascual Berniola. Marc Rius Viladomiu Barcelona, maig de 2008. VIST-I-PLAU EL DIRECTOR DE LA TESI Dr. Xavier Turon Barrera Professor titular de la UB Facultat de Biologia Universitat de Barcelona Posició actual: Professor d’investigació Centre d’Estudis Avançats de Blanes (CSIC). VIST-I-PLAU LA DIRECTORA DE LA TESI Dra. Marta Pascual Berniola Professora titular de la UB Facultat de Biologia Universitat de Barcelona.
(4)
(5) Agraïments / Acknowledgements. La veritat és que arribar a aquest punt és una sensació ben estranya. Tanta gent, tantes experiències acumulades, la llista d’agraïments hauria de ser inacabable. Primer de tot voldria agrair als primers responsables de tot plegat, a la meva família, pel seu suport i comprensió al llarg dels meus primers passos sota aigua i per tot el què ha vingut després. Els següents de la llista són tres professors i venen per ordre cronològic, des de Súnion, passant per la UB, fins a la Rhodes University. Sense els seus savis consells guiant-me en els meus primers passos no sé si me n’hauria sortit. Primer de tot vindria en Jordi Carmona, qui em va ensenyar amb passió i energia secrets del mar i, al començar la Universitat a Girona, em va donar uns consells importantíssims per començar a fer el meus petits passos per això que ells deien investigació. Llavors em vaig trobar amb en Mikel Zabala, qui em va donar l’oportunitat d’aprendre i treballar de valent a les illes Medes, a mitja jornada, mentre l’altra meitat me la passava a la reserva marina de Ses Negres. Llavors vaig fer el trasllat a la UB i després va vindre l’Erasmus a Lisboa, on vaig trobar-me fent els meus primers petits projectes. Va ser llavors quan vaig establir el primer contacte amb l’últim professor, en Christopher McQuaid. Segurament l’aventura més sonada que he fet mai. Haig d’agrair moltíssim a en Christopher la lliçó de vida, els consells i mil coses més durant l’experiència a l’intermareal sudafricà. Aquests tres noms sempre seran el punt d’inici i de connexió amb tot el què ha vingut després. Un cop passada aquesta etapa inicial, em vaig trobar de cop amb el doctorat. I bàsicament això va aparèixer del no res gràcies a un intercanvi d’e-mails amb la Susanna López-Legentil, amb qui ja des de feia molts anys comentàvem batelletes sota.
(6) l’aigua. Ella va ser la responsable (mil gràcies Su!) de posar-me en contacte amb en Xavier Turon a qui li haig d’agrair tantes i tantes coses, però potser la més important de totes, és que diposités tota la confiança en mi des de molt abans de començar el doctorat. Després de l’espera interminable per la resolució de la beca (i aquell...sinó me la donen què faré de la meva vida...), tot va anar molt ràpid, em vaig trobar a Grahamstown fent les maletes i acomiadant-me de tanta gent, tornant a casa i trobantme de cop a la meva antiga facultat de nou. Quines voltes dóna la vida! El primer pas varen ser els cursos de Doctorat i entremig el curs d’en Juan Carlos Castilla (terrible inspiració!). Llavors va tocar anar al Departament de Genètica a fer una genoteca, eh? com? sí, sí, quin primer gran pas dins el món molecular! Vull aquí agrair enèrgicament a la Marta Pascual per la seva dedicació i per ser la millor Cullera! ai no! Cu...jefa! També agrair a la Gemma Agell, Isabel Calderón i en Ferran Palero per ser els millors companys de poiata. Les hores interminables picant colònies bacterianes i fent PCRs es combinaven amb “meravelloses” immersions pica-pedrer a l’espigó de la tèrmica de Cubelles. Mil gràcies a l’Arianna Bucci i Isabel Calderón pels ajuts indispensables durant aquestes llargues immersions. En aquest moment va sorgir la col·laboració amb la Mari Carmen Pineda a qui li vull donar les gràcies per aguantar tantes penúries microcòsmiques amb tanta valentia. També en aquests temps va tocar anar a fer una immersió al Port de Barcelona, tota una experiència ben llefiscosa, però moltes gràcies Manuel Ballesteros per donar-me l’oportunitat. Després va vindre la visita al Hierro i a Tenerife, d’on va sortir una altra població per aquesta tesi, mil gràcies per l’hospitalitat de la Nayra i família, Núria, Salva, etc. De la campanya a Lisboa, voldria agrair com sempre l’hospitalitat de la Rita Amado i família, i l’ajut impecable de l'Anna Franzil i Arianna Bucci convencent al director de la marina de Cascais (obrigado mesmo!) perquè ens deixés agafar mostres a ca seva. D’aquí va venir.
(7) el DEA, l’intensiu curs de filogènies i genealogies de l’ADN, el mostreig a Santander (vaya aventura relámpago Isa!) i seguit el magnífic SIEBM, tan ben coordinat per la Creu, en Xavier, en Manuel i molta més gent. Indirectament voldria aquí agrair a en Teruaki Nishikawa per contribuir decisivament en el què ha estat la primera publicació d’aquesta tesi. Agrair als mostrejadors de Càdiz (Susanna López-Legentil) i de Bahía Falsa (Laura Rodríguez), importantíssimes mostres! També vull agrair a la gent de Brincadeira per omplir-me de tan i tan ritme aquest període i per entendre tan bé la meva forma de veure la vida. Arribats a aquest punt, varen arribar les crucials estades a l’estranger per les quals el Ministeri en va tenir un paper clau, aportant la raó i l’ajuda econòmica que sempre arriba tard. Bé, ara passo a l’anglès perquè almenys aquesta secció l’entenguem tots, o quasi tots. Firstly, I would like to acknowledge the people from Brisbane who showed me extreme generosity during my stay at the University of Queensland in 2006. I owe my experience there to Dustin Marshall, who I must greatly acknowledge for teaching me so much about larval experiments as well as about many other common sense aspects a great and refreshing perspective! Sarah McBratney and José Alsina were responsible for organizing the best start to my Ozzy experience. Many thanks for so kindly hosting me for my first few days in Brisbane, and for finding me such a nice place to stay. Once everything started, in stepped the others who made my stay such a lovely one. Thanks to Bronwyn Galletly, Angela Crean and Richard Allen for their help in the lab, with fieldwork and with helping me find my way around Brisbane. The best house mates Matthew Barnes and Lauren Zanetti, many thanks for your gentleness and easygoing way of life. Thanks also to Eleanor O’Brien for your wonderful hospitality in Perth. My gratitude extends to Iñaki Iturbe-Ormaetxe, Bego Heras and the international troop.
(8) (Alejandra Castillo, Flavien Caudron, Gregor Guncar, Pedram Rashidi and Gautier Robin) for sequestering me from my work during weekends to go for amazing excursions, suppers and parties. Just before the end of my stay we headed off on the annual lab retreat to Lennox head! Thanks to Richard, Simon, Peter, Bronwyn, Angela, Lissa and Dustin for such an unforgettable experience, especially with your strange animal impersonations :). Thanks again to Sarah McBratney and family for kindly inviting us for a delicious and festive Christmas lunch. My stay in Cape Town in 2007 was wet and cold, but really incredible as I managed to work with Charles Griffiths and George Branch, who have for a long time been inspiring influences on my marine biology study journey. I must thank them for hosting me in their labs and for many interesting discussions. A pleasant stay would not have been possible without the full support and affection of Jaclyn Murray, who I must THANK in capital letters for all and even more. Her family and her Corsa were absolutely crucial for the trips up and down along the South African coast with buckets full of ascidians, from really heavy seas to calm marinas...In Durban I almost broke my skull in half, gracias David Vizcaya por estar allí y por tu ayuda (y a todos los ñordos que vimos!). My lab mates at UCT, who had to suffer smelly ascidian experiments, thanks to Angela and Louise, and for your radio stories. Ah! and I would like to thank Sergio Neira por quedarse por el Departamento hasta intempestivas horas de la noche y así dar un poco de compañía. Eliecer Díaz, ay que decir, amigo! gracias por tu ayuda warriante en las marinas de Port Alfred y Kenton-on-Sea, los paseos por el festival (Porra!) y las discusiones filosofo-ecológicas (viva Chile m.....!). Ja de tornada a la UB, va tocar acabar feinetes i vull agrair a la gent del meu Departament Rocio i Creu per mil gestions i recomanacions, Nayra, Mercè, Núria, Salva, Leticia, Isa, Kele, Berta, Salvi, Josep, Laura, Vera & Co per entre d’altres.
(9) sortides fora i dins de la facultat, les memorables raquetes, i mil batalletes més. També vull agrair als FPUs de Vertebrats Rocío Moreno i Massimo Drago (AnélidoNemátodo...che!) per debats burocràtics múltiples i per algun que altre vinet amb mariscada! A la gent del Departament de genètica Pedro, Cinta, Víctor et al. per compartir penúries PCRriques i també personals ;). A la gent del Departament d’Ecologia, en Cesc Múrria per compartir els torns de les PCRs amb tanta paciència i per múltiples discussions filosòfiques, na Tura Puntí per guiar-me pel Western Austràlia (encara tinc la guia!), l’Enric Batllori per ser des de l’escola Mireia fins ara, finalment, un bona peça. Ah! i gràcies i gràcies a la gent del Parc Científic, especialment a la Berta, per la immensa paciència. Agrair a la Mercè Durfort la seva predisposició sempre tan positiva durant les tincions dels talls histològics. Ja cap al final de tot plegat va aparèixer en Víctor Ordóñez a qui li haig d’agrair la seva infalible ajuda tan i tan important per la recta final. En David Posada va aportar indispensables discussions amb els cladogrames. Vull agrair tan a l’Elisabet Torrelles com a la Núria Viladomiu per varis consells amb programes estadístics i altres consells de vida. Gràcies a la Sílvia, ups! noooo, a la Dra. de Juan per consells durant la tesi i ja a l’escriptura. La Laura Espasa va ajudar a millorar el català d’alguns textos i va organitzar una fabulosa sidra per celebrar que en Martí Orta i jo havíem caigut al forat del doctorat. Ja cap a finals de tot vaig posar el nas pel CEAB, però no vaig tenir temps de fer-me massa la idea. L’única cosa que em va quedar claríssim són les explosives nits d’estiu a la platja! La recta final no hauria estat possible sense les llargues estades a la calma del poble de Colomers, la constant interacció amb els jefes, ni tampoc sense el suport de la Jaclyn que ha estat importantíssim perquè aconseguís mantenir la moral i tirar endavant aquesta feinada... Em deixo algú? Segur que sí! doncs gràcies i més gràcies!.
(10)
(11) Table of contents. Chapter 1. General Introduction. 1. 1.1. Biological invasions in marine ecosystems. 1. 1.2. The ecological role of marine invasive species and their interactions. 4. with native communities 1.3. The target species, the ascidian Microcosmus squamiger. 6. 1.4. Generalities of the reproductive strategies and life history traits. 10. of the stolidobranch ascidians 1.5. Genetic markers and invasions. 10. Chapter 2. Objectives and structure of the thesis. 13. 2.1. Objectives of the thesis. 13. 2.2. Structure. 14. Chapter 3. Publications. 19. 3.1. Taxonomic revision and present distribution of Microcosmus. 21. squamiger in the Mediterranean Sea and adjacent waters Publication 1: Spread of Microcosmus squamiger (Ascidiacea: Pyuridae). 23. in the Mediterranean Sea and adjacent waters. 3.2. Population dynamics and life cycle of Microcosmus squamiger. 29. Publication 2: Population dynamics and life cycle of the introduced. 31. ascidian Microcosmus squamiger in the Mediterranean Sea.
(12) 3.3. Phylogeography of Microcosmus squamiger. 63. Publication 3: Phylogeography of the widespread marine invader. 65. Microcosmus squamiger (Ascidiacea) reveals high genetic diversity of introduced populations and non-independent colonizations. 3.4. Genetic differentiation and connectivity among populations of. 81. Microcosmus squamiger Publication 4: Isolation of polymorphic microsatellite loci for the. 83. marine invader Microcosmus squamiger (Ascidiacea) Publication 5: Population genetic structure of Microcosmus squamiger. 93. (Ascidiacea) revealed by microsatellite markers. 3.5. Ecological interactions between introduced and native species. 121. Publication 6: Trait-mediated effects of an invasive species in the. 123. marine environment. Chapter 4. Final discussion. 149. Chapter 5. Conclusions. 159. Chapter 6. References. 161. Chapter 7. Resum en català. 171.
(13) Chapter 1. General Introduction. In the last few decades there has been an increase in environmental awareness concerning biological invasions as one of the main menaces to global biodiversity. The impacts created by invasive species are today considered as one of the main threats to native ecosystems, but also to the global economy. Accelerating changes in marine ecosystems have recently emerged due to invaders, especially in coastal areas. This PhD thesis aims to study the biology, ecology and population genetics of the species Microcosmus squamiger, a marine organism that has been introduced in several locations around the world and that has become invasive in some regions. The multidisciplinary approach used in this dissertation aims to create a broad study framework for this organism. An overview of the general concepts related to the areas focused on in this dissertation is presented next.. 1.1. Biological invasions in marine ecosystems A biological invasion occurs when a species is artificially introduced, either deliberately or accidentally, into an area beyond its original range (Williamson 1996), where it is able to thrive and alter native biota. Although most introduced species do not successfully become established in their new environment (Kareiva 1996), some become naturalized and develop self-sustaining populations that can become invasive, in other words they spread and outcompete indigenous species which may result in an imbalance in the community (Griffiths et al. 1992). It is well documented that invasions by non-indigenous species (also called exotic, introduced, non-native or alien species) can alter the composition of biotic communities worldwide (Soulé 1990), and have. 1.
(14) major effects on the local biota and ecosystems (Ruiz & Carlton 2003). These influences range from depressing the growth of local populations, causing the displacement or extinction of native species, and restructuring local ecosystems. The ecological interactions involved in such processes include competition, facilitation, parasitism, predation, vertical and horizontal food-chain processes and hybridization (Williamson 1996, Sakai et al. 2001, Bruno et al. 2003, Corbin & D’Antonio 2004, Simberloff 2005), which can affect the native community either positively, negatively or, in some instances, both ways. Lodge (1993), and later Williamson and Fitter (1996), identified the characteristics of species that are prone to become invasive. The most broadly documented characteristics were the capacity to alter physical conditions (‘ecosystem engineers’), to prey on indigenous species, to compete aggressively for space and food, and to become a parasite of indigenous species. However, the best predictor seems to simply be the species’ history: species are likely to become invasive in a given place if there is evidence of this elsewhere (Branch & Steffani 2004). The typical sequence of a biological invasion is as follows: native distribution, transport survival, establishment in a new area, lag period, dispersion, ecological impact and human impact (see example in Box 1). The “lag period” is known as the time that it takes the species to successfully invade a new area, which might require several attempts. If multiple colonizations occur then genetic diversity becomes higher, allowing for increased evolutionary adaptability and a greater capacity to become invasive (Sakai et al. 2001).. 2.
(15) Box 1. Typical sequence of a marine invasion: A case study of Mytilus galloprovincialis in South Africa. Native distribution - Mediterranean Sea (Ceccherelli & Rossi 1984). Mytilus galloprovincialis. Transport survival - introduction through shipping and mariculture purposes (Branch & Steffani 2004, Griffiths et al. 2005) Establishment in a new area - it is believed to have been introduced to South Africa around the 1960/70s (Grant et al. 1984, Grant & Cherry 1985) Lag period - it has been short as this species has spread rapidly from its points of introduction (Branch & Steffani 2004) Dispersion - This species now covers 2050 km of South African shores colonizing all intertidal areas (Robinson et al. 2005). Ecological impact. Positive: creation of habitat complexity and enhancement of epifaunal diversity (Robinson et al. 2007a), food source for indigenous species such as the oystercatcher (Hockey & van Erkom Schurink 1992). Human impact. Negative: native biota such as indigenous mussels and limpets have suffered several alterations (Calvo-Ugarteburu & McQuaid 1998, Sebastian et al. 2002, Steffani & Branch 2003, 2005, Bownes & McQuaid 2006). Positive: spread and growth of the mariculture industry (Griffiths et al. 2005) and a possible development of a smallscale fishery (Robinson et al. 2007b). Negative: common aggressive fouling organism (Griffiths et al. 2005). Exotic species have been identified as one of the major threats to the maintenance of biodiversity and ecosystem functioning in marine systems (Mack et al. 2000, Crooks 2002). Marine organisms have mostly been moved around the world’s oceans since people first began navigating the seas (Carlton 1999), and the increase in transoceanic travel during the last century has seen a concurrent rise in the rate of introductions of alien marine species (Carlton 1996, Cohen & Carlton 1998, Mack et al. 2000, Wonham et al. 2001), especially in near-shore environments (Carlton and Geller 1993). Thus, non-indigenous species have been moving beyond natural physical boundaries such as those created by ocean currents, and have spread worldwide (Wonham et al. 2001).. 3.
(16) The Mediterranean Sea is a case in point. Ships have been navigating this sea since ancient times and today it serves as one of the world's major shipping routes. The Mediterranean is therefore one of the most affected seas worldwide with regard to invasive species (Zibrowius 1991, Galil 2000, Boero 2002, Galil et al. 2002, Galil 2007). There are five main sources of marine introductions to the Mediterranean: via deliberate introductions for food; mariculture or aquaria; in ballast seawater in ships larval organisms transported from their native ports in seawater ballasts to be dumped in other harbours (Carlton 1987, Chu et al. 1997); attached to ships (fouling); and the migration of organisms through canals that now connect seas previously separated by land (Carlton 1999, Branch & Steffani 2004). Although most invasions by marine organisms since the early 19th century are attributed to transportation in the ballast waters of shipping vessels (Carlton 1985, Wonham et al. 2000), there is a growing recognition that the main source of marine introduction is via fouling on ships hulls and the sea chests of ships and recreational vessels (Wasson et al. 2001, Lambert 2002, Coutts & Dodgshun 2007). When an introduced species manages to establish itself in a new environment it can potentially spread out to neighbouring regions by larval dispersal or asexual processes (Branch & Steffani 2004).. 1.2. The ecological role of marine invasive species and their interactions with native communities Marine organisms have an extraordinary array of ecological strategies that range from sessile forms to highly mobile species. For marine sessile organisms twodimensional space is critical for their establishment, and they are responsible for the structure of benthic communities (Gaines & Roughgarden 1985, Menge & Sutherland 1987, Underwood & Fairweather 1989, Menge et al. 1994, Robles 1997). After. 4.
(17) successful recruitment these organisms normally occupy as much as they can of the available surface, which subsequently results in strong ecological interactions. The most widely documented of these interactions is the competition for space (Dayton 1971, Sousa 1984, Lively et al. 1993, Marshall & McQuaid 1993). Competitive interaction between marine organisms on rocky shores is well understood (Paine 1971, Lubchenco & Menge 1978, Branch 1984, Connolly & Roughgarden 1999), and most of these studies have identified a competitive dominant that displaces a competitively inferior species. However, in complex, well-structured communities, a high diversity can be maintained through complex interaction networks (Buss 1986), the effect of intermediate levels of disturbance (Dayton 1971, Sousa 1984, Connell & Keough 1985), chemically-mediated interactions (Buss 1977, Harper et al. 2001) and facilitation (Bruno et al. 2003, Cebrian & Uriz 2006) or mutualism (Stachowicz 2001, Stachowicz & Whitlatch 2005). Marine invaders, when they become successfully established in their new environment engage in ecological interactions such as predation, competition or parasitism with the native community (Rilov et al. 2002, Torchin et al. 2002, Bando 2006, Rodriguez 2006), which determines the viability of the invader and the native biota in any particular situation (Williamson 1996). The most common scenario is that invasive species spread quickly in the new environment by displacing indigenous species (Grosholz 2002), which results in dramatic alterations of the native communities (Griffiths et al. 1992). On the other hand, marine invaders often generate structure in the community, thereby enhancing native species abundance and richness (Robinson et al. 2007a). Another important aspect is the species richness of the receiving community as it can regulate the invasion rate and the strength of the ecological interactions between the native and introduced species (Stachowicz et al. 2002). Generally, enhanced species. 5.
(18) richness reduces the likelihood of species invasions, although this is not always the case (Dunstan & Johnson 2004).. 1.3. The target species: The ascidian Microcosmus squamiger Ascidians are a common component of rocky shore communities worldwide, where they live attached to either natural or artificial substrata (Monniot et al. 1991). Although most ascidians have a very limited larval dispersal and a short-lived planktonic larval stage (Millar 1971, Olson 1985, Svane & Young 1989), they can often be caught in ballast pumps and settle within the ship. Alternatively, they might be attached to a structure such as drift algae or loose floating debris that can be pumped in (Carlton & Geller 1993). In addition, adults can be transported on ships hulls whereby they spread their larvae in the locations where these ships stop - mostly harbours and marinas (Lambert 2002). Ascidians are increasingly recognized as major invaders of the seas around the world (Lambert 2007). They have the ability to outcompete sessile organisms and to alter ecosystem functioning in numerous ways (Castilla et al. 2004, Bourque et al. 2007, Bullard et al. 2007). Lambert and Lambert (1998, 2003) surveyed harbours in California and documented the presence and persistence of non-indigenous ascidian species, nearly all of which were introduced over the last 20-30 years. In the Mediterranean Sea, non-indigenous ascidian species have recently been reported inside and outside of harbours (Brunetti 1978-79, Monniot 1981, Turon & Perera 1988, Turon et al. 2003, Mastrototaro & Dappiano 2005, Mastrototaro & Brunetti 2006, Turon et al. 2007). The solitary ascidian Microcosmus squamiger was first described by Michaelsen (1927) in a study of Australian samples, and is today considered to be native to Australia (Kott 1985, Monniot et al. 2001). However, it has spread throughout the world. 6.
(19) (Lambert & Lambert 1998, Monniot et al. 2001, Monniot 2002). In its introduced range this species is usually found in ports and marinas (Lambert & Lambert 1998, 2003, Ranasinghe et al. 2005), but it can spread to adjacent habitats as well, altering local benthic communities as it forms dense populations (see Fig. 2) and colonises aquaculture facilities (L. Rodríguez personal communication). Considering that M. squamiger has succeeded in establishing itself widely around the globe with nearly all introductions occurring in regions with a Mediterranean climate, and that all localities invaded by M. squamiger are in or close to large shipping harbours, it is reasonable to assume that transoceanic vessels are the most probable vector for the introduction of M. squamiger.. Fig. 1. Microcosmus squamiger individuals collected in Port Alfred marina (South Africa). Photograph taken by Charles Griffiths.. 7.
(20) In the Mediterranean Sea, M. squamiger was first recorded in the early 1960s in Bizerte (Tunisia) (Monniot 1981). This species has been confused with M. exasperatus in the literature, but a taxonomical revision by Turon et al. (2007) has established the present range of M. squamiger in the Mediterranean. This range covers the western half of the Mediterranean where it goes from Spain, to France, Italy and Tunis. Along the Spanish Mediterranean coast M. squamiger occurs on similar rocky substrata as that described by Kott (1985) in Australia; however, it prefers artificial rocky substrata and can also be found attached to harbour ropes (author’s personal observation). Although the size of a M. squamiger adult does not exceed 5 cm, this species typically adheres to other conspecifics and forms large aggregates, which compete for space with other species typical of artificial structures such as Mytilus galloprovincialis, Paracentrotus lividus, Ciona intestinalis, Ascidiella aspersa, Clavelina lepadiformis, Diplosoma spongiforme or Styela plicata (Turon 1988, Naranjo et al. 1996).. 8.
(21) Fig. 2. Monospecific carpets of Microcosmus squamiger on the breakwater of Cubelles (Spain). The arrows indicate the siphon positions of a few different individuals.. Fig. 3. Harbour ropes covered by large aggregates of Microcosmus squamiger dominating the fouling community in Port Elizabeth (South Africa).. 9.
(22) 1.4. Reproductive strategies and life history traits of the stolidobranch ascidians M. squamiger is included in the Order Pleurogona, Suborder Stolidobranchia and within the Family Pyuridae (Kott 1985). Most members of the Suborder Stolidobranchia, and all pyurids, are solitary forms (Monniot et al. 1991). Pyurids reproduce exclusively sexually (ascidians are hermaphroditic) (Millar 1971), which involves the spawning of both male and female gametes into the water column where fertilization takes places (Svane & Young 1989). After a few hours, the embryos hatch as free swimming larvae that are lecithotrophic and settle after a short period of time (normally a few hours). Once settlement has occurred, they suffer a radical metamorphosis and develop into the juvenile form (Cloney 1978). Although a few studies have undertaken in-depth research regarding the life cycles of pyurid species (Becerro & Turon 1992, Panagiotou et al. 2007), no study has focussed on M. squamiger. An important preliminary step in the management of any invasive species is to acquire comprehensive knowledge of its reproductive strategies and population dynamics. Only a few studies have focused on the life cycles of introduced marine organisms in their new environment (Grosholz & Ruiz 1996, Fine et al. 2001, Thornber et al. 2004). This type of study is crucial for understanding how invasive species establish themselves in new areas and continue to spread. Studies comparing the native and introduced range of the species are especially useful (Shenkar & Loya 2008).. 1.5. Genetic markers and invasions Genetic markers have been proposed as a very useful tool for monitoring and tracking the distribution of invasive species (Holland 2000, Sakai et al. 2001, Féral 2002), and have been implemented particularly in phylogeographic studies (e.g. Patti &. 10.
(23) Gambi 2001, Astanei et al. 2005, Gunasekera et al. 2005, Dupont et al. 2007). A key factor in the successful establishment of exotic species in new areas is the genetic diversity of introduced populations (Roman & Darling 2007), which can be indicative of the invasive potential of these populations. In addition, genetic markers can provide information regarding the origin of the introduced species, particularly when this is unknown (Stoner et al. 2002, Pascual et al. 2007). This is especially relevant for many common ascidian species living in harbours (e.g. Diplosoma listerianum, Clavelina lepadiformis, Ciona intestinalis, Ascidiella aspersa, Botryllus schlosseri, Styela plicata and Microcosmus squamiger) that are generally considered to be cosmopolitan. Phylogeographical studies can reveal their origin/s and the introduction pathways, which are often complex due to the possibility of multiple introductions from different or the same donor regions. Although a high number of molecular markers are available, not all of them have the variability level required to study intraspecific structure in the context of phylogeography, population genetics and connectivity. Two common markers used to respond to such questions are mitochondrial DNA (mtDNA) and microsatellites. The mtDNA has been one of the most commonly used tools for phylogeographical studies (Ballard & Whitlock 2004), especially because of the existence of universal primers (e.g. for invertebrates see Folmer et al. 1994), which work well for most species. The mtDNA genome has very singular characteristics as it is restricted to maternal inheritance in most eukaryotic organisms (Avise et al. 1987) and evolve rapidly (Brown et al. 1979). Fragments of the cytochrome c oxidase subunit I (COI) gene have been extensively used as genetic markers of exotic species (e.g. Roman & Palumbi 2004, Simon-Bouhet et al. 2006), and this marker has been proven to be highly informative for intraspecies studies in ascidians (Tarjuelo et al. 2001, Tarjuelo. 11.
(24) et al. 2004, López-Legentil & Turon 2006). Therefore, this marker is a good tool for the study of the phylogeography of introduced ascidian species (Turon et al. 2003, LópezLegentil et al. 2006). Another type of genetic marker, the microsatellites, has been used broadly in population genetic studies (Estoup & Angers 1998, Carreras-Carbonell et al. 2006, Selkoe & Toonen 2006). Microsatellites are found in nuclear DNA and are tandem repetitions of di, tri or tetranucleotides that have a variable number of repetitions in each allele for a specific locus (Queller et al. 1993). Important characteristics of these markers are the fact that they are highly variable, specific for each species and have a codominant inheritance (Wright & Bentzen 1994, Estoup & Angers 1998, Selkoe & Toonen 2006). Microsatellites have been identified as one of the most appropriate genetic markers for marine invertebrates (Stoner et al. 1997), especially to analyse population structure and assess questions at both intra and interpopulation level (Duran et al. 2004b, Calderón et al. 2007). They have the ability to estimate genetic structure and connectivity between populations through the calculation of reliable population differentiation parameters, which are essential for conservation purposes (Balloux & Lugon-Moulin 2002). Studies using microsatellite markers have been successfully used to track introduced species (e.g. Rinkevich et al. 2001, Stoner et al. 2002, Provan et al. 2005). Further genetic studies focussing on marine introduced species are necessary to understand patterns of introductions and their pathways, especially in heavily shipped regions of the world, such as the Atlanto-Mediterranean range, where research focussing on marine introduced species using molecular tools has been scarce (Turon et al. 2003, Duran et al. 2004a, López-Legentil et al. 2006).. 12.
(25) Chapter 2. Objectives and structure of the thesis. Several studies have focussed on invasive species and their consequences for the native community. However, studies undertaking a multidisciplinary approach on a particular invasive species are rare and this is probably the most adequate way to establish a baseline study for future management plans of an invader. This scarcity of reported studies could be due to the difficulties of integrating different disciplines in a single research attempt. Here we present an integrative and multidisciplinary study which covers many different aspects of the ascidian species Microcosmus squamiger. Specifically we aim towards understanding the most relevant aspects of M. squamiger’s life-history and biology, as well as the worldwide phylogeography of this species and the degree of connectivity between populations and the patterns of invasions. As this is the first study that has focussed on M. squamiger, the information previously available for this species was extremely limited. However, other studies focussing on ascidian species have helped to formulate the questions covered in this dissertation.. 2.1. Objectives of the thesis 1. To clarify the present distribution of M. squamiger in the Mediterranean Sea and adjacent areas. 2. To assess the population dynamics and life cycle of M. squamiger, including its reproductive biology and aspects of potential interactions with native species. 3. To undertake a worldwide phylogeographic study using mtDNA sequence data to track the spread of this organism from its native area and to assess whether the colonization of different regions has happened independently or not.. 13.
(26) 4. To develop polymorphic microsatellite markers for Microcosmus squamiger in order to assess connectivity and genetic differentiation between populations during the colonization of new areas 5. To examine the interactions of Microcosmus squamiger with another ascidian species (introduced) within its native range, examining both lethal and non-lethal effects across multiple life-history stages, and how these can affect the distribution in the field of the two studied species.. 2.2. Structure The thesis is structured in five sections, according to the objectives mentioned above.. Taxonomic revision and present distribution of Microcosmus squamiger in the Mediterranean Sea and adjacent waters Publication 1: Spread of Microcosmus squamiger (Ascidiacea: Pyuridae) in the Mediterranean Sea and adjacent waters. The Mediterranean Sea is an increasing hotspot for non-indigenous marine organisms. Microcosmus squamiger has only been reported at a few sites in Spain and Italy. However, the closely related species Microcosmus exasperatus has been reported in several areas of the western and eastern Mediterranean. As both species can easily be confounded, this manuscript aims to clarify the Mediterranean distribution of M. squamiger and M. exasperatus. For this we reviewed specimens housed in the Muséum National d'Histoire Naturelle, Paris, as well as our personal collections and specimens provided by other researchers. We have also revised the relevant literature and asked authors to check the identity of specimens that they had previously classified as M.. 14.
(27) exasperatus. In addition we aim to update information pertaining to the distribution of M. squamiger through sampling several coastal locations of the western Mediterranean Sea and Atlantic Ocean.. Population dynamics and life cycle of Microcosmus squamiger Publication 2: Population dynamics and life cycle of the introduced ascidian Microcosmus squamiger in the Mediterranean Sea A crucial preliminary step in the management of any invasive species is to acquire a deep knowledge of its biology and ecology; in particular what concerns reproductive strategies, growth rates, population dynamics, and interactions with other species. In this manuscript we studied the population dynamics of M. squamiger over a 2-year period in a western Mediterranean coastal location. We monitored the life cycle features of this species through analyses of its population structure and reproductive cycle, as well as its settlement and colonization patterns on bare substratum. In addition, we monitored the abundance of the native predator T. haemastoma and tested its correlation with the abundance of the ascidian prey.. Phylogeography of Microcosmus squamiger Publication 3: Phylogeography of the widespread marine invader Microcosmus squamiger (Ascidiacea) reveals high genetic diversity of introduced populations and non-independent colonizations Phylogeographical studies have shown the usefulness of genetic markers in tracking introduced species. M. squamiger is a good model for this type of study as the presumed native range is known and it has spread around the world. In this study we investigated the global genetic structure of M. squamiger based on the amplification of. 15.
(28) a fragment of the mitochondrial cytochrome c oxidase subunit I gene of 12 populations collected from all the oceans where this species is found. Firstly, we aim, to determine the phylogeographic relationships between worldwide populations in order to track the spread of this organism from its native area; secondly, we seek to assess whether the colonization of different regions has been achieved independently or not, and finally we study the relationships between populations situated inside and outside of harbours.. Genetic differentiation and connectivity among populations of Microcosmus squamiger Publication 4: Isolation of polymorphic microsatellite loci for the marine invader Microcosmus squamiger (Ascidiacea) Genetic studies have revealed key information regarding invasive species origin, the pathways through which they have been introduced and the pattern of gene flow and connectivity between populations. The use of microsatellites generally enables a detailed study of the genetic structure of a species, from which inferences about gene flow levels and other processes leading to the present day distribution can be inferred. Here, eight polymorphic microsatellite DNA markers were developed and tested for polymorphism in two M. squamiger populations. Publication 5: Population genetic structure of Microcosmus squamiger (Ascidiacea) revealed by microsatellite markers Microsatellites have been broadly used to study the genetic relationships between populations, to infer gene flow and to uncover the pathways of introduction of alien species. In this study we investigated the genetic structure of M. squamiger based on 5 microsatellite loci in 11 worldwide populations to determine the genetic relationships between populations and to reconstruct the animal’s colonization history.. 16.
(29) We studied how human-mediated transport has shaped the present day distribution of the species, and compared the genetic diversity of native and introduced populations. We carried out intense sampling along the populated Atlanto-Mediterranean arch, in order to study patterns of connectivity in this area and to ascertain whether the Gibraltar strait does or does not represent a genetic boundary between M. squamiger populations on either side of it.. Finally, we tested the degree of isolation by distance among populations to understand the spread of this species, which is likely to rely on artificial means rather than its natural dispersal capabilities.. Ecological interactions between introduced and native species Publication 6: Trait-mediated effects of an invasive species in the marine environment Although the number of studies examining the effects of marine invasive species has increased dramatically, the study of the effects of invasive species in the marine environment are largely restricted to adult stages and the competitive displacement that invasive species cause within native communities. Given that the supply of recruits into marine populations can have major influences on subsequent community dynamics and that the production of zygotes has the potential to limit population growth, marine invasive species have the potential to exert non-lethal effects across all life-history stages. Here we examine the effects of an introduced marine species on a native species across the life-history, from fertilisation to larval settlement through to postmetamorphic performance. The species studied are two solitary ascidians, one introduced to Australia (Styela plicata) and one native (Microcosmus squamiger). We first examined whether the presence of heterospecific sperm from the introduced species reduced the fertilisation success of the eggs of a native species. We then examined the. 17.
(30) larval settlement responses of each species in the presence and absence of heterospecific and homospecific settlers. Finally, we examined the post-metamorphic survival and growth of both species in the presence and absence of the heterospecific recruits in the field.. 18.
(31) Chapter 3. Publications. 3.1. Taxonomic revision and present distribution of Microcosmus squamiger in the Mediterranean Sea and adjacent waters Publication 1: Spread of Microcosmus squamiger (Ascidiacea: Pyuridae) in the Mediterranean Sea and adjacent waters.. 3.2. Population dynamics and life cycle of Microcosmus squamiger Publication 2: Population dynamics and life cycle of the introduced ascidian Microcosmus squamiger in the Mediterranean Sea. 3.3. Phylogeography of Microcosmus squamiger Publication 3: Phylogeography of the widespread marine invader Microcosmus squamiger (Ascidiacea) reveals high genetic diversity of introduced populations and non-independent colonizations. 3.4. Genetic differentiation and connectivity among populations of Microcosmus squamiger Publication 4: Isolation of polymorphic microsatellite loci for the marine invader Microcosmus squamiger (Ascidiacea) Publication 5: Population genetic structure of Microcosmus squamiger (Ascidiacea) revealed by microsatellite markers. 3.5. Ecological interactions between introduced and native species Publication 6: Trait-mediated effects of an invasive species in the marine environment. 19.
(32) 20.
(33) 3.1. Taxonomic revision and present distribution of Microcosmus squamiger in the Mediterranean Sea and adjacent waters. Publication 1: Xavier Turon, Teruaki Nishikawa, Marc Rius (2007) Spread of Microcosmus squamiger (Ascidiacea: Pyuridae) in the Mediterranean Sea and adjacent waters. Journal of Experimental Marine Biology and Ecology 342: 185-188. 21-25.
(34) 26.
(35) Dispersió de Microcosmus squamiger (Ascidiacea: Pyuridae) en el mar Mediterrani i aigües adjacents. El mar Mediterrani està subjecte a una creixent arribada d’organismes marins no natius. L’espècie Microcosmus squamiger és un ascidi solitari que viu en hàbitats rocosos somers. Aquesta espècie és probablement originària d’Austràlia i ha demostrat un gran potencial invasor en altres parts del món. En el Mediterrani, M. squamiger només ha estat trobat en algunes localitats a Espanya i a Itàlia. Tot i així, l’espècie germana Microcosmus exasperatus ha estat trobada en diferents zones del Mediterrani occidental. Degut al fet que aquestes espècies poden ser confoses fàcilment, es va tornar a examinar la major part del material d’estudis previs i les nostres col·leccions personals. A més a més, es varen realitzar prospeccions en varies localitats al llarg de les costes del Mediterrani occidental i la costa Atlàntica. Els resultats mostren que la majoria de les cites de M. exasperatus corresponen a M. squamiger i que M. squamiger és comú en les costes de l’Atlàntic. Això suggereix que M. squamiger ha estat introduït al Mediterrani a través de l’Estret de Gibraltar, mentre que la distribució restringida en el Mediterrani oriental de M. exasperatus suggereix que aquesta espècie és probablement un migrant lessepsià. En el Mar Mediterrani, M. squamiger té l’habilitat d’ocupar extenses zones de substrat durs y excloure espècies natives. En un futur és necessari realitzar estudis per tal d’avaluar els impactes que aquesta espècie invasora pot provocar a les comunitats natives.. 27.
(36) 28.
(37) 3.2. Population dynamics and life cycle of Microcosmus squamiger. Publication 2: Population dynamics and life cycle of the introduced ascidian Microcosmus squamiger in the Mediterranean Sea. 29.
(38) 30.
(39) Population dynamics and life cycle of the introduced ascidian Microcosmus squamiger in the Mediterranean Sea. Marc Rius 1,*, Mari Carmen Pineda 1, Xavier Turon 2. 1. Departament de Biologia Animal (Invertebrats), Facultat de Biologia, Universitat de. Barcelona. Avinguda Diagonal 645, 08028, Barcelona. 2. Centre d’Estudis Avançats de Blanes (CEAB, CSIC). Accés a la Cala S. Francesc, 14,. 17300 Blanes (Girona), Spain * Corresponding author: marcriusvil@ub.edu. Biological Invasions (in press). 31.
(40) Abstract Marine introductions are a serious threat for biodiversity, especially in seas where shipping is intensive. Microcosmus squamiger is a widespread marine invader that can alter native biota and it is therefore imperative to understand its biology and ecology. We studied the population dynamics and reproductive cycles of M. squamiger over a 2-year period, as well as its settlement and colonization patterns, in a Mediterranean locality where M. squamiger has been introduced. All biological parameters showed a strong seasonal pattern that peaked in summer with a major spawning episode at the end of summer. Size-frequency histograms indicated a 2-year cycle. Colonization experiments suggested that M. squamiger recruitment mortality is high and requires a well structured community. In addition, we monitored the abundance of the native predator Thais haemastoma, which showed a significant positive correlation with M. squamiger biomass, indicating its potential usefulness as a biological control.. Keywords: invasive species, population dynamics, life cycle, Microcosmus squamiger, gonad index, biological control. 32.
(41) Introduction Biotic invasions are one of the major threats for the maintenance of global biodiversity (Mack & D'Antonio 1998, Mack et al. 2000). In the Mediterranean Sea, the increasing arrival of non-indigenous marine organisms through shipping, mariculture and with the opening of the Suez Canal has resulted in serious alterations of the native biota (Galil 2000, Streftaris & Zenetos 2006). Some introductions have caused loss of biodiversity and are threatening native species (Papaconstantinou 1990, Zibrowius 1991, Galil 2000, Occhipinti Ambrogi 2000, Fine et al. 2001, Piazzi et al. 2001, Boudouresque & Verlaque 2002, Galil 2007). Ascidians have recently received great attention as marine invaders (Lambert 2007, Whitlatch & Bullard 2007). They can spread through shipping (Wasson et al. 2001) and, once established, extend their range rapidly (Bullard et al. 2007) to become the dominant species (Lambert & Lambert 2003), displacing the native space occupiers (Castilla et al. 2004). The solitary ascidian Microcosmus squamiger (order Stolidobranchia, family Pyuridae) is considered to be native to Australia (Michaelsen 1927, Kott 1985, Monniot et al. 2001) but it has been detected worldwide (Naranjo & García-Gómez 1994, Naranjo et al. 1996, Lambert & Lambert 1998, Monniot et al. 2001, Monniot 2002, Godwin 2003, Primo & Vázquez 2004, Turon et al. 2007, Rius et al. 2008). In its introduced range, this species can live attached to either artificial or natural hard substrata both inside and outside of harbours (Naranjo et al. 1996). M. squamiger is currently considered a global marine invader, as it has established itself in many regions around the world where it alters local biota (Lambert & Lambert 1998, 2003, Turon et al. 2007). In southern California, for example, the solitary ascidian Styela canopus that was previously well established in harbours, is now in decline while M. squamiger has. 33.
(42) increased its abundance and appears to be replacing S. canopus (Lowe 2002). In a nearby location, Bahía Falsa, this species has been found in high abundance in oyster farms, where it poses an economic threat (pers. comm. L. Rodríguez). Even in its native range this species has been found competing for space with oysters on the western (Kott 1985) and eastern (M.R. pers. obs.) Australian coasts, and in Tasmania, where it can be destructive to oysters (Kott 1985). As a result, this species must be considered as a potential threat for both the local biota and economies. In the Mediterranean Sea, M. squamiger was first recorded (as M. exasperatus) in the early 1960s in Bizerte, Tunisia (Monniot 1981). Since then, Mediterranean records of this species have frequently referred to it as M. exasperatus, but a taxonomic revision by Turon et al. (2007) has established the present range of M. squamiger in the Mediterranean, which covers its entire western basin. Crucial to the establishment of an alien species as an invader is its ability to overcome local control by resident species (Osman & Whitlatch 1998, Stachowicz et al. 2002), the adequacy of temperature and other parameters for its development (deRivera et al. 2007), and interactions with native predators (Noonburg & Byers 2005) and local biota (Ranasinghe et al. 2005, Rodriguez 2006). Clearly, a preliminary step in the management of any invasive species is to acquire a deep knowledge of its biology and ecology, in particular, what concerns reproductive strategies, growth rates, population dynamics, and interactions with other species. Only a few studies have focused on the life cycles of introduced marine organisms in their new environment (e.g. Grosholz & Ruiz 1996, Fine et al. 2001, Thornber et al. 2004). In the case of ascidians, although information is accumulating on biological and ecological features of solitary and colonial species (e.g. Turon 1988, Becerro & Turon 1992, Turon & Becerro 1992, Giangrande et al. 1994, Eckman 1996, de Caralt et al. 2002, López-Legentil et al. 2005,. 34.
(43) Pérez-Portela et al. 2007), studies focussing on introduced ascidians are rare (but see Yamaguchi 1975, Parker et al. 1999, Shenkar & Loya 2008). This type of study is crucial for understanding the colonizing processes of invasive species, as well as their establishment in the new environment and potential interactions with native species. From preliminary observations we often witnessed the muricid gastropod Thais haemastoma actively predating on M. squamiger by inserting its proboscis through the ascidian tunic. In this work we studied, for the first time, the population dynamics of M. squamiger over a 2-year period in a location on the northeast coast of the Iberian Peninsula. M. squamiger is the dominant species along this stretch of coast (Turon et al. 2007), densely carpeting rocky reefs, thriving on natural and artificial rocky reefs and displacing native assemblages (M.R., M.P. and X.T. pers. obs.). We monitored the life cycle features of this species through analyses of its population structure and reproductive cycle, as well as its settlement and colonization patterns on bare substratum. In addition, we monitored the abundance of the predator T. haemastoma and tested its correlation with the abundance of the ascidian prey.. Materials and Methods Study site The study was undertaken in the outer part of the main breakwater of Cubelles (41º11’37.2”N, 1º39’17.46”E). This coastal defence structure (approximately 800 m long) faces southeast and is formed by concrete blocks (~ 4 m2). The closest main harbour and recreational marina are situated in Tarragona (ca. 40 Km) and Segur de Calafell (ca. 4 Km) respectively. The sea bottom is constituted by fine sand and, as a result, the only hard substratum available is the actual breakwater. The maximum depth. 35.
(44) is 3 meters and M. squamiger has colonized from the bottom up to a few centimetres below the surface, covering 100% of the available space in most places. In the upper level of its distribution, M. squamiger shares the available space with clumps of the mussel Mytilus galloprovincialis. Five points separated by at least ~ 25 meters were randomly selected along the coastal defence structure. Fieldwork Surveys were done monthly from July 2005 until June 2007 using SCUBA. For the study of abundance and population structure we performed scrapings of the rocky surface at each sampling point (n=5) using a chisel. The area scraped was 18*12 cm, and it was delimited by a metal frame randomly placed on the substratum. Each sample was placed in a labelled plastic bag. To detect the scraped plots in subsequent surveys (see below), we marked them with a plastic label attached to a bolt with a cable tie. The bolts were driven into holes bored at one corner of the scraped area using a manual drill. The water temperature was recorded using a dive computer with 0.1 ºC of precision. In addition, we surveyed the abundance of T. haemastoma through randomly placing two 50x50 cm quadrats on the rock at each of the five sampling points and counting all T. haemastoma individuals in the quadrats. In order to study the reproductive cycles of M. squamiger, we randomly collected 25 fully grown individuals situated away from the sampling points. After each dive we transported the samples to the laboratory in a 20 l insulated container with seawater. Transport time did not exceed 45 minutes. In February 2006, we studied whether depth had any effect on the length and wet weight of M. squamiger populations. For this, we divided the breakwater in 3 depth levels (1 meter each) from surface to bottom. In each of the 5 sampling points we randomly collected 5 fully grown animals per depth level.. 36.
(45) In order to assess recruitment, we periodically placed settlement plates in the field (see Millar 1971). We used Petri dishes (60 mm diameter), as they have proved to be a good settlement substrata for this (Rius et al. under review) and other ascidian species (Marshall & Keough 2003, Marshall et al. 2006). We carefully made an 8 mm hole in the centre of each Petri dish, through which a nylon screw could be passed. In the field, we bored two holes into the rock surface at each sampling point using a manual rock drill. In each hole we hammered an expandable clamp, to which the nylon screws bearing the Petri dishes could be fastened. This study started in December 2005 and the dishes (10 in total) were removed monthly (from January to October 2006) and replaced by new ones. The dishes were transported to the laboratory in a 2 l container with seawater and they were either observed immediately or frozen for later examination using a dissecting microscope. We systematically scrutinized each dish for the presence of M. squamiger recruits. The monthly scrapings provided experimental units for assessing colonization of bare substrata by M. squamiger. In March 2007 we re-scraped all sampled squares. We managed to re-scrape most squares from each sampling date, except July and November 2005 for which all labels were lost. Thus, we had a range of surfaces with different times of exposure and different seasons of initial scraping. Laboratory techniques Once in the laboratory the scraped material was immediately fixed using 70% ethanol. During sample processing, all M. squamiger individuals were separated from the rest of the organisms (polychaetes, molluscs, algae and other ascidians) and sand using a 3 mm sieve under running freshwater. During the cleaning of M. squamiger samples, we occasionally found a similar species, Microcosmus polymorphus, which could be distinguished from M. squamiger because M. polymorphus is generally bigger,. 37.
(46) has a tougher tunic and a larger and tougher attachment base. In case of any doubt, specimens were dissected and identified following Monniot (1962). To obtain the abundance of M. squamiger, sample counts were transformed to individuals per square meter. The tunics of M. squamiger individuals were carefully cleaned to remove any attached organisms. We then measured the body of the individuals (length, width, height and intersiphonal distance) to the nearest mm using a calliper. Subsequently, we blotted the animal on paper tissue and measured the wet weight of the whole organism. Afterwards, the ascidians were dissected, tunic and mantle separated, blotted dry and wet weighed. Finally we placed the mantle and the tunic at 60ºC for 24 hours to obtain their dry weight. After measuring and weighing many individuals (see results), we found a highly significant positive relationship between all variables and, as the whole process was extremely time consuming, we decided to simplify the measurements of the subsequent individuals (N = 1439) by measuring only the length and the wet weight of the entire organism. The same methodology was used for the samples taken to assess differences of M. squamiger populations at different depths and for the re-scraped samples. The samples for the study of the reproductive cycles were preserved using 10% buffered formalin, to better preserve the internal organs. We dissected 5 individuals per month and separated the gonads from the mantle by carefully dissecting the gonad lobes under a dissecting microscope. Care was taken especially with the left gonad to avoid cutting away fragments of the gut. Subsequently, we measured the wet and dry weight of the gonads, mantle and tunic as described above. A gonad index was then calculated dividing the added dry weights of the two gonads by the mantle dry weight as described in Becerro & Turon (1992).. 38.
(47) In order to analyse the state of maturity of the gonads, we analysed stained sections of the gonad. For this, we dissected at least 3 individuals per sampling date and we cut a piece of the central lobe of the right gonad (ca. 0.025 cm2). The pieces of gonad tissue were placed separately in a 1.5 ml eppendorf and dehydrated. They were kept in 70% ethanol for one day, then in 96º ethanol for 1 h, and finally two 1 h steps in absolute ethanol. In order to achieve a complete paraffin embedding, samples were immersed in a xylene bath for 1 h and then placed in liquid paraffin (kept at 60ºC) for 24 h, followed by a change of paraffin and an additional 24 h at 60ºC. Subsequently, we placed the pieces of tissue in standard plastic moulds fitted to histological cassettes (4*3 cm) filled with liquid paraffin (60ºC), and let them harden for 1 week. The paraffin blocs were then placed in a rotary microtome (Microm HM 330) and thick sections were cut until the middle part of the gonad tissue was reached. At this point we obtained a series of 6 µm sections per individual. The sections were immersed in a freshwater bath with some gelatine and adhered to microscope slides. Afterwards, we removed the paraffin through an initial 10 min bath in xylene, followed by 2 xylene steps of 5 min, four 2 s immersion steps in absolute ethanol, four immersions for 2 s in 96º ethanol and, finally, four 2 s steps in distilled water. Then, we stained the sections following the haematoxylin-eosin method used by Maíllo (2003) with some modifications. This method consisted in submerging all preparations in Harris Haematoxylin (1 % aqueous solution) for 10 min, followed by 10 min in running freshwater. Differentiation was achieved through an immersion in a 100:1 water/HCl (35%) solution followed by another 10 min in running freshwater. Then, we immersed the samples in 2% Eosin (aqueous solution) for 10 min, followed by four 2 s steps in 96% ethanol, four 2 s steps in absolute ethanol and finally six 2 s steps in xylene.. 39.
(48) The gonad sections were observed under a microscope equipped with a micrometer. We measured the diameter of oocytes (following Bingham 1997) sectioned through the nucleolus (100 oocytes whenever possible, and a minimum of 70). For the testes we established a categorical maturity index, following Becerro & Turon (1992) according to five (subjective) degrees of male follicle development (i.e., 1 = absent, 2 = traces, 3 = low, 4 = medium and 5 = high). Data analysis Morphometric relationships were tested by the Spearman Rank Correlation coefficient, and the significance level Bonferroni-adjusted for the number of pairwise comparisons between variables made. Temporal trends of several variables were correlated with temperature using cross-correlation analysis, in which the standard Pearson coefficient between variables was calculated with one variable lagged with respect to the other (time lags were in months). One-way ANOVA was performed to assess the effect of depth in the length and wet weight data from the organisms collected for this purpose in February 2006. Normality and homogeneity of variance of the data were tested using Shapiro-Wilk’s W test and Levene’s test, respectively. We performed all analyses using the software SYSTAT (v. 11, SPSS Inc., 2004), STATISTICA (v. 6, Statsoft Inc., 2001) and SPSS (v. 12, SPSS Inc., 2003).. Results The patterns of abundance over the study period are shown in Fig. 1a. M. squamiger occurs in high numbers (from ca. 500 up to ca. 2300 individuals/m2) all year round. The most prominent feature observed was a steep decrease in abundance following the maximum temperature in July 2005 and 2006. The values of density are. 40.
(49) more erratic in the winter months, which may indicate that our sample size for this variable was not enough to capture the spatial heterogeneity of the population. Decreases in abundance were observed at the end of winter (February 2006 and 2007). Overall, an increasing trend in numbers during spring was evident in 2006, leading to a peak in July. This same increase was found in spring 2007, and the abundance values at the end of the study were the highest recorded. A cross-correlation analysis of abundance versus temperature (Fig. 8a) shows that the correlation coefficient was not significant at any time lag, although the highest coefficients corresponded to a negative relationship between abundance and temperature in the preceding months (time lags of 2 and -3). We found that all morphometric variables of the individuals measured showed a significant positive correlation when paired-comparisons were made using 522 individuals from the first 13 months (Table 1). We therefore restricted further analysis to only length and wet weight. When we plotted the values of these variables over the study period (Fig. 1b)a decline in both variables after summer was apparent, with the values remaining low during winter and increasing again in spring. This pattern was superimposed to a general decreasing trend from the beginning of the study (July 2005), when all variables showed the highest values, until the end of the study.. 41.
(50) Table 1. Spearman Rank Order correlations among all variables measured on Microcosmus squamiger. *** indicates significant correlation after a Bonferroni correction.. Spearman correlations. Length. Width. Height. Intersiphonal distance. Wet weight. Mantle wet Mantle weight weight. Length. 1. 0.817***. 0.853***. 0.903***. 0.925***. 0.882***. 0.896***. 1. 0.799***. 0.775***. 0.909***. 0.877***. 0.87***. 1. 0.845***. 0.921***. 0.865***. 0.869***. 1. 0.884***. 0.826***. 0.848***. 1. 0.933***. 0.939***. 1. 0.932***. Width Height Intersiphonal distance Wet weight Mantle wet weight Mantle dry weight. 1. 42. dry.
(51) 3000 30. 25. 2000. 1500 20 1000. Temperature (ºC). Individuals * m-2. 2500. A. Abundance Temperature. 15 500. 2.5. 16. 2.0. 14. 1.5. 12. 1.0. 10. 0.5. 8. Wet weight (g). Length (mm). 18. J A S O N D J F M A M J J A S O N D J F M A M J Length B Weight. 0.0 J A S O N D J F M A M J J A S O N D J F M A M J. Figure 1. (a) Mean density of Microcosmus squamiger and water temperature over the study period. (b) Mean length and wet weight of Microcosmus squamiger over the study period. Vertical bars denote standard error.. The mean values of size-related variables (length and weight) did not reflect the underlying cohort dynamics. We therefore plotted these variables in separate sizefrequency histograms per month (Fig. 2, as weight and length provided the same information, only length is shown) to elucidate the settlement period (Millar 1971) and. 43.
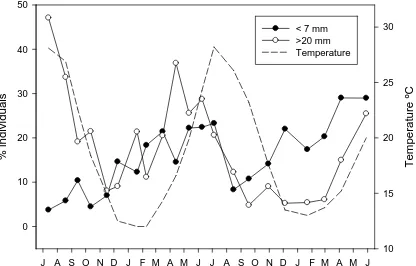
(52) the longevity of M. squamiger. There was a bimodal distribution apparent in the months from March to July. After that, there was a decrease in numbers in August through October associated with the disappearance of the largest mode. The remaining individuals increased in size in the following months and, in February small individuals began to become abundant, with the bimodality being restored during the following months. The overall pattern was repeated in the second year of the study. The observations are coherent with a 2-year cycle, with small individuals appearing in the samples around February-March, growing until August the following year, and disappearing in September. Each cohort coexists with the next one during some months (in its second winter), in which a bimodal distribution of size is observed. The decreasing trend observed in the mean size values (Fig. 1b) was the result of the high proportion of individuals of the younger cohort in the last months of the study. When we plotted the percentages of small (< 5mm) and big (>20 mm) individuals of each month (Fig. 3), the appearance of small recruits in autumn-winter, and the decline in big specimens at the end of summer was highlighted.. 44.
(53) n. individuals. % individuals. 20. July 05. 15 10 5 0 10. 15. 20. 25. 30. 35. August 05. 15 10 5 15. 20. 25. 30. 35. 15 10 5 0 10. 15. 20. 25. 30. 35. October 05. 10 5 0 15. 20. 25. 30. 35. November 05. 15 10 5 15. 20. 25. 30. 35. 5 10. 15. 20. 25. 30. 35. 40. 20. August 06. 15 10 5 10. 15. 20. 25. 30. 35. 40. 20. September 06. 15 10 5 10. 15. 20. 25. 30. 35. 40. 20. November 06. 15 10 5. 40. December 05. 15. 5. n. individuals. n. individuals. 10. 20. 10 5. 10. 15. 20. 25. 30. 35. 40. 20. December 06. 15 10 5 0. 5. 10. 15. 20. 25. 30. 35. 40. 5. 20. n. individuals. n. individuals. 40. July 06. 5. 0. January 06. 15 10 5 0 5. 10. 15. 20. 25. 30. 35. 20. February 06. 15 10 5. 10. 15. 20. 25. 30. 35. 40. 20. February 07. 15 10 5 0. 40. 5. n. individuals. n. individuals. 35. 0 5. 10. 15. 20. 25. 30. 35. 40. 20. March 07. 15 10 5 0. 0 5. 10. 15. 20. 25. 30. 35. 20. Mach 06. 15. 5. 40. n. individuals. n. individuals. 30. 10. 40. n. individuals. n. individuals. 10. 20. 0. 10 5 0. 10. 15. 20. 25. 30. 35. 40. 20. April 07. 15 10 5 0. 5. 10. 15. 20. 25. 30. 35. 40. 5. 20. n. individuals. n. individuals. 25. 0 5. April 06. 15 10 5 0 5. n. individuals. 20. 15. 5. 20 15. 15. 0. 40. n. individuals. n. individuals. 5. 10. 20. 5. 20. September 05. 5. 0. 40. n. individuals. n. individuals. 10. 10. 5. 0 5. June 06. 15. 0. 40. 20. n. individuals. n. individuals. 5. 20. 10. 15. 20. 25. 30. 35. 40. 10. 15. 20. 25. 30. 35. 40. 20. June 07. 15 10 5 0 5. 10. 15. 20. 25. 30. 35. 40. 20. Length (mm). May 06. 15 10 5 0 5. 10. 15. 20. 25. 30. 35. 40. Figure 2. Size-frequency histograms of Microcosmus squamiger for each sampled month.. 45.
(54) 50. 40. 30. % individuals. 25 30. 20. 20. Temperature ºC. < 7 mm >20 mm Temperature. 10 15. 0 10 J A S O N D J F M A M J J A S O N D J F M A M J. Figure 3. Mean percentage of Microcosmus squamiger individuals larger than 20 mm and smaller than 7 mm, in relation to water temperature over the study period.. The reproductive cycle of M. squamiger showed a clear annual pattern, with an important peak of the gonad index in summer and minimum values in winter and spring (Fig. 4a). In general, maximum values in summer were followed by an abrupt decrease. Interannual differences were also found, as in 2006 the cycle was clearly advanced with respect to 2005. The cycle of 2007 closely mirrored that of 2006. Interannual differences may be related to differences in temperature. A cross-correlation analysis of gonad index vs temperature (Fig. 8b) shows a typical seasonal pattern with high similarity in the time course of both variables, with maximal correlation values at time lags close to 0 and negative values at time lags 5-6 months apart.. 46.
(55) 0.30 30. 25. 0.20. 0.15. 20. 0.10. Temperature (ºC). 0.25. Gonad index. A. Gonad index Temperature. 15 0.05. J A S O N D J F M A M J J A S O N D J F MBA M J 5. 50 4 40 3 30. Male state. Mean oocyte diameter (μm). 60. 2. 20. 1. 10. 0 J A S O N D J F M A M J J A S O N D J F M A M J. Figure 4. Gonad cycle of Microcosmus squamiger during the study period. (a) Mean gonad index and water temperature. (b) Mean male maturity state and mean oocyte diameter over time.. The examination of the gonad histology generally showed a central core of oocytes grouped around the oviducts, with a periphery of male follicles. The condition of the male and female gonads confirmed the time course of the reproductive cycle previously found. Both the mean oocyte diameter and the maturity state of testes (Fig. 4b) indicated a reproductive event at the end of summer, followed by a non-mature state during winter and a gradual built-up of the gonads during spring. Interestingly, after the. 47.
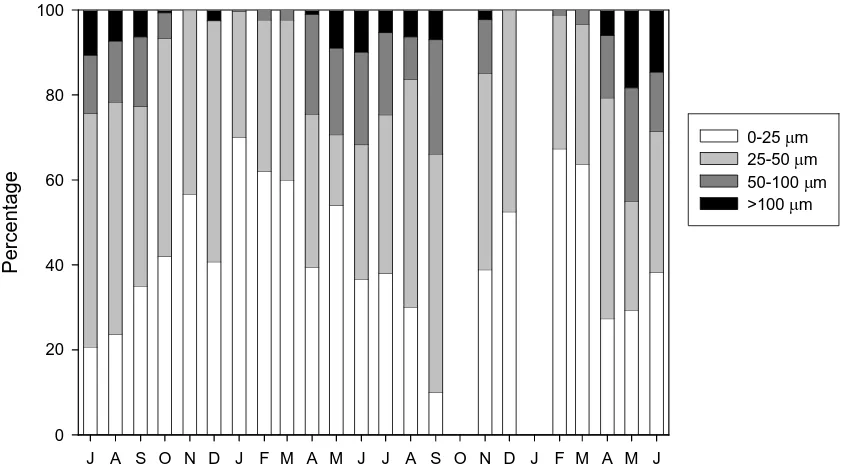
(56) abrupt gonad index decrease of July-August 2006, both oocyte size and the maturity state of testes pointed out that gonads still remained mature until October, which suggests that after an initial spawning episode, additional gamete release events could occur over several months. The percent of oocyte size-categories graph (Fig. 5) showed that oocytes of the larger size classes (> 50 μm) appeared in spring and were shed by the end of summer. Residual oocytes of the larger classes could be observed in December 2005 and November 2006, but generally during wintertime most of the oocytes belonged to the smallest size-classes (0-25 and 25-50 μm).. 100. Percentage. 80 0-25 μm 25-50 μm 50-100 μm >100 μm. 60. 40. 20. 0 J A S O N D J F M A M J J A S O N D J F M A M J. Figure 5. Percentage of each oocyte size-class of Microcosmus squamiger over the study period.. The measurements of length and weight of the animals collected to test the effect of depth on M. squamiger populations showed non-significant differences between. 48.
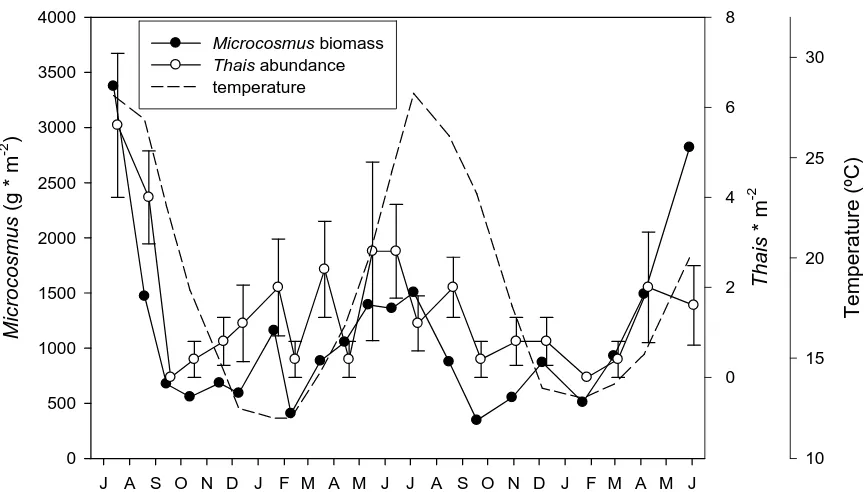
(57) depths in both variables (1-way ANOVA, F2,72 = 0.217, P = 0.806, for length; and F2,72 = 0.026, P = 0.974, for wet weight). The surveys of the predator T. haemastoma showed a similar trend of the mean density of the gastropod and the available biomass of M. squamiger (calculated as the product of density by wet weight, Fig. 6). Accordingly, the cross-correlation between both variables (Fig. 8c) showed a highly significant (Pearson’s r=0.737, p<0.001) value at time lag 0, and the second largest correlation coefficient was between abundance of T. haemastoma and M. squamiger biomass in the preceding month (time lag -1).. 8. 4000 3500. Microcosmus biomass Thais abundance temperature. 30. 4. 2000 2. 1500 1000. 20. 15 0. 500 0. 10 J A S O N D J F M A M J J A S O N D J F M A M J. Figure 6. Mean biomass of Microcosmus squamiger, number of Thais haemastoma and water temperature over the study period. Vertical bars denote standard error.. A high number of scraped plots (ca. 70%) could be located again and re-scraped in March 2007. These showed no new M. squamiger colonizers in plots sampled after July 2006. There was a trend of increasing number of individuals in older plots (Fig. 7),. 49. Temperature (ºC). 25 2500. Thais * m-2. Microcosmus (g * m-2). 6 3000.
(58) although the values generally remained much lower than the mean values of abundance found in the initial scrapings. Only in a plot corresponding to the scrapping of August 2005 did the recolonization value rise to almost 90% of the original abundance. The size of the individuals (presented as length in Fig. 7) generally followed an increasing trend as we move backwards in the timing of the first scraping of the plots. In spite of this evidence of recolonization, in the settlement plates deployed monthly we could not find any M. squamiger recruits. The plates were colonised by a variety of other organisms (mainly algae), but the only ascidian present were a few specimens of Botryllus schlosseri.. 16. 1200 density length. 14. 10 600 8 400 6. M ar 06 Ap r0 6 M ay 06 Ju n 06. Fe b. Ja n. D ec. 05 Se p. Au g. 06. 2 06. 0 05. 4. O ct 05. 200. Figure 7. Re-scrapings of the sampled plots in March 2007. Mean density of Microcosmus squamiger and mean length of the individuals for each month. Vertical bars denote standard error.. 50. Length (mm). 12 800. 05. Individuals * m. -2. 1000.
(59) 1.0 (a). 0.5 0.0 Correlation coefficient. -0.5 (b). 0.5 0.0 -0.5 (c). 0.5 0.0 -0.5 -1.0 -15. -10. -5 0 5 Time lag (months). 10. 15. Figure 8. Results of the cross-correlation analyses. The curved lines represent the 95% confidence interval of the correlation coefficient. (a) Microcosmus squamiger abundance vs. temperature. (b) M. squamiger gonad index vs. temperature. C. Thais haemastoma abundance vs. M. squamiger biomass.. 51.
Figure


+7


Documento similar
It is important to note that CLIL not a new method; rather it is the fusion of the teaching of content from the curriculum with the teaching of a non-native language, as well as
Two methods have been presented and empirically validated to extract a deterministic UFSA from a trained recurrent neural network (RNN), that are applicable respectively to the cases
No obstante, como esta enfermedad afecta a cada persona de manera diferente, no todas las opciones de cuidado y tratamiento pueden ser apropiadas para cada individuo.. La forma
– Spherical Mexican hat wavelet on the sphere software (developed by the Observational Cosmology and Instrumentation Group at
Penelitian ini bertujuan untuk mendapatkan asal daerah bahan baku yang terbaik untuk pembuatan sirup gula kelapa dan untuk mendapatkan konsentrasi arang aktif yang
In this present work, inspired of the over and under projection with a fixed ratio methods, proposed by Agmon, we consider a class of extended relaxation methods depending on
The Dwellers in the Garden of Allah 109... The Dwellers in the Garden of Allah
In addition, it was also found that RecN and RecA proteins were able to modulate the activities of PNPase, through the stimulation of polymerase or
