Essays on International Trade and Economic
Geography
Andrei Victor Potlogea
TESI DOCTORAL UPF / ANY 2016
DIRECTOR DE LA TESI
Acknowledgements
Like any big project, the completion of this thesis would not have been possible without the advice and support of many others. Here I want to take the opportunity to thank all of those who have helped me along the journey of PhD research, making it both pro-ductive and enjoyable.
First of all, I would like to thank my advisors Giacomo Ponzetto and Vasco Car-valho. They have not only provided me with important insights and taught me more about economics than anyone else, but through a finely tuned combination of emotional support, honest feedback and timely pressure have guided me past my early (and late) struggles.
I owe special thanks to Gino Gancia and Jaume Ventura. Their ability to separate the essential from the superfluous and their constant focus on the big picture has taught me a great deal. Special thanks are also due to Juanjo Ganuza, for allowing me to par-ticipate in his research project on “Information, Markets and Social Decisionmaking: Theory and Applications”.
Among the many other professors at UPF that have provided me with important in-sights or sound advice at various stages during my studies, I would like to single out Julian di Giovanni, Fernando Broner, Fabrizio Germano, Larbi Alaoui, Albrecht Glitz, Alessandro Tarozzi, Kurt Schmidheiny, Filippo Ippolito, Isaac Baley, Manuel Garcia-Santana, Sandro Shelegia and Massimo Motta.
I would like to also thank Marta Araque and Laura Agusti, who have been instru-mental in helping me deal with the administrative complexities of PhD student life, particularly during the job market and my long research stays at Cambridge and LSE.
Among my peers, a first special thanks goes out to Stephan Maurer. Stephan has not only co-authored the third chapter of this thesis, but has been a constant source of sup-port throughout the ups and downs of PhD life during the past five years. A big thank you is also due for Wenya Cheng, my collaborator on the second chapter of this thesis.
I also want to express my gratitude towards fellow PhD students at UPF, many of whom became good friends: Tom, Tanya, Oriol, Ciccio, Bruno, Stefan, Hrvoje, Thomas, Federica, Fernando, Andrea, Mrdjan, Jagdish, Emma, Gene, Felipe, Miguel Karlo and Chris. A special mention goes to Michael, who will be missed by all of us.
Abstract
This thesis provides an investigation of the effects of trade, technology and natural resource shocks on local economies and local labor markets. In the first chapter, I explore theoretically the impact of recent improvements in communication technology on the configuration of eco-nomic geography at multiple levels of spatial disaggregation. I show that a simple model of the organization of global supply chains can rationalize several salient stylized facts concerning the recent evolution of the spatial economy. In the second chapter, I empirically investigate the impact of changes in US trade policy triggered by China’s WTO accession on Chinese local economies. I find that improvements in US market access had an important impact on local economic outcomes and on the spatial configuration of economic activity within China. In the third chapter I investigate the impact of large oilfield discoveries on local labor markets, with a particular focus on the effects on the economic prospects of women. I find that while large mineral endowments do not slow the process of women joining the labor force, they do lead to a higher gender wage gap.
Resumen
Preface
This doctoral thesis consists of three essays at the intersection of international trade, economic geography, urban economics and labor economics. The connecting thread that runs between these three essays is the focus on the analysis of the impact of various economic shocks (trade, technology and the discovery of natural resources) on local economies and local labor markets.
In the first chapter, I develop a model that explains several of the recent shifts in the location of economic activity, both across and within countries, as consequences of globalization brought about by technical progress. In the model, declining costs of long-distance communication induce a reallocation of economic activity across space. This process accounts for three key trends in the data. First, cross-country inequality has declined as many developing countries have grown rapidly. Second, economic ge-ography has instead grown more unequal within countries. Third, rising intra-national inequality reflects the disproportionate success of skilled cities. My model explains the faster population and output growth of skilled cities, as well as their tendency to augment their initial skill advantage. Consistent with the evidence, my theory features a non-monotonic path of urban growth in developed countries. The model predicts a future shift in worldwide urban hierarchies as some developing-world cities overtake unskilled cities in industrialized countries along global supply chains.
benefit from trade liberalization. In particular, our evidence suggests that increased in-vestment demand caused by trade liberalization drives financial sector growth. We find little effect of trade liberalization on local wages. Alongside our results on population and employment, this indicates that local labor supply elasticities are high in our set-ting. Our findings can be explained by a Lewis model of urbanization that combines geographic mobility with an abundant reserve of labor.
Contents
Index of figures xv
Index of tables xix
1 GLOBALIZATION AND THE SKILLED CITY 1
1.1 Introduction . . . 1
1.2 Reviewing the Facts . . . 6
1.3 Model . . . 9
1.3.1 Basic Setup . . . 9
1.3.2 Equilibrium Definitions . . . 14
1.3.3 Key Assumptions and Discussion . . . 15
1.3.4 Spatial Equilibrium and Main Results . . . 16
1.4 A History of the Location of Economic Activity . . . 23
1.4.1 The Past and Present . . . 24
1.4.2 The Future . . . 31
1.5 Conclusion . . . 34
1.6 Appendix A: Key Assumptions . . . 36
1.6.1 Preliminaries and Clarifications . . . 36
1.6.2 Formal Statements of Assumptions . . . 37
1.7 Appendix B: Proofs . . . 40
1.7.1 Preliminaries: Solving the Model . . . 40
1.7.2 Proof of Proposition1 . . . 43
1.7.3 Comparative statics of thresholdTmax . . . 51
1.7.4 Proof of Propositions2to6 . . . 53
1.9 Appendix D: Figures . . . 88
2 TRADE LIBERALIZATION AND ECONOMIC DEVELOPMENT: EVI-DENCE FROM CHINA’S WTO ACCESSION 93 2.1 Introduction . . . 93
2.2 Related Literature . . . 100
2.3 Methodology and Data . . . 102
2.3.1 Theoretical Discussion . . . 103
2.3.2 Measuring Local Exposure to Trade Liberalization . . . 104
2.3.2.1 WTO Accession, US Trade Policy and Product-Level Trade Liberalization . . . 105
2.3.2.2 Industry Level and City-Level Trade Liberalization . 108 2.3.3 Geographic Measurement . . . 110
2.3.4 Estimation . . . 113
2.3.5 Data Sources . . . 115
2.4 WTO Accession and Local Growth . . . 116
2.4.1 Main Results: Population, Output, Employment and Wages . . 116
2.4.2 Investment, Exports and FDI . . . 120
2.4.3 The Structure of Local Economies . . . 123
2.5 Trade Liberalization and Local Spillovers . . . 126
2.5.1 Local Spillovers within the Manufacturing (Tradable) Sector . 127 2.5.2 Local Spillovers to the Non-tradable (Services) Sector . . . 136
2.5.3 Local Spillovers and Financial Sector Growth . . . 138
2.6 Migration and Local Labor Supply Elasticities . . . 140
2.7 Heterogeneous Effects . . . 144
2.8 Robustness and Alternative Specifications . . . 146
2.8.1 Robustness Checks . . . 146
2.8.1.1 Dropping Provincial Level Cities . . . 146
2.8.1.2 Controlling for the Initial Share of Employment in SOEs . . . 147
2.8.1.3 Further Controls for Initial Sectoral Composition . . 148
2.8.1.5 Controlling for changes in Non Tariff Barriers - The
Multi-Fiber Agreement (MFA) . . . 149
2.8.2 Alternative Measure of Local Exposure to the Reform . . . 150
2.8.3 Cross-Checks Using Census Data . . . 152
2.9 Concluding Remarks . . . 154
2.10 Appendix A - Balacedness Analysis . . . 157
2.11 Appendix B - Local Spillovers . . . 158
2.11.1 Detailed Specifications - Spillovers Within Manufacturing . . . 158
2.11.2 Local Spillovers to the Service Sector . . . 160
2.12 Appendix C - Migration Specifications . . . 162
2.12.1 Checks for Within-Prefecture Migration . . . 162
2.12.2 Checks for Migration Across Prefectures . . . 163
2.12.3 Reallocation Check: Investment . . . 164
2.13 Appendix D - Heterogeneous Effects . . . 165
2.14 Appendix E - Robustness Checks and Alternative Specifications . . . . 171
2.14.1 Robustness Checks . . . 171
2.14.2 Alternative Specifications . . . 175
2.14.3 Census Cross-Checks . . . 178
2.15 Appendix F - A Simple Model . . . 179
2.16 Appendix G - Data and Variable Construction . . . 181
2.16.1 China Outcomes and Controls . . . 181
2.16.2 Trade Variables . . . 182
2.16.3 Local Spillovers . . . 183
2.16.4 List of Variables . . . 184
3 FUELING THE GENDER GAP? OIL AND WOMEN’S LABOR AND MARRIAGE MARKET OUTCOMES 189 3.1 Introduction . . . 189
3.2 The Impact of Oil Wealth on Women’s Labor Market Outcomes . . . . 194
3.3 Data and Empirical Strategy . . . 197
3.4 Results . . . 202
3.5 Robustness Checks . . . 209
3.7 Appendix . . . 224 3.7.1 Further Tables and Robustness Checks . . . 224 3.7.2 Figures . . . 234
List of Figures
1.1 World Before Communication-induced Integration . . . 19
1.2 First Stage of Globalization . . . 25
1.3 Second Stage of Globalization . . . 28
1.4 Third Stage of Globalization . . . 29
1.5 Fourth Stage of Globalization - Urban Overtaking? . . . 32
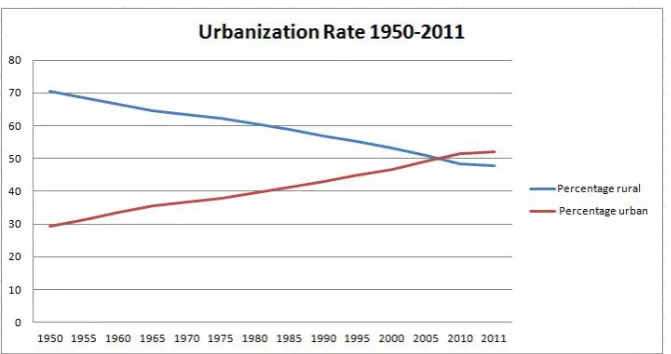
1.6 Evolution of Worldwide Urbanization 1950-2011 . . . 88
1.7 Evolution of Urbanization in Regions of Various Levels of Develop-ment 1950-2010 . . . 89
1.8 Skills and City Growth . . . 89
1.9 Skill Divergence Across US MSAs . . . 90
1.10 Structure of Production . . . 90
1.11 Secular Decline in Communication Costs . . . 91
1.12 Investment Cost and Rates for Three Minute International Calls . . . . 91
2.1 The Distribution of Product-level Tariff Gaps . . . 108
2.2 Improvements in Market Access Across Prefectures . . . 111
2.3 Administrative Organization of the Prefecture of Wuhan . . . 113
3.1 Number of Large Oil Fields Discovered, by Decade . . . 198
3.2 Map of Oil Discoveries1900 . . . 234
3.3 Map of Oil Discoveries1910 . . . 235
3.4 Map of Oil Discoveries1920 . . . 236
3.5 Map of Oil Discoveries1930 . . . 237
List of Tables
2.1 Baseline Outcomes, No Controls . . . 117
2.2 Placebo Test for Pre-trends in Outcome Variables . . . 118
2.3 Baseline Outcomes with Controls . . . 119
2.4 Investment . . . 121
2.5 FDI Contracts and Foreign Capital . . . 122
2.6 Export Activity . . . 124
2.7 Structure of Employment . . . 125
2.8 Prefecture-Industry Effects of Industry-Level Trade Liberalization . . 128
2.9 Spillovers at the Prefecture - Industry Level . . . 130
2.10 Alternative Spillover Channels . . . 135
2.11 Spillovers to the Service Sector via Local Demand Linkages . . . 138
2.A.1 Correlations Between Initial Characteristics and City-Level Trade Lib-eralization . . . 157
2.B.1 Detailed Spillover Specifications, Prefecture - Industry Regressions, Controls . . . 158
2.B.2 Detailed Spillover Specifications, Prefecture - Industry Regressions, Controls, Mean Reversion Terms . . . 159
2.B.3 Detailed Analysis of the Service Sector . . . 160
2.B.4 Borrowing and Financial Sector Growth . . . 161
2.C.1 Checks for Within Prefecture Migration & Reallocation, Prefecture-Level Regressions, Controls . . . 162
2.C.2 Migration and Reallocation Regressions,Cross-Prefecture Specifica-tions, Controls . . . 163
2.D.2 Heterogeneous Effects - Distance to Nearest Port, Prefecture Level, Controls . . . 166 2.D.3 Heterogeneous Effects - Initial SOE Share of Employment, City Level,
Controls . . . 167 2.D.4 Heterogeneous Effects - Initial SOE Share of Employment, Prefecture
Level, Controls . . . 168 2.D.5 Heterogeneous Effects - Initial SEZ Status, City Level, Controls . . . 169 2.D.6 Heterogeneous Effects - Initial SEZ Status, Prefecture Level, Controls 170 2.E.1 Robustness 1: City-Level Main Regressions, No Provincial Cities,
Controls . . . 171 2.E.2 Robustness Check2- Controlling for the Initial Share of Employment
in SOEs . . . 172 2.E.3 Robustness Check3- Further Controls for Initial Sectoral Composition 173 2.E.4 Robustness Check4- IV Strategy to Account for Variation in the Size
of the Non-tradable Sector . . . 173 2.E.5 Robustness Check5- MFA Robustness . . . 174 2.E.6 Alternative Specification: City-Level Main Regressions, Controls . . . 175 2.E.7 Alternative Specification: City-Level Main Regressions, Standard
Con-trols and Sectoral ConCon-trols . . . 176 2.E.8 Alternative Specification: City-Level Structure of Employment
Re-gressions, Controls . . . 177 2.E.9 Alternative Specification: Detailed Analysis of the Service Sector,
Controls . . . 177 2.E.10 Census Cross Checks, Prefecture Level . . . 178
3.1 Oil vs Non-Oil Counties in1900(Before the Discovery of Oil) . . . . 203 3.2 Impact of Oil Discoveries on Some Demographic Variables . . . 215 3.3 Impact of Oil Discoveries on Sectoral Composition of Employment . 215 3.4 The Impact of Having a Discovered Oil Field on the Labor Force
Par-ticipation Rate and Employment Rate, by Gender . . . 216 3.5 The Impact of Having a Discovered Oil Field on Measures of Labor
3.6 Impact of Oil Discoveries on the Sectoral Composition of
Employ-ment, Women . . . 217
3.7 Impact of Oil Discoveries on the Sectoral Composition of Employ-ment, Men . . . 217
3.8 The Impact of Having a Discovered Oil Field on Wages, by Gender . . 218
3.9 Impact of Having a Discovered Oil Field on Women’s Marriage Mar-ket Outcomes . . . 219
3.10 Leads and Lags Analysis, First Part . . . 220
3.11 Leads and Lags Analysis, Second Part . . . 221
3.12 Results When Dropping All Counties Without an Oil Deposit, part 1 . 222 3.13 Results When Dropping All Counties Without an Oil Deposit, part 2 . 222 3.14 First Cross-Sectional Robustness Check, Adding a Dummy for Not Yet Discovered Oil Field . . . 223
3.15 Cross-Sectional Placebo Test . . . 223
3.A.1 Impact of Discovered Oil Fields on Labor Force Participation and Sec-toral Composition, 1940 Cross-Section Only . . . 226
3.A.2 Further Leads and Lags Regressions, Part 1 . . . 227
3.A.3 Further Leads and Lags Regressions, Part 2 . . . 228
3.A.4 Further Regressions When Dropping All Counties Without an Oil De-posit, Part 1 . . . 228
3.A.5 Further Regressions When Dropping All Counties Without an Oil De-posit, Part 2 . . . 229
3.A.6 Exploiting Oil Field Size, Part 1 . . . 230
3.A.7 Exploiting Oil Field Size, Part 2 . . . 231
3.A.8 Exploiting Oil Field Size, Part 3 . . . 232
Chapter 1
GLOBALIZATION AND THE
SKILLED CITY
1.1
Introduction
The last five decades have brought about a substantial reconfiguration of economic ge-ography both across and within countries. Rapid (and often export-led) growth in a set of developing countries, particularly China and India, has led to a more dispersed cross-country economic geography. Furthermore, this process of economic catch-up has been accompanied by the rapid advance of urbanization, which has seen many countries sus-tain large urban populations at lower levels of income than was typical in the past. In contrast to the international rebalancing of the world economy, within country economic geography has grown more unequal. In particular, many nations witnessed remarkable levels of heterogeneity in urban success, with some cities experiencing rapid growth while others suffered stagnation or even decline.
The divergence in urban fortunes mentioned above can be attributed in no small part to the emergence of a strong association between human capital and urban success1. Mounting evidence suggests that “skilled”2 cities have tended to outperform their skill
1The relationship between human capital and local productivity and economic success is explored at
length in Moretti (2004,2013).
2As is standard in the literature, here and elsewhere I use the concept of “skilled” cities to mean
scarce counterparts on a battery of measures of urban success (Glaeser 1994; Glaeser, Scheinkman and Shleifer 1995; Simon and Nardinelli 1996,2002; Black and Henderson 1999; Glaeser and Saiz 2004; Anderson and Ge 2004; Shapiro 2006; Da Mata et al 2007; De la Garza 2008; Liao2010). Moreover, evidence from a series of countries indicates that skilled locations have tended to augment their skill advantage in recent decades, a phenomenon that has been described as skill polarization across space. Importantly, these regularities linking human capital and urban success have been documented for rich and poor nations alike (Anderson and Ge2004; Berry and Glaeser 2005; Da Mata et al.2007; Queiroz and Golgher2008; Poelhekke 2013).
What has caused the reconfiguration of economic geography across and within coun-tries described above? I develop a model that explains these phenomena as conse-quences of globalization brought about by technological progress. The model depicts a global economy in which improvements in communication technology allow skill in-tensive manufacturing activities to become spatially separated from the management function. This development leads to the reorganization of global supply chains, with advanced manufacturing activities gradually leaving developed nations to take advan-tage of lower factor costs in developing countries.3 In turn this leads to developing nations capturing an increasing share of global supply chains and experiencing conver-gence with developed countries.
Moreover, this reallocation of global supply chains brought about by improvements in communication has asymmetric effects within countries. As the advanced manufac-turing activities relocating to developing countries require access to good infrastructure and skilled workers that are scarce in these nations, they first tend to locate in the most advanced (and skilled) cities of these countries. This, in turn, leads these locations to experience faster growth than the rest of their countries. In contrast, in developed coun-tries all cities are hurt by the loss of skill intensive manufacturing activities. However, the most skilled rich country locations, that have a large share of their employment dedicated to the production of sophisticated management services in which developed countries retain an unassailable advantage, benefit from a compensatory effect of
glob-3The main mechanism highlighted by the model places this chapter in the wider literature on
off-shoring (McLaren2000; Grossman and Helpman2002,2004,2005; Antras2003; Antras and Helpman
alization. This is because communication improvements lead to an increase in the ef-ficiency and scale of the world economy, meaning these skilled locations can sell their management services to a larger global market. As this compensating force of global-ization only benefits skilled locations in rich nations, improvements in communication will also lead to economic divergence across space in these countries4.
Finally, the reduction of communication costs leads to urbanization and structural transformation5 As communication costs decline and increasingly advanced stages of manufacturing take place in lower cost locations, the relative price or urban goods de-clines. Under the assumption that these goods are subject to elastic demand, their share of overall expenditure and employment increases, leading to an increase in global ur-banization.
In the model, the mechanism outlined above is captured in a parsimonious set-up. International geography consists of two countries, North (N) and South (S), that are characterized by internationally immobile labor endowments and Ricardian productiv-ity advantages. Workers are homogenous, and given the long-run interpretation of the model, skill acquisition is endogenous6. Intra-national geography consists of two cities and a non-urban hinterland. Labor is freely mobile within countries. Cities are endowed with immobile land and differ in their local (Ricardian) productivity. These differences in productivity across cities can be interpreted as differences in infrastructure, which re-flects both history determined infrastructure investments as well as other “first-nature” forces (e.g. natural advantage). To reflect the relative scarcity of infrastructure in parts of the developing world, I assume that all Northern cities and one of the Southern cities benefit from a high endowment of local infrastructure while a lagging Southern city only has access to a low endowment of local infrastructure.
4By relating the elimination of spatial frictions to trade to the evolution of within country economic
geography this chapter contributes to the strand of literature analyzing the impact of international trade integration on intra-country economic geography (Krugman and Livas Elizondo 1996; Paluzie2001; Monfort and Nicolini2001; Behrens, Gaigne, Ottaviano and Thisse2006a,2006b,2007,2009)
5The structural transformation mechanism embedded in my model is conceptually closest to studies
analyzing urbanization and structural transformation in the context of open economies (Glaeser 2013, Fajgelbaum and Redding2014, Jedwab2014). This feature of the model also places the current chapter in the wider literatures on urbanization (Kim2000; Kim and Margo2004; Michaels, Redding and Rauch
2011, 2012,2013) and structural transformation (Baumol 1967; Ngai and Pissarides2007; Rogerson
2008; Gollin, Parente and Rogerson2002, Matsuyama1992).
6For another study analyzing endogenous skill acquisition in the context of its implications for
Two commodities are produced in the world economy: a traditional good produced in the hinterland and an urban good. The urban sector has a supply chain that includes multiple stages of production (or tasks): unskilled manufacturing, skilled manufactur-ing and the management function (or management services). These tasks have a natural ranking in terms of their skill intensity, with management services being the most skill intensive activity in the world economy. Management services can only be produced in the North, while all stages of production of the urban good critically require access to urban infrastructure and as a result can only take place in cities.
As the focus of the theory developed in this chapter is the paramount role of human capital in the modern economy, I posit that skill intensity explains the whole bundle of characteristics of each stage of production. First, skill-intensive activities benefit dis-proportionately from the local availability of exogenous infrastructure. This is because the productivity of skilled workers hinges on the local availability of infrastructure to a greater extent than that of unskilled workers.7 Second, the most skill intensive activity, management services, is subject to localization economies that encourage its clustering in only one Northern city. This location therefore naturally becomes the North’s skilled city.8
Finally, the management services sector is key in shaping the configuration of the global value chain and determining the locations of all other activities. This is due to two main features of this sector. One is that management services do not enter the production of the urban good directly but they are inputs in the production of skilled manufacturing. The other is that it is the only activity that is subject to spatial fric-tions represented by international communication costs (i.e. management services can be costlessly shipped within countries, but are costly to deliver across countries). All other commodities in the world economy are posited to be freely tradable across and within countries. This assumption concerning the management input aims to capture the recent decline in the importance of physical transportation costs for goods and ser-vices coupled with the continued relevance of costs affecting the transportation of ideas
7This assumption of complementarity between skill and locational attractiveness is also made by
Sat-tinger (1975) and Davis and Dingel (2014). It is equivalent to assuming that overall worker productivity is log supermodular in skill and access to local infrastructure.
8The assumption that management services are subject to localization economies is a simplified way
and people (Glaeser and Kohlhase2004). In turn, the persistence of substantial costs for the transfer of knowledge and ideas is more consequential for interactive, skill and idea intensive activities (Glaeser and Ponzetto2010; Michaels, Rauch, Redding2013).
With the set-up above I show that the model can qualitatively match the key styl-ized facts that characterize the evolution of global economic geography in the last four decades. In an initial state characterized by the presence of prohibitive international communication costs, the model reproduces the configuration of economic geography that prevailed at the middle of the twentieth century. As management services can only be produced in the North and the skilled manufacturing stage requires management ser-vices as an input, the presence of high communication costs that affect the international delivery of management services makes the completion of skilled manufacturing uneco-nomical in the South. As a result, Northern cities capture the management function and the skilled manufacturing sections of global value chains while Southern cities special-ize in unskilled manufacturing.
As international communication costs gradually decline, the South becomes com-petitive in the production of skilled manufacturing. In particular, the advanced city of the South, that features a high endowment of infrastructure, becomes an attractive loca-tion for the producloca-tion of advanced manufacturing and endogenously takes on the role of the skilled city of the South. Moreover, as the skilled manufacturing that gradually relocates from the North to the South is more skill-intensive than the previous activity mix of the South and less skill intensive than the previous activity mix of the North, im-provements in international communication lead to an increase in the relative demand for skill in both countries.
intensive activities from these locations. As a result, these locations tend to dispropor-tionately attract skilled workers, leading to an intra-national trend of skill polarization across cities.
Aside from being able to match the four stylized facts motivating the present chap-ter, the model is able to rationalize some of the finer features of the observed patterns of urban growth. In particular, it can account for the non-monotonic evolution of cities in many developed countries in the past decades. In these advanced nations, a broad cross-section of cities, both skilled and unskilled, experienced urban stagnation and even decline for a prolonged period, spanning the years1950to1980(see Glaeser and Ponzetto2010). However, starting from the early1980s a pattern of divergent recovery has emerged, with many skilled cities experiencing urban resurgence, while skill scarce locations have lagged behind and continued to display poor performance across a bat-tery of measures of urban success.
The model can also be used to cast an eye at the future and study the implications of continued improvements in communication technologies. If the labor cost differential between countries is sufficiently high, and communication costs are reduced below a certain threshold, the model predicts that we may observe “overtaking” along the global supply chain, with the skilled location of the South obtaining a more skill intensive in-dustrial composition than the unskilled city of the North, and also surpassing it in terms of land valuations. This novel theoretical result may already be relevant for a set of particularly successful developing world cities, and it also highlights a mechanism that can help us account for the recent phenomenon of “reshoring”.
The rest of this chapter is structured as follows. In the next section I briefly review the evidence supporting the stylized facts that motivate the current study. Section 1.3 outlines the model and presents the main results. After discussing the model, I dedicate section 1.4 to presenting an account of the recent “History of the Location of Economic Activity” seen through the lens of the model. Section 1.5 concludes this chapter.
1.2
Reviewing the Facts
ge-ography has experienced some rebalancing, with a select group of developing countries growing rapidly and catching up with industrialized countries; (2) world urbanization has increased sharply, being mainly driven by unprecedented rates of urbanization in the developing world; (3) within countries, cities with higher endowments of human capital, have performed better along a battery of measures of urban success, including population growth, employment growth, income growth and real estate price appreci-ation; (4) also within countries, a phenomenon of skill polarization across space has been documented, with skilled cities augmenting their skill advantage over their rela-tively skill scarce counterparts. In this section, I review the supporting evidence for these four stylized facts.
The recent cross-country rebalancing of the world economy, which has seen a num-ber of developing countries close the income gap that separates them from industrial-ized nations, is perhaps the most salient of the stylindustrial-ized facts mentioned above. A simple reading of international GDP statistics serves as a compelling illustration of this devel-opment. As recently as 1992, the advanced group of industrialized economies within the G20 represented almost 60% of world GDP at PPP, whilst the group of emerging economies within the same club represented 20% of world GDP. Projections indicate that in 2014, the group of advanced economies within the G20 will instead account for only 46%of world GDP at PPP, while the share of the G20 emerging economies will have increased to36%9. This development is driven by rapid growth in a set of large de-veloping countries (primarily China and India, but also Brazil, Indonesia, South Africa, Turkey and Vietnam) which has also led to a reduction of global income inequality in spite of increasing inequality within nations and disappointing growth performance in other poor countries (Sala-i-Martin 2006).
The advance of urbanization has also been extremely rapid and consequential, and has even led to concerns about sustainability and about the emergence of “excessive” concentrations of population. If in1950only29.4%of the world’s population lived in cities, by 2010 a majority of the world’s population (51.6%) resided in urban areas. The shift towards urban living was particularly strong in less developed countries, which increased their urbanization rate from17.6% to 46%over the same period. The scale of this phenomenon has led some analysts to the conclusion that some of the mechanics of the urbanization process have changed, as many nations are now able to sustain high
levels of urbanization at lower levels of income than was typical in the past (Glaeser 2013). This view is also supported by the weakening of the traditional links between urbanization on one hand and industrialization (Gollin, Jedwab and Vollrath 2015) and growth (Jedwab and Vollrath 2015) on the other. Nevertheless, urbanization also contin-ued in the world’s advanced regions, where the proportion of population living in cities increased from54.5%to77.5% over the last half a century (Figures 1.6 and 1.7 depict the evolution of urbanization over this period for the world as a whole and for regions at various stages of development).
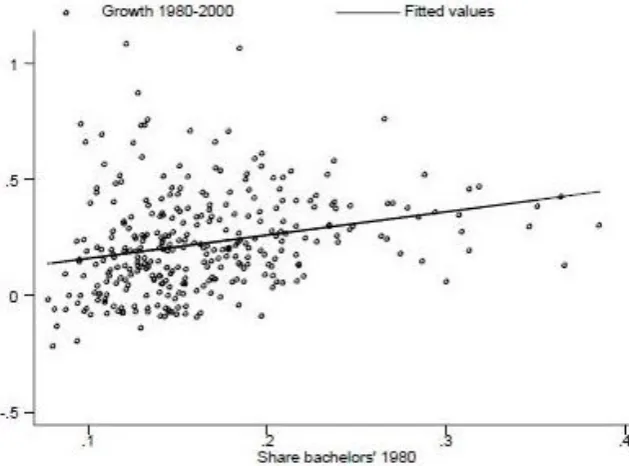
Against this backdrop of rapid urbanization, the last five decades have also witnessed substantial heterogeneity in urban success10. Moreover, as our third motivating fact re-veals, local human capital endowments have been a strong predictor of urban growth. Analyzing a large sample of US metropolitan statistical areas (MSAs) over the period
1980 to 2000, Glaeser and Saiz (2004) find that a 1 percentage point increase in the share of a city’s adult population with a bachelor’s degree is associated with an increase in the decadal population growth rate by about half of one percent (their main finding is summarized in Figure 1.8). In a similar study, Shapiro (2006) finds that over the 1940 to 1990 period a 10% increase in a metropolitan area’s concentration of college edu-cated residents was associated with a0.8%increase in subsequent employment growth. Glaeser, Ponzetto and Tobio (2012) also confirm the link between skills and regional growth when analyzing US counties over the last two centuries, though the correlation does seem to break down for parts of the nineteenth century; while a long-run study of UK cities undertaken by Simon and Nardinelli (1996) does find a robust connec-tion between initial human capital endowments and subsequent city growth for a period spanning over a century. For the case of developing countries, perhaps the best known study linking human capital and city growth is the one by Da Mata et al. (2007) who, analyzing a large sample of Brazilian cities, find that a one year increase in the average number of years of schooling at the city level is associated with a5.6%increase in the decadal growth rate over the next three decades.11
10For example, for the case of the US, Glaeser and Ponzetto (2010) document that while San Francisco
and Chicago have added substantially to their populations in the period spanning 1970 to 2010 (17%and
13%respectively), in the same period Detroit has lost more than20%of its population.
11De La Garza (2008) and Poelhekke (2013) argue that many of the estimates of the effect of the skill
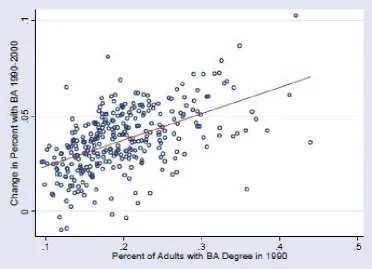
The final empirical regularity motivating this chapter concerns the fact that skilled cities have not only grown faster than their skill scarce counterparts, but they have also tended to maintain and augment their skill advantage over time, leading to a phe-nomenon of skill polarization (or skill sorting) across space. Analyzing the evolution of skill shares across a sample of more than three hundred US metropolitan areas over the period1990to2000, Berry and Glaeser (2005) find that a one percentage point increase in the proportion of city’s population holding a bachelors degree in 1990is associated with a 0.13 percentage point increase the growth of a city’s skill share over the next decade (their main finding is presented in Figure 1.9). Similar results have been found by Poelhekke (2013) for Germany and by Queiroz and Golgher (2008) for Brazil.
1.3
Model
1.3.1
Basic Setup
The model aims to describe the process through which the reduction of communication costs may lead to the reallocation of economic activity across and within countries, and account for the recent shifts in the configuration of economic geography. I set up a simple framework that allows me to study this process: a world economy featuring two countries, labeled North (N) and South (S). Each country contains two urban locations (or cities) and a hinterland or countryside. The cities are indexed N1and N2 in the North and S1and S2 in the South. Countries have fixed and exogenously given pop-ulations of identical workersLN andLS. As is standard in the international trade and
economic geography literature, I assume that workers are immobile internationally, but are costlessly mobile across locations within countries.
Workers have a unit endowment of time and have three career-location options. They can choose to live in the hinterland and work in the traditional sector; they can choose to work as an unskilled worker in a city, or they may spend a fraction e < 1 of their time acquiring education and then move to a city to work as skilled workers in the urban sector.
Urban locations in both countries are characterized by two location-specific char-acteristics: their endowments of urban land (denoted by Nl) and of local exogenous
infrastructure (denoted byAl, and taken to encompass all “first nature” forces).
North-ern urban locations are assumed to be ex-ante identical, each having an endowment of infrastructure ofAN1 =AN2 = A >1. By contrast, in the South there is an advanced
location, which I identify asS2and which has an endowment of infrastructure similar to that of Northern cities (i.e.AS2 =A >1) and a backward location exhibiting a lower
endowment of the exogenous infrastructure, AS1 = 1. For simplicity, I assume that
all urban locations, both Northern and Southern, are symmetric in their endowment of urban land, i.e. NS1 = NS2 =NN1 =NN2 =N, and that urban land at each location
is owned by absentee landowners.
A single final good is produced in the world economy, which I also designate as the numeraire. This commodity is assembled from two intermediates: a traditional (rural) good, indexed as good1, which is produced in the hinterlands, and a (composite) urban good, indexed as good2and produced in cities. The production technology of the final good is given by:
Q=hγq −1
1 + (1−γ)q
−1
2 i−1
(1.1) The elasticity of substitution between intermediates in the production of final output is assumed to be greater than unity (i.e. > 1). Moreover, the final good, its component intermediate goods, and all other commodities are produced under conditions of perfect competition.
Production of the traditional good employs unskilled workers via the linear produc-tion technology
q1c=ξ1cLc1 (1.2)
whereξ1cdenotes the productivity with which the traditional good is produced in
coun-tryc∈ {N, S}. Northern productivity in the traditional sector is higher than that of the South,ξ1N > ξ1S and the cost of producing a unit of the traditional good is determined
by the productivity adjusted cost of labor in each country.
by:
q2 =uθs1−θ (1.3)
where u denotes unskilled manufacturing, s denotes skilled manufacturing, and θ <
1 2.
12. In turn, the completion of the urban stages of production involves combining the primary factors of production, labor and urban land, via standard Cobb-Douglas technologies given by:
ucn = [AcnLcnu ] β
[Nucn]1−β (1.4)
scn =
(AρcnHucn)α(Mucn)1−αµh
(AcnLcnu ) β
(Nucn)1−βi1
−µ
(1.5)
wherecandnindex country and city respectively,Ldenotes unskilled labor,Hdenotes skilled labor,N denotes urban land whileα, β, µandρare parameters, withα, β, µ <1
andρ >1.
The production processes for the urban tasks outlined above contain three important embedded features. Firstly, as production stages along the production chain of the ur-ban intermediate become more complex and skill intensive they also become less land intensive. This assumption is standard in the urban economics literature and is in line with empirical observations. Glaeser and Ponzetto (2010) employ the same assumption while Wood and Berge (1994) and Owens and Wood (1995) note that “Primary produc-tion is usually both more land-intensive and less skill intensive than manufacturing”.
Secondly, infrastructure enters the production process in a way that makes its im-pact on output higher in the more skill-intensive production stage. A high endowment (A > 1units) of infrastructure in a particular location enhances the productivity of un-skilled workers in that city by a factor of A > 1, but augments productivity of skilled workers by a largerAρ(whereρ >1). As a consequence, cities with high endowments
of local infrastructure become particularly attractive for sectors that make intensive use of skilled labor.
Finally, the skilled manufacturing stage involved in the production of the urban
com-12The assumption that the more advanced, skill intensive stages of the production process of the urban
posite makes use of an additional factor of production, management services (labeled
M). This production input can be described as a skill-intensive stage of production that is introduced into the analysis to capture the idea that the operation of complex, multi-stage production processes requires coordination and planning services provided by the management function. Moreover, by introducing this management input only the production process of the skilled manufacturing (tasks) and not in that of unskilled manufacturing (tasku), I make the assumption that more sophisticated production stages require greater managerial attention than more basic production tasks. Intuitively, this implies that manufacturing workers in the apparel sector require less managerial inputs than product designers, while in the case of of the software industry programmers are assumed to require more productive contact with software developers and project man-agers than product testers.
The management input can only be produced in the more technologically advanced North. Its production involves the primary factors of production land and labor via the technology:
MN n =φ
MN n M
AρN nHMN nµ 0h
AN nLN nM
β
NMN n1−β
i1−µ0
(1.6)
The production process for the management input also possesses two features that merit to be highlighted. Management services keep to the monotonicity of sectors by skill intensity and land intensity. They are the most skill intensive and least land intensive activity in the world economy (i.e.µ0 > µ) and also have the highest density of employ-ment (Figure 1.10 offers a representation of the production chain of the final good).
property thatφ0(.)>013. This implies that a city’s productivity in delivering the man-agement input increases with that location’s worldwide market share in the manman-agement services sector.
Beyond location fundamentals and agglomeration economies, a final determinant of the configuration of economic geography in the model is given by communication and transportation costs. Both the final good and its component intermediates, the traditional good and the urban composite are costlessly tradable both within and across countries. Moreover, the outputs of the main stages of production of the urban good (unskilled taskuand skilled tasks) also face negligible transportation costs when delivered both nationally and internationally.
By contrast, management services are subject to negligible “communication” costs within countries, but to significant such costs when delivered across countries. Com-munication costs are assumed to take the standard iceberg form, withτ > 1units of the management services needing to be shipped from a location within country cfor one unit of such services to be delivered to a city within countryc0. These communication frictions should be given a broad interpretation, and taken to include any costs related to managing or providing advanced service inputs to a plant located remotely. They could include the opportunity cost of time incurred when middle or top managers have to visit faraway plants, or the incremental fees paid to management consultants or other skilled external service providers when they have to visit and analyze such plants.
I conclude this section with a description of the demand side of the economy. The preferences of the representative consumer (worker or landowner) are defined only over consumption of the final good, and are characterized by the utility function U(c)with
U0(c) > 0. Agents can thus choose their location, occupation and consumption such as to maximize utility. As agents are assumed to be ex-ante identical, and to face no mobility costs across locations within countries or sectors, any equilibrium will involve indifference across locations and occupations within countries.
13A framework employing urbanization economies generated by human capital would generate similar
1.3.2
Equilibrium Definitions
In the set-up outlined above, I proceed to define an equilibrium of the world economy as follows:
Definition 1. A (world) equilibrium is an allocation of workers across locations and sectorsLS1, HiS1, LiS1, HiS2, LSi2, L1N, HiN1, LNi 1, HiN2, LNi 2withi∈ {u, s, M}, a col-lection of factor prices wSS, wUS, wNS, wNU, rS1, rS2, rN1, rN2
and a collection of
com-modity prices priceshp1, pu, ps, pMisuch that:
• consumers are maximizing utility by their choice of location, occupation and con-sumption
• firms in all sectors - unskilled manufacturing (u), skilled manufacturing (s) and management services (M) - are maximizing profits by their choice of location and input mix
• labor markets clear at each location for each type of labor
• land markets clear at the city level
• markets for all intermediates and tasks, including management services clear at the level of the world economy.
The presence of external effects (localization economies) in the framework outlined in the previous section generates the possibility of existence of multiple equilibria14. In order to deal with the issues raised by multiple equilibria, I follow an approach that is standard in the economic geography literature. I define a concept of equilibrium stabil-ity, and focus my subsequent analysis on stable equilibria. Intuitively, in my framework a world equilibrium is defined as stable if it is robust to a locational deviation by a small but positive mass of management services providers. As in my model the management services activity is the only one that is subject to external economies, this sector repre-sents the only source of multiple equilibria. The definition of equilibrium stability that I employ in this study is provided more formally below:
14Multiple equilibria are a standard feature in modern economic geography models. For example,
Definition 2. A (world) equilibrium is stable if there is a tendency for the equilibrium to be restored following the locational deviation of management services producers that
represent a small but positive market share ∆x in the sector from one Northern city to the other. A deviation is considered “small” if the cumulative market share of the
deviating firms is not sufficient to reverse or create a tie in the ranking of Northern
locations by market share in the management services sector.
1.3.3
Key Assumptions and Discussion
In this section I delineate the scope of analysis undertaken in the remainder of the chap-ter. Starting from the basic framework outlined in section 1.3.1 above, I impose a series of additional parametric restrictions (Assumptions1to5below) that are meant to keep the analysis tractable, parsimonious and empirically relevant. The formal statements of these assumptions are provided in AppendixAof this chapter. A brief discussion of the robustness of the model’s predictions to relaxing some of these parameter restrictions is provided in AppendixC.
Assumption1- Wage GapThe traditional sector is assumed to be sufficiently large (i.e.
γ is assumed to be sufficiently large) such that in any equilibrium the traditional good is produced in both countries. As a result the relative wages between the two countries are fixed in equilibrium by their relative productivity in the traditional sector. This is an often used assumption in the international trade literature (Antras and Helpman 2004), and is aimed at preserving the analytical tractability of the model.
Assumption2- Communication CostsI assume that the presence of communication costs imposes a binding constraint on the productive possibilities of the South. For this to be the case I require that the wage gap between the two countries (given by their rel-ative productivity in the traditional good) is sufficiently high and the expenditure share of the unskilled urban manufacturing (tasku) is sufficiently small15.
Assumption3- Agglomeration EconomiesThe localization economies affecting the management services sector are assumed to be sufficiently strong (the function φ is
15In AppendixAof this chapter, I discuss two versions of this parametric restrictions (denoted
sufficiently convex) such that along our analysis there is an unique stable equilibrium (subject to a permutation of city labels) that features the entire management services sector clustered in only one Northern city. Without further loss of generality I will assume that this city isN2. This assumption is aimed at keeping the analysis parsimo-nious while helping capture the empirical observation that high-skilled tradable services activity tend to be spatially concentrated within countries.
Assumption 4 - Infrastructure Constraints in the South I assume that the role of urban infrastructure in raising the productivity of skilled labor is sufficiently important (i.e. ρ is sufficiently large) such that, along our analysis, the lagging location of the South, cityS1is never competitive in the production of the skilled manufacturing (task
s). This restriction is imposed to prevent the proliferation of sub-cases.
Assumption5- “Timing” AssumptionThis represents a technical assumption aimed at determining the “timing” of stages in the evolution of the spatial economy. In par-ticular, I assume that the expenditure share of the skilled manufacturing (tasks) is suf-ficiently large such that as communication costs decline, the advanced location of the South becomes fully specialized in tasks “before” the skilled Northern city sheds all employment in this activity and becomes a pure “management city”. This assumption is not essential for the qualitative implications of the model and is made in order to keep the analysis parsimonious.
1.3.4
Spatial Equilibrium and Main Results
The next two sections are dedicated to discussing the predictions of the model outlined above. In this section I outline the properties of the spatial equilibria that emerge from the model and show that the model can qualitatively match the stylized facts that moti-vate the chapter. In the next section I present a stage by stage account of the “history of the location of economic activity” as seen through the lens of the model.
In the set-up presented above, featuring perfectly competitive markets for all com-modities, spatial equilibrium requires that all activities in the world economy only take place at cost minimizing locations:
pi = min
where l indexes locations (i.e. the hinterlands of the two countries and cities S1, S2,
N1,N2). Moreover, perfect mobility within countries guarantees that wages are equal-ized across locations within countries for workers of the same level of skill, while the imposition of Assumption 1 of section 1.3 fixes the level of unskilled wages in both North and South:
wcU =ξ1cp1 c∈ {N, S} (1.8)
Labor market equilibrium in the presence of an educational technology that is identical in the North and South requires that skill premia in both nations are given by:
wcS = w
U c
1−e (1.9)
Finally, the production and shipping conditions that govern the delivery of the manage-ment input result in different prices for this commodity in the North and South:
pMS =τ pMN (1.10)
where τ represents international communication costs. With these preliminaries in place, we are ready to study the effect of improvements in long-distance communi-cation technologies, reflected in the decline ofτ, on the worldwide spatial configuration of economic activity. When performing this comparative static exercise I am particu-larly interested in tracking how reductions in international communication costs affect cities’ populations, skill shares and real estate prices, as well as overall (worldwide) urbanization.
In equilibrium, urban rental rates are pinned down by the condition
rlN¯ = (1−β)Yul+ (1−β)(1−µ)Y l
s + (1−β)(1−µ
0)Yl
M (1.11)
by each location:
P opl =
X
i∈{u,s,M}
Lli+ 1 1−e
X
i∈{u,s,M}
Hil (1.12)
Hl Ll =
1 1−e
P
i∈{u,s,M}Hil
P
i∈{u,s,M}Lli
(1.13)
I begin the analysis of the role of communication frictions in determining the spatial configuration of economic activity by considering the case of prohibitively high commu-nication costs for the international transmission of management services. This setting represents a simplified characterization of the circumstances of the world economy in the middle of the twentieth century, when containerization and other technological de-velopments had already lowered the costs of shipping goods over long distances, but communication costs remained high and multinationals were rare. Proposition1offers a snapshot of the configuration of economic geography that can be expected under these circumstances in the context of my theory.16
Proposition 1. There is a threshold of communication costsTmaxsuch that if
τ > Tmax
there exists only one stable equilibrium that involves unskilled manufacturing taking
place exclusively in the South (i.e. both Southern cities are fully specialized in task
uproduction), while skilled manufacturing and management services production take place only in the North, with skilled manufacturing (s) locating in both Northern cities (N1andN2) while the management services sector clusters completely inN2.17
Moreover this equilibrium features asymmetric cities in both countries, with S2 and
N2being larger thanS1and respectively N1 in terms of both population and output (i.e. P opS2 > P opS1,P opN2 > P opN1,YS2 > YS1,YN2 > YN1) , S2displaying more expensive real estate thanS1while N1and N2 experience equal land prices (rS2 >
16The proof of this result and all subsequent propositions are relegated to AppendixBof this chapter.
Moreover, for this result and all subsequent results that involve communication cost thresholds, the formal expressions characterizing these thresholds are also provided in AppendixB.
17The formal expression for the thresholdT
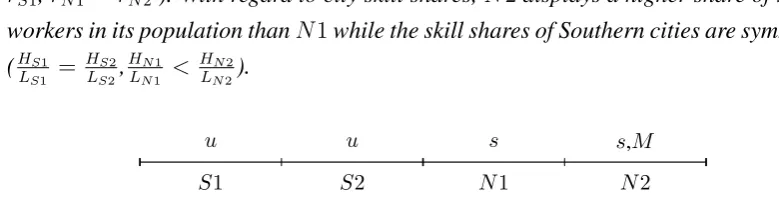
rS1,rN1 =rN2 ). With regard to city skill shares,N2displays a higher share of skilled workers in its population thanN1while the skill shares of Southern cities are symmetric (HS1
LS1 =
HS2
LS2,
HN1
LN1 <
HN2
LN2).
S1 S2 N1 N2
[image:39.595.68.458.112.211.2]u u s s,M
Figure 1.1: World Before Communication-induced Integration
In the presence of high communication costs it is uneconomical for Southern loca-tions to engage in skilled manufacturing activities. This is because the advanced manu-facturing requires the management input as an essential factor of production, and, in the set-up outlined above, this input is very costly to source from the North and infeasible to produce in the South. As a result, the world equilibrium features a relatively poor South whose cities are completely specialized in unskilled manufacturing, and a richer North that undertakes both skilled manufacturing and management services production. Southern cities are relatively undifferentiated, displaying the same skill share and in-dustrial structure. However, the more advanced city in the South, S2features a higher population and more expensive urban land than its counterpart S1, due to its greater endowment of infrastructure.
In the North, the clustering of the management sector in only one of the urban lo-cations endogenously gives rise to cities that are differentiated in terms of both their industrial structure and their skill share. The city N2, which captures the entire man-agement input production becomes the North’s skilled city, while N1, which becomes fully specialized in skilled manufacturing (s) takes on the role of the relatively unskilled Northern city. Moreover, due to the greater density of employment that prevails in the management sector, N2has a larger population than its less skilled counterpart. How-ever, given that Northern cities are identical in terms of both exogenous infrastructure and access to management services, and that in equilibrium the sector that is on the locational margin between the two Northern cities is skilled manufacturing (s), the two cities in the North have the same rental rates for urban land.
of my theory concerning urbanization and the cross-country distribution of economic activity as international economic integration deepens:
Proposition 2. Along the equilibrium path defined by unique stable equilibria and for any 1 < τ ≤ Tmax, as communication costs decline the world economy is strictly
growing, urbanization is strictly increasing while the compensation of Southern factors
relative to factors in the North weakly increases. Moreover, above a threshold of
com-munication costsτ∗ ≥ 1such that for τ∗ < τ ≤ Tmax a reduction in communication
costs is associated with a strict increase in the aggregate compensation of Southern
factors of production relative to Northern factors.
As communication costs decline below a certain threshold, the production of the skilled manufactures in the South becomes attractive and the South captures market share in advanced production. This allows the world economy to operate at higher levels of efficiency, as a productive friction is lessened and the location of productive activity moves closer to a configuration determined solely by unconstrained compara-tive advantage. As a result of this increase in efficiency, world output increases.
Moreover, as more of skilled manufacturing is undertaken in the South, the price of task sand of the overall urban composite good begin to fall relative to the price of the traditional good. This is because the reduction of communication costs simply re-flects the gradual removal of a friction that affects the production of the urban good but not of the traditional one. Given the elastic demand for the urban intermediate in the production of the final good, this results in an increase of the expenditure share of the urban good, and conversely in a decline of the expenditure share of the traditional good. This movement of the relative expenditure shares of the two sectors is reflected in their relative wage bills, and also in their relative employment levels. This is equivalent to a rise in the share of city dwellers as a proportion of total world population, or , in other words, to an increase in urbanization18.
Proposition2also predicts convergence in total output (or GNP) between North and South. With a sufficiently large traditional sector, the relative wages and hence the rela-tive aggregate wage bills of the two countries are fixed by their relarela-tive productivity in
18The mechanism outlined herein is thus similar to those of models of structural transformation (see
Baumol 1967, Ngai and Pissarides 2007, Rogerson2008, Michaels, Redding and Rauch 2011,2012,
that sector. However, as a larger fraction of urban production takes place in the South as communication costs decline, Southern urban landowners will increase their share in overall land receipts, and hence the overall compensation of Southern factors grows relative to the one of the North. Finally, as worldwide urbanization increases and the South increases its weight in urban production, the size of the Southern urban system increases. Given that countries have constant population this leads to the straightfor-ward conclusion that Southern urbanization rates must expand.
The shifts in the location of economic activity caused by declining international communication costs affect not only the cross country distribution of income and ur-banization, but also the relative size of cities within countries. This is discussed in the next proposition:
Proposition 3. Along the path defined by unique stable equilibria, for anyτ∗ < τ ≤
Tmax, a reduction in τ is associated with an increase in the relative size of the skilled
cities (S2,N2) in both the North and the South. Formally we have:
∂ ∂τ
P opS2
P opS1
<0 ∂
∂τ
P opN2
P opN1
<0
The analysis undertaken in Proposition 2revealed that as communication costs de-cline the South captures a larger fraction of the value chain for the urban intermediate, and begins a process of “catch-up” relative to the North. This catch-up process does not proceed evenly, however. Due to its infrastructure advantage, the advanced South-ern cityS2becomes competitive in skilled production “before” the backward location
S119. As a result of being able to benefit from the gradual relocation of skilled manu-facturing and given the high employment density of this activity, cityS2displays more robust population growth than its lagging (and now relatively skill scarce) counterpart
S1and thus the relative size of Southern cities moves in the direction outlined by Propo-sition3.
The implications of this gradual relocation of skilled manufacturing from North to South are also not symmetric for locations in the North. As the South becomes in-creasingly competitive in tasks, both Northern locations gradually shed skilled manu-facturing activities and their affiliated jobs. However, whereas cityN1benefits from no
compensating force against this loss of market share in skilled production, this is not the case for cityN2. To see this, note that I have shown above that a fall in communication costs will not only be associated with skilled production being relocated to the South, but also with an increase in the overall size of the urban sector. Thus, while the North-South reallocation of activity can negatively impact both Northern cities, the management ser-vices cluster in cityN2stands to benefit from the lessening of communication frictions, as it can now sell its product to a larger and more efficient world economy. This growth of management services then serves to cushion the potential negative impact of task
s relocation for city N2in the early stages of globalization and eventually allows for cityN2 to grow even in the face of substantial offshoring to the South. This ensures more robust population growth performance for the skilled Northern city along the en-tire path of international economic integration, leading to divergence in urban success in the North.
Finally, I present the model’s implications concerning the spatial distribution of workers by skill and the evolution of land prices across locations. These results are summarized in Proposition4:
Proposition 4. Along the path defined by the unique stable equilibria, for anyτ∗ < τ ≤
Tmax, a reduction inτ is associated with skill divergence across cities or/and divergence
in the rental rate of land across cities in both North and South. Formally,∀τ ≤Tmax:
∂ ∂τ
HS2
LS2
−HS1
LS1
≤0 ∂
∂τ
rS2
rS1
≤0 (1.14)
∂ ∂τ
HN2
LN2
−HN1
LN1
≤0 ∂
∂τ
rN2
rN1
≤0 (1.15)
with at least one inequality in each pair(1.14)or(1.15)above being strict.
sector.
When the first type of configuration prevails, a reduction in communication costs can be expected to increase the skill share differential between cities within countries but keep the land price differential unchanged. This is because the reduction in commu-nication costs is generally associated with growth in the skilled sector of both countries. As a result, some of the less skill intensive activities in the country’s skilled city can be expected to relocate, leaving the advanced location with a greater exposure to the most skill intensive sector, and thus with a higher skill share. On the other hand, in this type of configuration, small reductions in communication costs have no impact on the sectoral composition of the lagging city, and thus leave that location’s skill share unchanged. Thus, increasing skill shares in advanced locations coupled with stagnating ones in lagging cities lead us to the prediction of skill polarization across space. More-over, when the configuration of the spatial economy involves a skilled city with a mixed industrial composition, the relative land rents between urban locations within countries are fixed by the less skilled sector, which is on the locational margin between the two cities, and are thus invariant to small changes in communication costs.
On the other hand, when both cities within a country are fully specialized, growth in the more skilled sector as communication technologies improve only translates into rel-ative growth of the more skilled city, as in my setting the lagging cities of each country never become competitive in their respective nation’s most skilled activity. As the rel-ative weight of the skilled city in a country’s value added grows and no further activity migrates out of the skilled city, this advanced location will experience congestion and an increase in real estate prices relative to the backward city.
1.4
A History of the Location of Economic Activity
1.4.1
The Past and Present
I begin my account of the recent developments in economic geography from the spa-tial configuration described in Proposition 1. This snapshot of worldwide economic geography describes the state of affairs in the middle of twentieth century: relatively concentrated economic activity across countries, stark differences between the internal economic geographies of countries, with industrialized nations featuring high levels of urbanization and notable concentration of economic activity while the economic geog-raphy of developing countries is far more dispersed. Moreover, this configuration of the spatial features relatively low levels of geographical segregation of the skilled in both North and South as well as small within country disparities in the price of land.
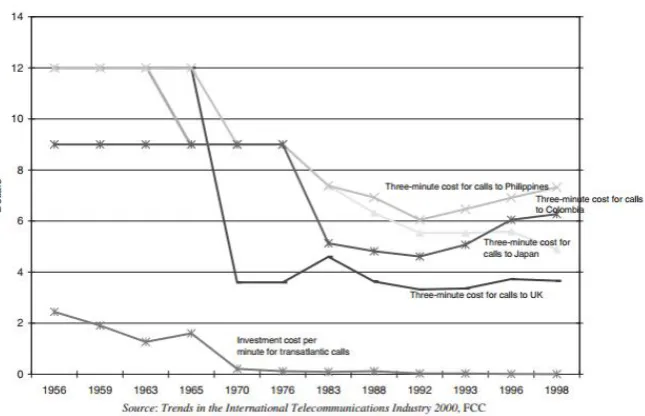
This chapter advances the hypothesis that the reconfiguration of the spatial economy away from the state described above during the second half of the twentieth century can be attributed to improvements in communication technology. These improvements have been documented by a substantial literature. According to the IMF, the cost of a three minute telephone call between New York and London fell by more than ninety nine percent between1930and2000. Tang (2006) reports the evolution of the cost of a three minute telephone conversation between the US and a larger set of countries, and finds a 70% decline after 1970 (see Figures 1.11 and 1.12). Furthermore, Laudon and Laudon (2013) document similarly steep falls in the cost of delivering data over the Internet while in an extensive report on the history of communications, Odlyzko (2000) reviews several facts concerning the cost reductions and rapid diffusion of a broad range of mod-ern communication technologies.
In the context of the model, the first stage of communication induced globalization begins when (international) communication costs fall below the threshold at which the production of increasingly skill-intensive manufacturing goods becomes economical to undertake remotely in developing countries, while the management function remains in industrialized nations20. The implications of this first stage of globalization on the
20During this and the following stages of globalization a crucial element of the mechanism captured by
configuration of the spatial economy are outlined below: Stage 1Along the interval of communication costs given by
Tspec1< τ ≤Tmax
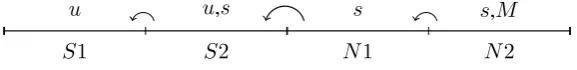
the spatial configuration of economic activity (i.e. the configuration that prevails at the unique stable equilibrium associated with each level of communication costs) takes the form depicted in Figure 1.2. It features skilled manufacturing (s) taking place in the locations{S2, N1, N2}, unskilled manufacturing (u) being produced in both Southern cities while management services (M) are produced inN221. Moreover, along this in-terval, any reduction in communication costs is associated with increased urbanization and worldwide GDP, faster increases in Southern GDP, growth in the relative size of ad-vanced cities (S2andN2) in both countries, and skill polarization across space within countries.
S1 S2 N1 N2
[image:45.595.136.425.349.384.2]u u,s s s,M
Figure 1.2: First Stage of Globalization
In this first stage of globalization, the infrastructure rich location of the South (S2) becomes competitive in skilled manufacturing and takes on the role of the South’s skilled city. As cityS2gains market share in skilled manufacturing, unskilled manufac-turing is crowded out, aiding the growth of cityS1. However, the higher employment density of skilled manufacturing, guarantees that growth in cityS2population is faster than in S1, leading to the “take-off” of this location relative to the rest of the coun-try. Moreover, as communication costs fall belowTmaxbut remain substantial, the shift
of skilled task production to the South is still limited enough such that the relatively unskilled activities of each country (u in the South, s in the North) remain the main consumers of urban land in both nations. As a result, these activities occur in both cities of each country and represent the main drivers of urban land prices. This in turn
guar-(Wei1999). Some evidence can be brought in support of the former mechanism: easier access to foreign intermediates and capital goods has been found not only to increase the productivity of domestic firms (Amiti and Konings2007; Eaton and Kortum2001) but also allows them to increase the scope of their production (Goldberg, Khandelwal, Pavnick and Topalova2009,2010; Feng, Li and Swenson2013)
21For the formal expression that gives the threshold T