Essays in Macroeconomics
by
Markus Brückner
Department of Economics
Universitat Pompeu Fabra
c/Ramon Trias Fargas 25-27
08005 Barcelona, Spain
Email: [email protected]
Phone: +34-681039957
Submitted to the Department of Economics on October 11, 2010, in partial fulfillment
of the requirements for the degree of Doctor of Philosophy in Economics.
Thesis Supervisors
Evi Pappa
Department of Economics
Universitat Autonoma Barcelona
Abstract (English)
This thesis consists of three chapters. The first chapter examines empirically the
relationship between foreign aid and economic growth in the Least Developed
Countries. Instrumental variables techniques are used to estimate the effect that
economic growth has on foreign aid and to adjust for the reverse causal effect that
growth has on aid when estimating the effect that aid has on growth. The second
chapter examines the effects that fiscal expansions have on the unemployment rate. The
chapter presents SVAR evidence for ten OECD countries and builds a DSGE model
with a labor force participation choice and workers' heterogeneity to explain the
empirical findings. The third chapter examines the effects that economic growth has on
the support for extreme political platforms. The chapter provides a theoretical model in
favor of growth effects (as opposed to level effects) on the support for extreme political
parties, and investigates empirically the relationship between growth and extremist
votes for 16 OECD countries.
Abstract (Spanish)
Esta tesis consiste en tres capítulos. El primer capítulo examina empíricamente la
relación entre la ayuda exterior y crecimiento económico en los países menos
adelantados. Técnicas de variables instrumentales se utilizan para estimar el efecto que
el crecimiento económico tiene sobre la ayuda exterior y para ajustar el efecto de
causalidad inversa que el crecimiento tiene en la ayuda al estimar el efecto que la ayuda
tiene sobre el crecimiento. El segundo capítulo analiza los efectos que las expansiones
fiscales tienen sobre la tasa de desempleo. El capítulo presenta pruebas SVAR para diez
países de la OCDE y construye un modelo DSGE con una participación en la fuerza de
trabajo y heterogeneidad de los trabajadores para explicar los resultados empíricos. El
tercer capítulo analiza los efectos que el crecimiento económico tiene en el apoyo a las
plataformas políticas extremas. El capítulo ofrece un modelo teórico a favor de los
efectos del crecimiento (en contraposición a los efectos de nivel) con el apoyo de
partidos políticos de extrema, e investiga empíricamente la relación entre el
crecimiento de votos y extremistas para 16 países de la OCDE.
Preface
This thesis consists of three chapters. The first chapter examines empirically the
relationship between foreign aid and economic growth in the Least Developed
Countries. The chapter shows that foreign aid has a significant positive average effect
on real per capita GPD growth if, and only if, the quantitatively large negative reverse
causal effect of per capita GDP growth on foreign aid is adjusted for in the growth
regression. Instrumental variables estimates yield that a 1 percentage point increase in
GDP per capita growth decreased foreign aid by over 4 percent. Adjusting for this
quantitatively large, negative reverse causal effect of economic growth on foreign aid
yields that a 1 percent increase in foreign aid increased real per capita GDP growth by
over 0.1 percentage points. The chapter shows that the obtained instrumental variables
estimates are consistent with a calibrated version of a Solow-Swan growth model
where part of foreign aid is used for investment. The chapter also examines
cross-country parameter heterogeneity and distinguishes between short-run and long-run
effects of foreign aid on economic growth.
The second chapter examines the effects that fiscal expansions have on the
unemployment rate. Structural VARs indicate that, for many OECD countries the
unemployment rate significantly increases following increases in government
expenditures under a variety of specifications and identification schemes. Fiscal
expansions also tend to increase employment, participation rates and real wages.
Existing models have difficulties in generating such responses. The chapter shows that
the empirical regularities can be reproduced with two additions into a standard New
Keynesian model with matching frictions: (a) a labor force participation choice and (b)
workers’ heterogeneity. The chapter is joint work with Evi Pappa.
The third chapter examines the effects that economic growth has on the support for
extreme political platforms. The chapter provides a theoretical argument in favor of
growth effects (as opposed to level effects) on the support for extreme political parties
and empirically investigates the relationship between growth and extremist votes.
Lower growth rates benefit right-wing and nationalist parties, but do not have a robust
positive effect on the support for communist parties. The empirical estimates indicate
that extreme political platforms are unlikely to gain majorities in OECD countries,
unless there is an extreme drop in the GDP per capita growth rate. The chapter is joint
work with Hans Grüner.
Acknowledgement
I would like to thank my advisors Evi Pappa and Fabio Canova for their invaluable
guidance and support while writing this thesis. I am grateful to Antonio Ciccone,
Francesco Caselli and Marta Reynal-Querol for helpful comments and suggestions on
the first chapter of this thesis as well as participants of the Applied Econometrics
Seminar at the University of Mannheim and the European Economic Association
Meeting at the University of Glasgow. I am thankful to Hans Grüner and Nicola
Gennaioli for very insightful discussion on contract theory and political economy.
Special thanks also to Marta Araque and Laura Augusti who were always ready to
answer administrative questions during my PhD studies at Pompeu Fabra.
Table of Contents
1. On the Simultaneity Problem in the Aid and Growth Debate
...1
1. Introduction
... ...1
2. Estimation Strategy
...3
3. Data
... ...5
4. Main Results
... ...6
5. Further Issues
... ...10
6. Conclusion
... ...14
7. References
... ...16
8. Appendix
... ...19
9. Tables and Figures
... ...22
2. Fiscal Expansions Can Increase Unemployment
... ...36
1. Introduction
... ... ...36
2. Data and Estimation Methodology
...38
3. Empirical Results
...-...39
4. The Model
... ...42
5. How Expansionary Government Spending Shocks Can Increase
Unemployment
... ...49
6. Conclusion
... ...52
7. References
... ...55
8. Appendix
... ...56
9. Tables and Figures
... ...61
3. Economic Growth and Rise of Political Extremism
... ...78
1. Introduction
... ...78
2. The Model
... ...81
3. Description of the OECD Vote Share Dataset
...85
4. Estimation Strategy
...87
5. Main Empirical Results
... ...89
6. Conclusion
... ...93
7. References
... ...95
8. Appendix
... ...97
9. Tables and Figures
...99
Chapter 1: On the Simultaneity Problem in the
Aid and Growth Debate
1 Introduction
Does foreign aid have a positive, causal eect on economic growth? I show that the answer to this important policy question is yes if, and only if, one takes into account that economic growth itself has a quantitatively large, negative within-country eect on foreign aid. The aid eectiveness literature is well aware of this endogeneity problem. However, one of the main problems that this literature continues to struggle with, is nding a plausible time-varying instrumental vari-able for foreign aid (Temple, 2010). Moreover, despite standard macroeconomic theory predicting a positive eect of foreign aid on economic growth if part of the foreign aid is used for investment, the consensus in the aid eectiveness literature is that foreign aid does not have a signicant positive average eect on economic growth.1 I show that indeed one may arrive at this conclusion if
the negative reverse causal eect of per capita GDP growth on foreign aid is not accounted for in the growth regression. Once the negative reverse causal eect of economic growth on foreign aid is accounted for, estimates of the ef-fect of foreign aid on economic growth are positive, statistically signicant, and economically meaningful.
My estimation strategy to identify the causal eect of foreign aid on economic growth is based on a two-step procedure. The two-step procedure is closely related to the approach taken in the empirical macro literature to identify the causal eects of scal policy (see, in particular, Blanchard and Perotti, 2002). In the rst step, I estimate the response of foreign aid to economic growth, using rainfall and international commodity price shocks as instrumental variables to generate exogenous variation in real per capita GDP growth for a panel of 47 LDCs during the period 1960-2000. In the second step, after the causal response of foreign aid to real per capita GDP growth is quantied by the instrumental variables estimates, I use the residual variation in foreign aid that is not driven by GDP per capita growth as an instrument to estimate by two-stage least squares the eect that foreign aid has on per capita GDP growth. This two-step estimation strategy enables to: (i) obtain an understanding of how foreign aid responds to per capita GDP growth at the macroeconomic level (hence, providing useful information on the severity of the endogeneity bias if one fails to adequately deal in the growth regression with the endogenous response of foreign aid to economic growth); and (ii) compute an estimate of the eect that foreign aid has on economic growth that is adjusted for the reverse causal eect that growth has on aid.
1See for example Burnside and Dollar (2000), Hansen and Tarp (2001), Dalgaard et al.
(2004), Easterly et al. (2004), Roodman (2007), Bourguignon and Sundberg (2007), or Rajan and Subramanian (2008), and the critical review of the literature by Temple (2010). Papers that have studied aid allocation criteria include, among many others, Trumbull and Wall (1994), Alesina and Dollar (2000), and Alesina and Weder (2002).
My rst main nding is that increases in real per capita GDP growth of aid recipient countries are associated with a statistically signicant and quantita-tively large reduction in foreign aid. An instrumental variables estimate yields that a 1 percentage point increase in the real per capita GDP growth rate is associated with a signicant decrease in foreign aid by over 4 percent. This result is consistent with the stylized cross-country fact that as countries grow richer they rely less on foreign aid. It is also consistent with donor countries acting as Good Samaritans: when the economy of the aid recipient country is booming the Good Samaritan reduces aid, while in times of severe economic diculties aid is increased.
An important implication of this rst main nding is that research on the eect of foreign aid on economic growth is complicated by a quantitatively large, negative reverse causal eect of economic growth on foreign aid. The large, negative causal eect of economic growth on foreign aid implies that the cards in empirical research on aid eectiveness are stacked against nding in the data a signicant positive average eect of foreign aid on economic growth. I show that once the negative reverse causal eect of per capita GDP growth on foreign aid is adjusted for in the growth regression, that foreign aid did in-deed have a signicant positive average eect on real per capita GDP growth. My panel xed eects estimates yield that a 1 percent increase in foreign aid is associated with a signicant within-country increase in GDP per capita growth of around 0.1 percentage points. These instrumental variables estimates are con-sistent with the quantitative predictions of a Solow-Swan growth model where a part of foreign aid nances domestic investment. I also show that estimating the eect that foreign aid has on GDP per capita growth without taking into account that there is a large, negative reverse causal eect of economic growth on foreign aid would lead to the (mistaken) conclusion that foreign aid has no signicant positive average eect on real per capita GDP growth.
There are several reasons why the issue of the causal eect that foreign aid has on economic growth in the Least Developed Countries is important. First, foreign aid ows constitute a signicant share of these countries' per capita income. On average the 1960-2000 share of net ocial development aid in GDP was about 3 percent. Second, most of the foreign aid ows are nanced by tax payer money. Western governments are accountable to voters and most of these voters may not be receptive to much more information than whether on average foreign aid had a positive causal eect on economic growth. Third, the premier World Millenium Development goal is to end poverty and hunger in the world's poorest countries. If one believes that per capita GDP growth is associated with signicant increases in the income per capita of the world's poorest, as is suggested for example by Dollar and Kraay (2002), and if one cares about reducing poverty and hunger, then clearly it is important to have kowledgement about the causal eect that foreign aid has on economic growth in the world's poorest countries.
The remainder of the paper is organized as follows. Section 2 explains the estimation strategy. Section 3 describes the data. Section 4 presents the main results. Section 5 presents further robustness checks. And Section 6 concludes.
2 Estimation Strategy
2.1 Estimating the Eect that Economic Growth has on
Foreign Aid
Estimating the eect that real per capita GDP growth has on foreign aid re-quires an exogenous source of variation for real per capita GDP growth. To generate such variation, I use smooth variations in rainfall and international commodity price shocks as instrumental variables.2 A key characteristic of the
Least Developed Countries (LDCs) that makes this estimation strategy plausible is that these countries are highly dependent on the agricultural and commodity exporting sector.3 Hence, variations in rainfall and international commodity
prices can induce substantial variation in real per capita GDP growth vis-a-vis changes in agricultural productivity and the terms of trade. Because rainfall is random and the economic size of each LDC (as measured by the share in world commodity production) is extremely small (so that the country can be eec-tively treated as being a price taker on the international commodity market) the induced variations in per capita GDP growth will be exogenous to variations in foreign aid and economic growth.4
I estimate the eect that real per capita GDP growth has on foreign aid using two-stage least squares:
∆log(aidi,t) =ai+bt+c∆log(yi,t) +ei,t, (1)
where∆log(aidi,t)is the log-change of foreign aid per capita and∆log(yi,t)is the
log-change of real per capita GDP.5aiare country xed eects that capture
long-run (unobservable) dierences across countries that jointly determine changes in foreign aid per capita and per capita GDP growth; btare year xed eects
that capture global business cycle eects and other global shocks that may be jointly driving foreign aid and per capita GDP growth of the LDCs.
2Several papers have documented the signicant eect of rainfall and international
com-modity price shocks on economic growth in Sub-Saharan Africa. See for example Deaton (1999), Miguel et al. (2004), or Brückner and Ciccone (2010a,b). Sub-Saharan African coun-tries constitute about two-thirds of the 49 councoun-tries that are classied by the United Nations as the Least Developed Countries (LDCs). The paper covers 47 of the 49 LDCs. The 2 LDCs that are not covered in the paper due to missing GDP data are East-Timor and Myanmar.
3See the Data Appendix for further details.
4Conditional of course on country and year xed eects. See the equation below.
5This functional form follows Trumball and Wall (1994), who derive the panel xed eects
log-log specication based on a theoretical model where aid decisions of donors are motivated by the well-being of the aid recipient country. I use the log-change of foreign aid rather than the level of foreign aid because the Im, Pesaran, and Shin (2003) panel unit root test did not reject the null hypothesis that the level of foreign aid has a unit root. The test rejected however at the 1% level the null hypothesis that the rst-dierence of the foreign aid series has a unit root. Regarding cointegration, the panel cointegration tests developed by Westerlund (2007) did not reject the null hypothesis that there is no cointegration between the log-level of foreign aid and the log-level of GDP per capita. Thus, panel cointegration tests do not point to a signicant exact common component between permanent shocks to the level of GDP per capita and permanent shocks to the level of foreign aid.
The excluded instruments (Zi,t) in the two-stage least squares estimation
of equation (1) are the log-changes of the international commodity price index, rainfall, and rainfall squared (see Section 3 for a detailed description of how these instruments are constructed). The exclusion restriction states that the instruments should only systematically aect the dependent variable (foreign aid per capita) through their eect on per capita GDP growth. The validity of rainfall and commodity price shocks as excluded instruments in equation (1) will be examined rigorously in Section 4.1.
2.2 Estimating the Eect that Foreign Aid has on
Eco-nomic Growth
If per capita GDP growth has a signicant eect on foreign aid (i.e. in equation (1) c6=0) then OLS estimation of the eect that foreign aid has on economic
growth will be biased. Specically, suppose that the eect of foreign aid on economic growth can be written as:
∆log(yi,t) =hi+it+k∆log(aidi,t) +mZi,t+ui,t, (2)
thencov(∆log(aidi,t), ui,t)6= 0, and OLS estimation ofkwill be upward biased
ifc >0and downward biased ifc <0.
This endogeneity bias, that is due to c 6= 0in equation (1) can be evaded
however by (i) constructing an adjusted foreign aid series where the response of foreign aid to per capita GDP growth is partialled out; i.e.:
∆log(aidi,t)∗= ∆log(aidi,t)−c∆log(yi,t) (3)
and (ii) using this endogeneity adjusted aid series as an instrument for the orig-inal aid series in equation (2). By construction, the IV estimator that uses the endogeneity adjusted aid series∆log(aidi,t)∗ as an instrument for ∆log(aidi,t)
does not suer from the simultaneity bias. Moreover, beyond taking care of the simultaneity bias, that is associated with the least squares estimation of equa-tion (2), the IV estimator will provide a consistent estimate of the parameter
k under the assumption (exclusion restriction) that the error in equation (1)
is uncorrelated with the error in equation (2). If there are omitted variables that are part of both, equations (1) and (2) the zero-covariance assumption will be violated and the IV estimator will not solve the omitted variables prob-lem. However, the IV estimator will still solve the simultaneity probprob-lem. The Technical Appendix provides a formal proof for why an IV estimator that uses the residual variation of foreign aid which is not driven by economic growth does not suer from the simultaneity bias. The appendix also derives the omit-ted variables bias of the least squares and IV estimator which arises when the zero-covariance restriction is violated.
Note that the estimation strategy requires that the parametercin equation
(1) is estimated consistently. Because of the simultaneous nature of the two equations, OLS can not provide a consistent estimate of the parameter c in equation (1) ifk6= 0in equation (2). Moreover, because measurement error is a
real concern in national accounts statistics of developing countries (e.g. Heston, 1994; Deaton, 2005) the OLS estimate of the parameter c in equation (1) will
likely be attenuated towards zero. Hence, the need for instrumental variables estimation of equation (1).
An issue arising with the estimation strategy in equation (2) is that the adjusted aid series (aidi,t)∗ is a generated regressor. Typically, the presence
of a generated regressor leads to standard errors on the slope coecients that are incorrect for purposes of hypothesis testing.6 However, there is a special
case where the standard error on the slope coecient of a generated regressor is correct: namely, for testing the hypothesis that the slope coecient is equal to zero (see, for example, Wooldridge, 2002, p. 141). In the aid literature the debate has focused on the question of whether the eect of foreign aid on economic growth is signicantly dierent from zero. Hence, the special case where the standard error on the slope coecient of a generated regressor is correct (i.e. the case for testing the hypothesis of a zero slope coecient on foreign aid) is the relevant one for this paper's empirical analysis.
3 Data
Rainfall Data. I obtain data on annual rainfall for each of the 47 LDCs during the period 1960-2000 from the Climate Research Unit (CRU) and the Tyndall Centre for Climate Change Research (TYN) of the University of East Anglia. Specically, I use the TYN CY 1.1 version that has been developed by Mitchell et al. (2003) and approved by the Intergovernmental Panel on Climate Change (IPCC). The CRU/TYN rainfall data come at a high resolution (0.5°x0.5° latitude-longitude grid) and each rainfall observation in a given grid is constructed by interpolation of rainfall observed by all stations operating in that grid. Rainfall data are then aggregated to the country level by assigning grids to the geographic borders of countries and weighting the observation in each grid by surface area, using the cosine of the latitude (see Mitchell et al., 2003 for more details).
6Consistency of the estimator is of course not aected by the use of a generated regressor.
October 3, 2010
International Commodity Price Shocks. The country-specic interna-tional commodity export price index ComP Ii,t that captures shocks to the
international prices of exported commodities is constructed as:
ComP Ii,t=
Y
c∈C
ComP riceθc,i
c,t (4)
whereComP ricec,t is the international price of commodityc in yeart, andθc,i
is the average (time-invariant) value of exports of commodity c in the GDP
of country i. Annual international commodity price data are for the
1960-2000 period from UNCTAD Commodity Statistics, and data on the value of commodity exports are from the NBER-United Nations Trade Database.1
GDP and Foreign Aid Data. The real per capita GDP data are from the Penn World Tables (PWT), version 6.2 (Heston et al., 2006). Data on net ocial development aid are from the World Development Indicators (2009).2
4 Main Results
4.1 IV Estimates of the Eect of Economic Growth on
Foreign Aid
Table 1 presents the baseline two-stage least squares estimates of the eect that real per capita GDP growth has on foreign aid. Column (1) shows the rst-stage estimates that link international commodity price shocks and rainfall (Zi,t) to
real per capita GDP growth∆log(yi,t). All three instruments are individually
signicant at least at the 1% level and yield a rst-stage F-statistic of about 9.3. Increases in the international prices of exported commodities and improved
1The commodities included in the index are: aluminum, beef, coee, cocoa, copper, cotton,
gold, iron, maize, oil, rice, rubber, sugar, tea, tobacco, wheat, and wood. In case there were multiple prices listed for the same commodity a simple average of all the relevant prices is used.
2I use net ocial development aid, dened as grants and concessional loans net of
repay-ments, because this measure captures best the actual transfers to countries (see for example Easterly, 2003, p. 29). I have chosen to focus on total ocial development aid, rather than more specic measures of aid, because if aid is fungible, as argued for instance in Devarajan and Swaroop (1998), then conceptually it makes little sense to distinguish between dierent kinds of foreign aid (see also Rajan and Subramanian, 2008).
rainfall conditions are associated with a signicant increase in the real per capita GDP growth of the LDCs. The negative quadratic term on the rainfall variable captures that at some stage too much rainfall may be counterproductive for agricultural productivity and hence for GDP per capita growth.
That the instrumentsZi,t have also a signicant reduced-form eect on
for-eign aid ∆log(aidi,t) is shown in column (2). Increases in the international
prices for exported commodities and improved rainfall conditions are associ-ated with a signicant decrease in foreign aid. Because the regression controls for year xed eects, the reduced-form estimates are not driven by changes in economic conditions of OECD countries that may in turn systematically aect movements of international commodity prices. Moreover, the country xed ef-fects take into account that some LDCs are more dependent on the agricultural and commodity exporting sector than others, and that aid ows may be deter-mined by deep historical factors, such as for example colonial ties to a specic European country.
For comparison purposes with the second-stage estimates that are presented in columns (4)-(8), column (3) shows the least squares estimates of the eect that real per capita GDP growth has on foreign aid. The least squares estimate is negative and statistically signicant at the 5% level. However, if foreign aid has a signicant eect on GDP per capita growth this point estimate can not be taken as reecting the causal eect that per capita GDP growth has on foreign aid. In fact, if foreign aid has a signicant positive eect on GDP per capita growth, the least squares estimate of the eect that GDP per capita growth has on foreign aid will be upward biased.
Column (4) therefore presents the two-stage least squares estimate that uses international commodity price shocks and rainfall as excluded instruments. The second-stage point estimate on real GDP per capita growth from the two-stage least squares regression is statistically signicant at the 5% level and in abso-lute size much larger than the corresponding least squares estimate in column (3). The larger absolute size of the coecient from the two-stage least squares regression could be due to a number of factors. First, if foreign aid has a posi-tive eect on GDP per capita growth the least squares estimate will be upward biased. Second, measurement error in per capita GDP growth is a real issue for the LDCs (see for example, Heston, 1994; or Deaton, 2005). To the extent that this measurement error is classical it will attenuate the slope coecient in the least squares regression towards zero but not the slope coecient in the two-stage least squares regression. The Hausman test rejects that the least squares estimate is equal to the two-stage least squares estimate at the 10% level (p-value 0.067), thus pointing to a signicant dierence between the least squares and instrumental variables estimate.
Quantitatively, the two-stage least squares estimate in column (4) implies that a 1 percentage point increase in real per capita GDP growth is associated with an average reduction in foreign aid by over 4 percent. For this two-stage least squares estimate to reect the causal eect that per capita GDP growth has on foreign aid, it is necessary that the instruments fulll the exclusion restriction. That is, rainfall and international commodity price shocks should
have no systematic eects on foreign aid other than through GDP per capita growth.
The p-value of the Hansen J-test on the overidentifying restrictions reported in column (4) is 0.82. Hence, the Hansen J-test does not reject that the instru-ments are uncorrelated with the second-stage error. To show also more intu-itively that beyond per capita GDP growth there are no systematically large direct eects of international commodity price shocks and rainfall on foreign aid I report in columns (5)-(7) two-stage least squares estimates when instruments are added to the right-hand side of the second-stage equation. As can be seen, the size of the coecient on the international commodity price index conditional on real per capita GDP growth (columns (5) and (6)) is less than one-third of the size of the coecient that is obtained in the reduced-form regression (col-umn (2)). Statistically, the coecient is also not signicant at any conventional condence level. The coecient on rainfall on the other hand ips sign and is also statistically insignicant. These regressions that directly estimate the eect that the instruments have on foreign aid conditional on per capita GDP growth therefore resonate the result of the Hansen J-test that did not reject the validity of rainfall and international commodity price shocks as instrumental variables for real per capita GDP growth in the aid equation. Column (8) shows that the second-stage (and rst-stage) relationship continues to hold when excluding all those country-years where LDCs experienced a drought year, which could be associated with an atypical inux of foreign aid.3
An issue that has received substantial attention in particular in the aid lit-erature is the robustness of results to outliers and the sample size.4 To show
that within the LDC sample results are robust to the selection of a specic sub-sample and the exclusion of observations that may be deemed as potential outliers Table 2 presents a variety of robustness checks. In column (1) only those country-year observations are used for the two-stage least squares esti-mation that produce a balanced panel for the 1960-2000 period. The point estimate on the second-stage coecient is in this case -5.47 and is statistically signicant at the 1% level. In column (2) the balanced sample is maintained, but all those observations are excluded which are deemed as outliers by the Hadi (1992) procedure.5 Excluding these outliers barely changes the
second-stage point estimate, but it does make the rst-second-stage t a bit more precise. In columns (3)-(5) the sample period is elevated to cover the 1970-2000 period only. The motivation for focusing on the 1970-2000 period is that some of the LDCs during the 60s were still under colonial inuence of the European countries. Column (3) presents the unbalanced panel estimates for the 1970-2000 period, while column (4) uses only those 39 LDCs that yield a balanced panel for the
3Drought years are identied using the publicly available data on natural disasters that
are provided by the Universite Catholic de Louvain's Emergency Disaster database (EM-DAT, 2009).
4See for example Easterly et al. (2004) or Roodman (2007).
5The Hadi (1992) procedure for detecting outliers has been popularly used in the aid
literature. See for example Easterly et al. (2004) or Roodman (2007). The cut-o signicance level chosen for the Hadi procedure is 5%.
1970-2000 period. Column (5) excludes further potential outliers based on the Hadi procedure. The main result is that per capita GDP growth continues to have a signicant negative eect on foreign aid in all these regressions. Point estimates range between -4.19 and -6.07 and their 95% condence intervals span the point estimate obtained in column (4) of Table 1.6
4.2 IV Estimates of the Eect that Foreign Aid has on
Economic Growth
The results of the previous section showed that foreign aid is highly endogenous to the per capita GDP growth of the aid recipient countries. Specically, the instrumental variables estimates yielded that foreign aid decreased substantially during times when per capita GDP growth of aid recipient countries increased. Hence, an OLS estimate of the eect that foreign aid has on per capita GDP growth will suer from downward bias due to the reverse negative eect that per capita GDP growth has on foreign aid.
Panel A of Table 3 shows estimates of the eect of foreign aid on per capita GDP growth when adjusting for the large negative eect that GDP per capita growth has on foreign aid (for an explanation of how this is done see Section 2.2).7 Panel B reports for comparison purposes the OLS estimates. All
regres-sions continue to control for country and year xed eects.
The main message of the estimates in Panel A of Table 3 is that the eect of foreign aid on real per capita GDP growth is positive and signicantly dierent from zero at over 99% condence when the negative reverse causal eect of GDP per capita growth on foreign aid is adjusted for. On the other hand, in Panel B of Table 3 the OLS estimates, that suer from the negative reverse causal eect are either statistically insignicant or signicantly negative. These results hold across a variety of dierent sub-sample specications and are robust to the exclusion of observations that are deemed as potential outliers by the Hadi procedure. Specically, the instrumental variables estimates in Panel A of Table 3 yield that a 1 percent increase in foreign aid is associated with a signicant increase in real per capita GDP growth by around 0.1 to 0.2 percentage points.8
6An additional criterion that is important for instrumental variables estimation to yield
consistent second-stage estimates is the stage relevance of the instruments. The rst-stage F-statistic in Tables 1 and 2 is between 7.8 and 15.8. According to the tabulations in Stock and Yogo (2005), the maximal IV relative bias (maximal size distortion) is therefore less than 5% to 20% (15% to 25%). The p-values reported in square brackets below the 2SLS estimates in Tables 1 and 2 are based on the Anderson-Rubin test of statistical signicance, and a key property of this test statistic is robustness to weak instruments (see for example Andrews and Stock, 2005). In Appendix Table 1 I show that using weak IV robust estimators yields second-stage estimates that are very similar, both quantitatively and statistically, to the two-stage least squares estimates reported in Tables 1 and 2.
7The adjustment is done using the corresponding point estimates of the eect that economic
growth has on aid from Tables 1 and 2, thus matching the sample size in each column of Table 3.
8Appendix Table 2 shows that similar results are obtained when applying the instrumental
variables strategy to the publicly available datasets of Burnside and Dollar (2000), Easterly et al. (2004), or Roodman (2007).
Table 4 shows that there continues to be a signicant positive average eect of foreign aid on economic growth when controlling for within-country changes in political institutions. Changes in political institutions could have a direct and independent eect on foreign aid beyond economic growth if due to political reasons donors prefer to give foreign aid to more democratic countries.9 For
within-country changes in political institutions to be an omitted variable in the growth equation it would have to be the case however that at the annual level a change in political institutions has an immediate eect on economic growth. Panel A of Table 4 shows that this is not the case. The coecient on the Polity2 score that captures political institutions is statistically insignicant and quantitatively small. The average marginal eect of foreign aid on economic growth remains on the other hand positive and highly statistically signicant.10
5 Further Issues
5.1 Cross-Country Parameter Heterogeneity
The log-log dierence specication (see equation (2)) implies that, cross-country dierences in the eect that a change in the level of foreign aid has on the level of GDP per capita are dierenced out. However, it is likely that also the elasticity eect of foreign aid on GDP per capita growth diers across countries (as would for example be suggested by a standard Solow-Swan growth model; see Section 5.2 below). To check whether parameter heterogeneity leads to a bias in the estimated average eect, I use the mean-group estimator developed by Pesaran and Smith (1995) that computes estimates country-by-country and then takes a linear average of the obtained coecients. Figure 1 plots the kernel density function of the country-specic slope estimates that are obtained from using as an instrumental variable the residual variation in foreign aid that is not driven by economic growth.11 The mean value of the country-specic slope estimates
is 0.11, and thus matches closely the estimate of the average marginal eect reported in column (1) of Table 3 from the homogenous panel xed eects model.
Beyond providing an important robustness check on the average marginal eect obtained from the homogenous panel xed eects model, the country-specic slope estimates provide useful information on the extent to which the
9See, for example, Trumball and Wall (1994), or Alesina and Dollar (2000).
10Panel B of Table 4 shows that increases in countries' Polity2 scores are associated with
signicant increases in foreign aid. While there is no signicant contemporaneous eect of economic growth on the Polity2 score when using rainfall and the international commodity price index as instruments for GDP growth (results not shown), the correlation in Panel B is unlikely to reect the true causal eect that foreign aid has on economic growth. Barro and Lee (2005) and Djankov et al. (2008), for example, provide evidence that foreign aid can have adverse eects on countries' political institutions. In this case, the estimate in Panel B of Table 4 reects a lower bound on the true causal eect that political change has on foreign aid.
11The reported estimates in Figure 1 are based on the largest possible sample (47 countries
during 1960-2000).
eect of foreign aid on economic growth varies across countries. The interquar-tile range of the country-specic slope estimates is [0.05,0.15], with a sample minimum (maximum) of -0.02 (0.35). Hence, there is quite a bit of variation in the marginal eect that foreign aid has on economic growth across countries, which raises the interesting policy question of what determines this cross-country variation.
One explanation for the cross-country variation in the marginal eect of for-eign aid on economic growth are cross-country dierences in economic policies. Burnside and Dollar (2000) argued that the marginal eect of foreign aid on economic growth is particularly high in countries where policy-induced distor-tions to economic activity are relatively small because in these countries aid is more likely to be invested.12 Figure 2 examines this claim empirically by
plot-ting the country-specic slope estimates against the Burnside and Dollar (2000) policy index that captures cross-country dierences in trade policy, ination, and budget balance. The scatter plot shows a positive relationship between the country-specic slope estimates and the (period-average) BD policy index. Using the bootstrap to take into account the relatively small number of obser-vations, a bivariate regression yields a coecient on the BD policy index of 0.04 that has a t-value of 1.86. Hence, this is supportive evidence for the Burnside and Dollar claim that foreign aid is particularly eective in stimulating economic growth in countries with good macroeconomic policies.
Dalgaard et al. (2004) found that aid is signicantly less eective in the tropics. As noted by Rajan and Subramanian (2008), there is little theoretical reason for why one would expect a systematically smaller eect of foreign aid on economic growth in countries which are located in the tropics. Figure 3 shows that regressing the country-specic slope estimates on the share of tropical terrain yields a negative, but statistically insignicant relationship.
Another argument for cross-country heterogeneity in the marginal eect of foreign aid on economic growth, that has been popular in both academic and policy circles, are nancing constraints (see e.g. Sachs, 2005). Domestic and, in particular, rural nancial markets are often ill-functioning (or simply non-existant) in many of the LDCs so that high return projects go unrealized be-cause (rural) investors fail to obtain nance for their projects. An aid inow may have a high return if it successfully targets high return projects and eases nancing constraints in the (rural) nancial markets. Figure 4, Panels A-C ex-plore the role of such nancing constraints by plotting the country-specic slope estimates against various indicators proxying the severity of nancial market im-perfections. Panel A plots the relationship between the country-specic slope estimates and the World Bank credit information index that captures the avail-ability of credit information from either a public registry or a private bureau to facilitate lending decisions. Panel B plots the relationship between the country-specic slope estimates and the percentage share of individuals and rms listed in a public or private credit registry with current information on repayment his-tory, unpaid debts, or credit outstanding. And, to capture that credit market
12For a critique, see Easterly et al. (2004).
imperfections are often most severe in rural areas of developing countries Panel C plots the relationship between the country-specic slope estimates and the percentage share of the population living in rural regions. The main conclusion is that the marginal eect of foreign aid on economic growth is signicantly in-creasing in these proxies for cross-country dierences in the severity of nancing constraints. Hence, the common argument in favor of foreign aid the nancing problem nds support in the data.
A strand of the aid eectiveness literature has argued that there exists a political economy resource curse of foreign aid on economic growth: in countries with multiple powerful groups aid inows may lead to costly rent-seeking activity (e.g. Svensson, 2000; Reinikka and Svensson, 2004). Figure 5, Panels A and B explore this channel by plotting the relationship between the country-specic slope estimates and two measures that capture countries' ethnic fragmentation. Panel A plots the relationship using an index of ethnic fractionalization and Panel B plots the relationship using an index of ethnic polarization.13 Both
gures show a downward sloping relationship. Statistically the relationship is however only signicant at conventional condence levels for the measure of ethnic fractionalization, which may suggest that aid inows can be a curse primarily due to the common pool problem, rather than because they directly increase the likelihood of civil conict.14
5.2 Comparison of IV Estimates to the Predicted Eect
from a Solow-Swan Growth Model
A useful way to check whether the instrumental variables estimates of the aver-age marginal eect are plausible not only in sign but also in size is to draw on the rst-order approximation of the eect that a change in the investment rate has on the output growth rate in a simple but standard Solow-Swan growth model. The rst-order approximation yields that a 1 percent increase in the investment rate increases the output growth rate byβ α
1−α percentage points,
whereβ is the convergence rate andαthe capital-output elasticity.15 If part of
the foreign aid is used to nance domestic investment, the predicted growth rate eect (in percentage points) of a 1 percent increase in the share of aid in GDP is
β α
1−α times the marginal elasticity eect that foreign aid has on investment.16
13The fractionalization index increases with the number of groups, while the polarization
index is maximized when there are two groups which are of equal size. Both indices are between 0 and 1, with larger values denoting more fractionalization (polarization). For a discussion of conceptual dierences between polarization and fractionalization indices with an application to the conict literature, see Montalvo and Reynal-Querol (2005).
14In fact, recent research by De Ree and Nillesen (2009) shows that an increase in foreign
aid is associated with a signicant decrease in the likelihood of civil conict.
15See for example Barro and Sala-i-Martin (2003).
16Arellano et al. (2008) show in a DSGE model, where consumers are modelled to perfectly
smooth consumption over time, that whether an aid inow increases investment depends on the persistence of the aid shock. A fully permanent aid shock increases consumption, with little eect on investment a result that follows from the Permanent Income Hypothesis. It is questionable however whether the Permanent Income Hypothesis is a good approximation
Table 5 shows that on average this marginal elasticity eect of foreign aid on investment is around 0.15-0.3 percent.
To make the instrumental variables estimates comparable therefore to the predictions of the Solow-Swan growth model, and in order to obtain an estimate of the convergence rateβ, Table 6 shows that there continues to be a positive
and statistically signicant eect of foreign aid on the growth rate of GDP per capita when controlling for convergence eects in the level of GDP per capita and using instead of the log of foreign aid the log of the share of foreign aid in GDP. The system-GMM estimation (Blundell and Bond, 1998) for these dynamic regressions, where the foreign aid share is instrumented by the variation in the aid to GDP ratio that is not driven by GDP per capita growth, yields estimates on the log of the aid to GDP ratio that range between 0.05 to 0.07 for the 1960-2000 period and between 0.03 to 0.06 for the 1970-2000 period. Statistically, these estimates are signicant at the 5 percent level at least. The average annual convergence rate in the sample is estimated to be around 5 to 10 percent per annum.
With these estimates in hand, it is now possible to compare the instrumental variables estimates of the average eect that foreign aid has on economic growth to the quantitative prediction from the Solow-Swan growth model. A typical value used in the empirical growth literature for α, that is reasonable for a
Solow-Swan growth model with investment in both, physical and human capital, is 2/3 (see e.g. Durlauf et al., 2005).17 Hence, the predicted average eect of a
1 percent change in the aid to GDP ratio on the output growth rate is around 0.02 to 0.06 percentage points. This is in line with the instrumental variables estimates reported in Table 6, which range between 0.03 to 0.07.
5.3 Level Eects vs. Growth Eects
The Solow-Swan growth model predicts that a permanent increase in foreign aid aects GDP per capita growth along the transition to the new steady-state. However, due to the assumption that there are decreasing returns to scale in capital the Solow-Swan growth model predicts that an increase in foreign aid has a level eect but not a long-run growth eect. The empirical results so far are consistent with both a level eect and a growth eect. This is because the
of consumption choices in the LDCs. Empirically there exists evidence that for the LDCs the Permanent Income Hypothesis is not a good approximation, mainly because of nancing constraints (see, for example, Deaton, 1992).
17Note that in the Solow-Swan growth model there exists a tight relationship between the
convergence rate β and the output-capital elasticity α. In particular, it holds that β =
(1−α)(n+g+d), wherenand g are the population and TFP growth rates respectively,
and dis the depreciation rate (e.g. Barro and Sala-i-Martin, 2003). The average sample
population growth rate is about 2.5 percent and a reasonable value for annual TFP growth
is about 1 to 2 percent. Anαof 2/3 and an estimated convergence rate of 5 to 10 percent
would therefore require a depreciation rate of the capital stock of between 10 to 25 percent per annum. For the LDCs, where weather conditions are often extreme, this may not be unreasonable. Bu (2006), for example, presents rm data evidence for Ghana, Ivory Coast, Kenya, and Zimbabwe with average depreciation rates on xed assets (resp. machinery and equipment) that range between 10 to 20 percent (resp. 15 to 40 percent).
rst-dierence specication that relates the log-change in GDP per capita to the log-change in foreign aid has an analogous level form representation where the log of GDP per capita is related to the log of foreign aid.
To examine whether beyond a level eect an increase in foreign aid has also an eect on the long-run GDP per capita growth rate, I include as an additional right-hand-side regressor in the growth equation the log of the level of foreign aid. This approach follows the empirical growth literature that has tested for long-run growth eects of investment.18 In the growth equation, the estimated
coecient on the level of foreign aid reects the eect that foreign aid has on the long-run GDP per capita growth rate while the estimated coecient on the log-change of foreign aid reects the eect that foreign aid has on the level of GDP per capita.
Table 7 reports the estimates for the largest possible sample of 47 countries during the 1960-2000 period. The main result is that the estimated coecient on the level of foreign aid is statistically insignicant and quantitatively small. On the other hand, the estimated coecient on the log-change of foreign aid is pos-itive, highly statistically signicant, and quantitatively large. Table 7 therefore shows that a permanent increase in foreign aid has a signicant positive eect on the level of GDP per capita but an insignicant eect on the long-run GDP per capita growth rate. This result holds for both the static and the dynamic panel data model (columns (1) and (2)). And, it also holds in a distributed lag model where additional lags of foreign aid are included on the right-hand side of the estimating equation (columns (3)-(5)). In particular, the distributed lag estimates (columns (3)-(5)) show that foreign aid has a positive and sta-tistically signicant eect on GDP per capita growth on impact, and that the lagged eects are quantitatively smaller in size. The sum of the coecients on the contemporaneous and lagged log-changes of foreign aid is positive and sig-nicantly dierent from zero at the 1 percent level. Hence, a permanent increase in foreign aid has a signicant positive long-run eect on the level of GDP per capita. This result is consistent with the neoclassical Solow-Swan growth model where part of the foreign aid is used to nance domestic investment.
6 Conclusion
This paper showed as a rst main result that increases in per capita GDP growth of aid recipient countries are associated with a signicant decrease in foreign aid. Specically, the instrumental variables estimates yielded that a 1 percentage point increase in per capita GDP growth reduced foreign aid by more than 4 percent on average. This nding is consistent with the stylized cross-country fact that as countries grow richer they rely less on foreign aid. It is also consistent with donor countries acting as Good Samaritans.
The paper's nding of a quantitatively large, negative eect of economic growth on foreign aid bears an important implication for empirical research on aid eectiveness: OLS estimates which serve as a natural benchmark of
18See for example Bond et al. (2010) and the references cited therein.
comparison to are biased against nding a signicant positive average eect of foreign aid on economic growth. Hence, insignicant estimates of the eect of foreign aid on economic growth should be viewed with skepticism they may just be a consequence of an inadequately addressed negative and quantitatively large simultaneity bias.
As a second main nding, the paper showed that after the large, negative response of foreign aid to per capita GDP growth is accounted for that foreign aid did indeed have a statistically signicant positive eect on per capita GDP growth. This nding contrasts to recent empirical papers that have failed to nd a signicant positive average eect of foreign aid on economic growth. Because there is a strong tendency at the macroeconomic level for foreign aid to decrease as per capita GDP growth of aid recipient countries increases, the cards are stacked in empirical research against nding a signicant positive average eect of foreign aid on economic growth. Hence, if the reverse causality running from higher per capita GDP to less foreign aid is not properly addressed, the researcher may fail to nd a signicant positive average eect of foreign aid on economic growth and possibly conclude that foreign aid does not have a systematic positive average eect on per capita GDP growth.
7 References
Alesina, A. and D. Dollar (2000). "Who Gives Foreign Aid to Whom and Why?" Journal of Economic Growth 5: 33-63.
Alesina, A. and B. Weder (2002). "Do Corrupt Governments Receive Less Foreign Aid?" American Economic Review 92: 1126-37.
Andrews, D. and J. Stock (2005). "Inference with Weak Instruments." NBER Technical Paper No. 0313.
Arellano, C., A. Bulir, T. Lane, and L. Lipschitz (2008). The Dynamic Im-plications of Foreign Aid and Its Variability. Journal of Development Economics 88: 87-102.
Barro, R. and X. Sala-i-Martin (2003). Economic Growth. MIT Press, 2nd edition.
Barro, R. and J. Lee (2005). IMF Programs: Who is Chosen and What Are the Eects. Journal of Monetary Economics 52: 1245-1269.
Blanchard, O. and R. Perotti (2002). "An Empirical Characterization of the Dynamic Eects of Changes in Government Spending and Taxes on Out-put." Quarterly Journal of Economics 117: 1329-1368.
Blundell, R. and S. Bond (1998). "Initial Conditions and Moment Restrictions in Dynamic Panel Data Models." Journal of Econometrics 87: 115-143. Bond, S., A. Leblebicioglu, and F. Schiantarelli (2010). Capital Accumulation
and Growth: A New Look at the Empirical Evidence. Journal of Applied Econometrics, forthcoming.
Bourguignon, F. and M. Sundberg (2007). "Aid Eectiveness Opening the Black Box." American Economic Review 97: 316-321.
Burnside, C. and D. Dollar (2000). "Aid, Policies, and Growth." American Economic Review 90: 847-868.
Brückner, M. and A. Ciccone (2010a). "Rain and the Democratic Window of Opportunity." Econometrica, forthcoming.
Brückner, M. and A. Ciccone (2010b). "International Commodity Price Shocks, Growth, and the Outbreak of Civil War in Sub-Saharan Africa." Economic Journal 120: 519-534.
Bu, Y. (2006). "Fixed Capital Stock Depreciation in Developing Countries: Some Evidence from Firm Level Data." Journal of Development Studies 42: 881-901.
Dalgaard, C., H. Hansen, and F. Tarp (2004). "On the Empirics of Foreign Aid and Growth." Economic Journal 114: 191-216.
Djankov, S., J. Montalvo, and M. Reynal-Querol (2008). "The Curse of Aid." Journal of Economic Growth 13: 169-194.
De Ree, J. and E. Nillesen (2009). Aiding violence or peace? The impact of foreign aid on the risk of civil conict in sub-Saharan Africa. Journal of Development Economics 88: 301-313.
Deaton, A. (1992). "Household Savings in LDCs: Credit Markets, Insurance, and Welfare." Scandinavian Journal of Economics 94: 253-273.
Deaton, A. (1999). "Commodity Prices and Growth in Africa." Journal of Economic Perspectives 13 (3): 23-40.
Deaton, A. (2005). "Measuring Poverty in a Growing World (Or Measuring Growth in a Poor World)." Review of Economics and Statistics 87 (1):1-19. Devarajan, S., and V. Swaroop (1998). "The Implications of Foreign Aid Fungibility for Development Assistance." Policy Research Working Paper No. 2022, World Bank.
Dollar, D. and A. Kraay (2002). "Growth is Good for the Poor." Journal of Economic Growth 7: 195-225.
Durlauf, S., P. Johnson, and J. Temple (2005). "Growth Econometrics." Handbook of Economic Growth (Aghion and Durlauf, eds.), North-Holland, 2005.
Easterly, W. (2003). "Can Foreign Aid Buy Growth?" Journal of Economic Perspectives 17: 23-48.
Easterly, W., R. Levine, and D. Roodman (2004). "Aid, Policies, and Growth: A Comment." American Economic Review 94: 774-778.
EM-DAT (2009). "EM-DATA: The OFDA/CRED International Disasters Database." Universite Catholique de Louvain, Brussels, Belgium.
Hadi, A. (1992). "Identifying Multiple Outliers in Multivariate Data." Journal of the Royal Statistical Society 54: 761-771.
Hadri, K. (2000). "Testing for Stationarity in Heterogeneous Panel Data." Econometrics Journal 3: 148-161.
Hansen, H. and F. Tarp (2001). "Aid and Growth Regressions." Journal of Development Economics 64: 547-70.
Heston, A. (1994). "A Brief Review of Some Problems in Using National Accounts Data in Level of Output Comparisons and Growth Studies." Journal of Development Economics 44: 29-52.
Heston, A., Summers, R., and B. Aten (2006). Penn World Table Version 6.2. Center for International Comparisons of Production, Income and Prices, University of Pennsylvania, September 2006.
Im, K., M. Pesaran, and Y. Shin (2003). "Testing for Unit Roots in Heteroge-neous Panels." Journal of Econometrics 115: 53-74.
Miguel, E., S. Satyanath, and E. Sergenti (2004). "Economic Shocks and Civil Conict: An Instrumental Variables Approach." Journal of Political Economy 112 (41): 725-753.
Mitchell, T., Carter, T., Jones, P., Hulme, M., and M. New (2003). "A Com-prehensive Set of High-Resolution Grids of Monthly Climate for Europe and the Globe: The Observed Record (1901-2000) and 16 Scenarios (2001-2100)." Tyndall Centre for Climate Change Research.
Montalvo, Jose and Marta Reynal-Querol (2005). Ethnic Polarization, Po-tential Conict, and Civil War. American Economic Review 95: 796-816. Pesaran, M. and R. Smith (1995). Estimating Long-Run Relationships from
Dynamic Heterogeneous Panels. Journal of Econometrics 68: 79-113. Rajan, R. and A. Subramanian (2008). "Aid and Growth: What Does the
Cross-Country Evidence Really Show?" Review of Economics and Statis-tics 90: 643-665.
Reinnika, R. and J. Svensson (2004). Local capture: evidence from a govern-ment transfer program in Uganda. Quarterly Journal of Economics 119: 679-705.
Sachs, J. (2005). The End of Poverty: Economic Possibilities for Our Time. Penguin Press: New York, 2005.
Stock, J. and M. Yogo (2005). "Testing for Weak Instruments in Linear IV Re-gression." In Identication and Inference for Econometric Models: Essays in Honor of Thomas Rothenberg, ed. D. Andrews and J. Stock, 80-108, Cambridge: Cambridge University Press.
Svensson, J. (2000). Foreign aid and rent-seeking. Journal of International Economics 51: 437-461.
Temple, J. (2010). "Aid and Conditionality." Handbook of Development Eco-nomics 5: 4416-4522.
Trumbull, W. and H. Wall (1994). "Estimating Aid-Allocation Criteria with Panel Data." Economic Journal 104: 876-882.
Westerlund, J. (2007). "Testing for Error Correction in Panel Data." Oxford Bulletin of Economics and Statistics 69: 709-748.
World Bank (2009). World Development Indicators. Online Database.
8 Technical Appendix
8.1 Adjustment of the Simultaneity Bias
This appendix shows formally why an instrumental variables estimator, that uses the variation in foreign aid which is not driven by economic growth as an instrumental variable for foreign aid is immune to the simultaneity bias. For clarity, let us consider the simplest possible simultaneous equation model:
GDP =γ1Aid+u (5)
Aid=γ2GDP+e (6)
The probability limit of the OLS estimator ofγ1in equation (5) is:
γ1OLS =γ1+
cov(Aid, u)
var(Aid) (7)
Substituting equation (5) into (6), and rearranging yields the equilibrium con-dition:
Aid= 1 1−γ1γ2
(γ2u+e) (8)
Hence, by substitution of equation (8) into (7) yields
γ1OLS=γ1+
γ2
1−γ1γ2
var(u)
var(Aid)+ 1 1−γ1γ2
cov(e, u)
var(Aid), (9)
where the second term on the right-hand side of equation (9) captures the si-multaneity bias that arises ifγ26= 0in equation (6), and the third term captures
the omitted variables bias.19
Suppose now that one is able to obtain a consistent estimate ofγ2in equation
(6).20 Using this consistent estimate, one can construct an aid seriesAid∗ that
is adjusted for the endogenous response (i.e. Aid∗ =Aid−γ2GDP) and use
this variable as an instrument for the original aid variableAidin equation (5).
The probability limit of this IV estimator is
γ1IV = cov(Aid
∗, GDP)
cov(Aid∗, Aid) =γ1+
cov(Aid∗, u)
cov(Aid∗, Aid) =γ1+
cov(e, u)
cov(e, Aid). (10)
Hence, the IV estimator that uses the endogeneity adjusted aid seriesAid∗ as
an instrument forAiddoes not suer from the simultaneity bias.
19To see that the third term in equation (9) captures the omitted variables bias, setγ2= 0.
In this caseAid=uand the probability limit of the OLS estimator is simplyγ1+covvar(Aid,e(Aid)).
20Of course, this can only be done by having a valid instrument for GDP in equation (6).
OLS cannot provide in equation (6) a consistent estimate forγ2 if in equation (5)γ16= 0.
8.2 Size of the Omitted Variables Bias
Regarding the size of the omitted variables bias of the IV estimator (OV BIV)
that arises ifcov(e, u)6= 0, note that the second term in equation (10) simplies
to
OV BIV = (1−γ1γ2)
cov(e, u)
var(e) +γ2cov(e, u)
. (11)
The third term in equation (9) that captures the omitted variables bias of the least squares estimator (OV BIV) simplies to
OV BLS= (1−γ1γ2)
cov(e, u)
var(e) +γ2
1var(u) + 2γ2cov(e, u)
. (12)
Depending onγ2
1var(u)and the sign and size of γ2cov(e, u), the omitted
vari-ables bias of the IV estimator may, therefore, be smaller or larger than the omitted variables bias of the least squares estimator.
9 Data Appendix
Chapter 2: Fiscal Expansions Can Increase
Unem-ployment (Joint with Evi Pappa)
1 Introduction
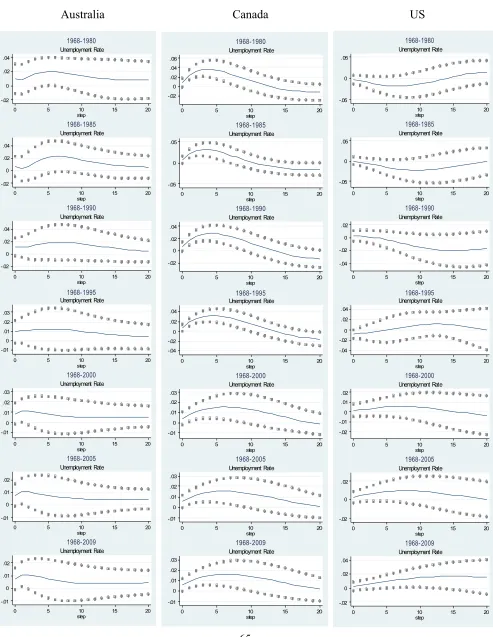
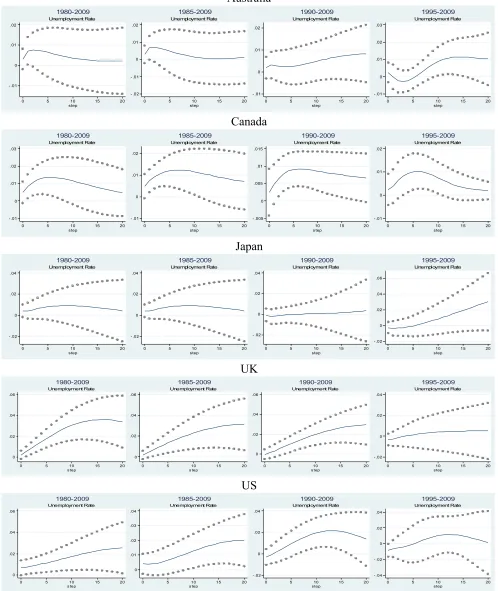
Most macroeconomists would agree that expansionary scal policy stimulates employment and lowers unemployment. Indeed, existing studies for the US economy (see, Ravn and Simonelli (2007) and Monacelli et al. (2010)) conrm this conventional wisdom. Our empirical analysis extends the literature by studying the eects of scal policy on unemployment in other OECD countries and shows, rst, that increases in government spending can actually increase unemployment in many OECD countries and, second, that the existing evidence for the US is not robust to the sample period considered. We show that the unemployment response to government spending increases in the US is highly sensitive to the time period analyzed. For samples before 1980 and samples after 1995 unemployment decreases after a scal expansion, but for samples after 1980 the opposite is true. Our empirical work also shows that this time-heterogeneity is specic to the US. For the other OECD countries and all time periods we have considered increases in government spending are in general accompanied by increases in the unemployment rate. The fact that scal expansions increase unemployment is somewhat surprising. Yet, it is robust, in the sense that it holds for a number of OECD countries and sample periods and a variety of VAR specications and identication schemes that one can use to extract scal shocks from the data.
Despite the diculties in their identication, economists have tried to char-acterize the responses of macroeconomic variables such as investment, consump-tion and output to scal disturbances. Blanchard and Perotti (2002), Perotti (2004) and Gali et al. (2007) use the restriction that government spending does not contemporaneously react to changes in macrovariables to identify s-cal shocks. Ramey and Shapiro (1998), Edelberg et al. (1999), and Burnside et al. (2004) identify scal shocks as episodes of signicant exogenous and unfore-seen increases in government spending in national defense.1 Canova and Pappa
(2007) and Mountford and Uhlig (2009) identify scal shocks using sign restric-tions. Pappa (2009a), using robust theoretical sign restrictions, was the rst to investigate for the US the eects of scal shocks on labor market variables such as the real wage and employment. The analysis we conduct here considers many more labor market variables, covers as many as ten OECD countries, and focuses attention on the dynamics of the unemployment rate. Determining how the un-employment rate responds to scal expansions is important because many scal packages in the real world are typically designed to "create jobs" and because models have recently been proposed to explain its time series properties.
Our empirical analysis shows that the unemployment rate can increase
sig-1Depending on the identication approach the results on the eects of government spending
on private consumption dier. Perotti (2007) critically reviews this literature.
nicantly in response to government expenditures shocks in many OECD coun-tries. Results are robust to alternative identication schemes, the inclusion of control variables and dierent sub-periods for most countries but the US where the response of unemployment to scal shocks seems to have changed pattern substantially over time. In addition, we document that scal expansions tend to increase the participation rate, the employment rate and the real wage.
Our empirical ndings are dicult to reconcile with existing theoretical mod-els for several reasons. First, analyzing the eects of government spending shocks on unemployment in standard RBC and NK models is impossible since standard versions of these models only allow for movements in hours worked and/or employment. Second, even if we incorporate the Diamond-Mortensen-Pissarides search and matching model into standard frameworks, as suggested in Andolfatto (1996), or Walsh (2005), we cannot account for the responses of the participation rate in these models participation is constant. But, even dis-regarding participation choices, simultaneously generating increases in output, real wages, the employment and the unemployment rate in response to scal shocks is dicult.
To circumvent these diculties we add a participation margin in a New Key-nesian model with labor market frictions as in Ravn (2008) and, in the spirit of Lindbeck and Snower (1988), we consider a labor market with insiders and outsiders. Endogenous participation generates an increase in the pool of job seekers after a scal expansion since the wealth eect induced by the shock in governments absorption increases labor market participation. The assump-tions on workers' heterogeneity and price stickiness are also crucial to generate increases in total employment and the unemployment rate. Sticky prices are necessary for inducing an increase in demand that counteracts the crowding out of vacancies due to the increase in government absorption. However, for low values of the labor supply elasticity participation does not increase enough and the increased labor demand by the sticky price rms is strong enough to fully absorb the supply of new participants. The fact that some new entrants, char-acterized as outsiders, have a less ecient matching technology guarantees that even for low values of the labor supply elasticity unemployment can increase.
Our paper is related to a number of recent works which have appeared in the literature. Relative to Monacelli et al. (2010), our model incorporates features such as endogenous participation and workers' heterogeneity that can gener-ate increases in unemployment, output, employment and the real wage after a scal expansion. Faia et al. (2010) also assume that workers are heteroge-neous and introduce labor frictions in the form of labor turnover costs but do not examine the dynamics of unemployment or labor participation in response to scal shocks. Finally, Gomes (2009) uses a two-sector dynamic stochastic general equilibrium model with search and matching frictions to study the la-bor market eects of shocks to public sector employment and wages. In his model unemployment decreases in response to generic government consumption shocks.
The remainder of the paper is organized as follows. Section 2 describes the econometric framework. Section 3 presents the main empirical results. The