ADVERTIMENT. La consulta d’aquesta tesi queda condicionada a l’acceptació de les següents condicions d'ús: La difusió d’aquesta tesi per mitjà del servei TDX (www.tesisenxarxa.net) ha estat autoritzada pels titulars dels drets de propietat intel·lectual únicament per a usos privats emmarcats en activitats d’investigació i docència. No s’autoritza la seva reproducció amb finalitats de lucre ni la seva difusió i posada a disposició des d’un lloc aliè al servei TDX. No s’autoritza la presentació del seu contingut en una finestra o marc aliè a TDX (framing). Aquesta reserva de drets afecta tant al resum de presentació de la tesi com als seus continguts. En la utilització o cita de parts de la tesi és obligat indicar el nom de la persona autora.
ADVERTENCIA. La consulta de esta tesis queda condicionada a la aceptación de las siguientes condiciones de uso: La difusión de esta tesis por medio del servicio TDR (www.tesisenred.net) ha sido autorizada por los titulares de los derechos de propiedad intelectual únicamente para usos privados enmarcados en actividades de investigación y docencia. No se autoriza su reproducción con finalidades de lucro ni su difusión y puesta a disposición desde un sitio ajeno al servicio TDR. No se autoriza la presentación de su contenido en una ventana o marco ajeno a TDR (framing). Esta reserva de derechos afecta tanto al resumen de presentación de la tesis como a sus contenidos. En la utilización o cita de partes de la tesis es obligado indicar el nombre de la persona autora.
PhD Dissertation
FUSING PROSODIC AND ACOUSTIC
INFORMATION
FOR SPEAKER RECOGNITION
Mireia Farr´
us i Cabeceran
Thesis advisor:
F. Javier Hernando Peric´
as
PhD Dissertation
F
USING
P
ROSODIC AND
A
COUSTIC
I
NFORMATION
FOR
R
OBUST
S
PEAKER
R
ECOGNITION
Mireia Farrús Cabeceran
Thesis advisor
Prof. Dr. Javier Hernando Pericás
TALP Research Center, Speech Processing Group
Department of Signal Theory and Communications
Universitat Politècnica de Catalunya
Barcelona, April 2008
TALP Research Center, Speech Processing Group
Department of Signal Theory and Communications
Universitat Polit`ecnica de Catalunya
Automatic speaker recognition is the use of a machine to identify an individual from a spoken sentence. Recently, this technology has been undergone an increasing use in applications such as access control, transaction authentication, law enforcement, forensics, and system customisation, among others.
One of the central questions addressed by this field is what is it in the speech signal that con-veys speaker identity. Traditionally, automatic speaker recognition systems have relied mostly on short-term features related to the spectrum of the voice. However, human speaker recognition relies on other sources of information; therefore, there is reason to believe that these sources can play also an important role in the automatic speaker recognition task, adding complemen-tary knowledge to the traditional spectrum-based recognition systems and thus improving their accuracy.
The main objective of this thesis is to add prosodic information to a traditional spectral system in order to improve its performance. To this end, several characteristics related to human speech prosody —which is conveyed through intonation, rhythm and stress— are selected and combined with the existing spectral features. Furthermore, this thesis also focuses on the use of additional acoustic features —namely jitter and shimmer— to improve the performance of the proposed spectral-prosodic verification system. Both features are related to the shape and dimension of the vocal tract, and they have been largely used to detect voice pathologies.
Since almost all the above-mentioned applications can be used in a multimodal environment, this thesis also aims to combine the voice features used in the speaker recognition system together with other biometric identifiers —face— in order to improve the global performance. To this end, several normalisation and fusion techniques are used, and the final fusion results are improved by applying different fusion strategies based on sequences of several steps. Furthermore, multimodal fusion is also improved by applying a histogram equalisation to the unimodal score distributions as a normalisation technique.
El reconeixement autom`atic del locutor ´es la utilitzaci´o d’una m`aquina per identificar un individu a partir de d’un missatge parlat. Recentment, aquesta tecnologia ha experimentat un increment en l’´us de diverses aplicacions com el control d’acc´es, l’autenticaci´o de transaccions, la cooperaci´o amb la just´ıcia, l’anal´ıtica forense o la personalitzaci´o de serveis, entre d’altres.
Una de les q¨uestions centrals que es tracten en aquest camp ´es el fet de saber quina part del senyal de veu cont´e informaci´o del locutor. Tradicionalment, els sistemes de reconeixement autom`atic del locutor s’han basat principalment en caracter´ıstiques relacionades amb l’espectre de la veu. No obstant, els humans utilitzen altres fonts d’informaci´o per recon`eixer locutors, de manera que hi ha motius per pensar que aquestes fonts poden tenir un paper important en la tasca de reconeixement autom`atic del locutor, aportar coneixement complementari als sistemes de tradicionals basats en l’espectre de la veu i millorar-ne la precisi´o.
L’objectiu principal d’aquesta tesi ´es incorporar informaci´o pros`odica a un sistema espec-tral tradicional per tal de millorar-ne el funcionament. Amb aquesta finalitat, diverses carac-ter´ıstiques relacionades amb la pros`odia —constitu¨ıda per elements d’entonaci´o, ritme i accent— es seleccionen i es combinen amb les caracter´ıstiques espectrals existents. A m´es a m´es, la tesi tamb´e se centra en la utilitzaci´o de caracter´ıstiques ac´ustiques addicionals —a saber, jitter i
shimmer— per millorar el funcionament del sistema de verificaci´o espectral-pros`odic proposat. Totes dues caracter´ıstiques estan relacionades amb la forma i la dimensi´o del tracte vocal, i s’han utilitzat en gran part per detectar patologies de la veu.
La majoria d’aplicacions que s’han esmentat abans es poden utilitzar en un entorn multi-modal; per aquest motiu, les caracter´ıstiques de veu utilitzades en el sistema de reconeixement del locutor tamb´e es combinen amb altres identificadors biom`etrics —concretament, la cara— per tal de millorar el funcionament global del sistema. Amb aquest objectiu, s’utilitzen diverses t`ecniques de normalitzaci´o i de fusi´o, i els resultats de la fusi´o final es milloren aplicant difer-ents estrat`egies de fusi´o basades en seq¨u`encies de passos. A m´es a m´es, la fusi´o multimodal tamb´e es millora aplicant una equalitzaci´o d’histogrames com a t`ecnica de normalitzaci´o a les distribucions de puntuacions unimodals.
Confesso que he estat molt temptada de deixar aquesta p`agina en blanc per un sol motiu: no sabia com comen¸car. Per`o al final he fet un balan¸c de motius: en tinc molt´ıssims per donar les gr`acies i un de sol per no fer-ho. I com que d’alguna manera he de comen¸car, he decidit optar per l’ordre cron`ologic. Aix´ı doncs...
... gr`acies, N´uria Bel. Et pertoca ser la primera pel post-it groc on vas escriure
Javier Hernando UPC
i per aconsellar-me que fes la tesi amb ell. Va ser, sens dubte, un gran consell. Gr`acies, Ramon, per escoltar la meva hist`oria sobre el post-it groc i ajudar-me en els primers passos. I gr`acies, Javier, per haver acceptat ser el meu director de tesi tal com deia el post-it groc, i pel teu suport durant aquests anys.
Despr´es del post-it groc va venir l’abisme: qu`e ´es aix`o del cepstrum i qu`e hi faig aqu´ı. Confesso tamb´e que el primer dia vaig estar temptad´ıssima d’anar-me’n a casa i no tornar; per`o els altres doctorands em van donar molts motius per no fer-ho. Gr`acies Jan, Pere, M`onica, Pablo, Jordi, Josep Maria, Marta Casar, Marta Costa-Juss`a (germaneta!), Andrey, Cristian, Enric, Mart´ı i molts m´es. Per fer-me reflexionar sobre el car`acter acumulatiu de les monedes i l’efecte afrodis´ıac dels microones, pels avions de paper, les magdalenes de la FIB i molt´ıssimes coses m´es. Gr`acies, Xavi, per ser el meu inform`atic incondicional durant el primer any de l’abisme. Gr`acies tamb´e al Carlos Nistal per escoltar sempre amb un somriure les meves perip`ecies inform`atiques, al Pascual per ajudar-me pacientment amb els experiments sempre que l’hi he demanat, i als que heu fet possible l’´ultim cap´ıtol de la tesi: Adri`a, Jordi Ventura, Queco, Cesc i V´ıctor Polo.
Als que vau fer que l’hivern suec a vint-i-tres graus sota zero fos una mica m´es c`alid: Kirk, Tomas (per trobar-me un sostre), Urban, Linnea, Misuzu, Fredrik (avui tampoc et preguntar´e per les plantes), Erik, Mattias, Leila, Thierry, Elisabeth i Ingmarie, tak so mycket. I gr`acies als que, molt lluny d’aqu´ı a l’altra banda del m´on —sense ser barrufets— vau fer que em sent´ıs com a casa; gr`acies, Michael, per fer possible l’estada a Austr`alia, gr`acies Peter i Del per fer-me de pares durant sis mesos, gr`acies Ian i Elizabeth per portar-nos a platges amb taurons i meduses mortals i per la vostra companyia; gr`acies Girija, Zoe, Rod, Claudia, Diane, Dave i Ford Laser, cangurs, cacatues, pelicans, ibis i roselles. Us tinc a tots en un trosset del meu cor, i el meu enyorament ´es tan gran com el meu agra¨ıment. I gr`acies, Jan, per compartir-ho amb mi i pel primer Ambalindum. Espero que n’hi hagi molts m´es.
Abstract i
Resum ii
Agra¨ıments iv
1 Introduction 1
1.1 Speaker recognition applications . . . 1
1.2 Motivation and objectives . . . 3
1.3 Thesis overview . . . 4
2 State of the Art in Speaker Recognition 7 2.1 Biometrics . . . 8
2.1.1 Biometric identifiers . . . 9
2.1.2 Automatic biometric recognition systems . . . 11
2.1.3 Application areas of biometric recognition . . . 14
2.2 Speaker recognition . . . 16
2.2.1 Auditory and automatic speaker recognition . . . 16
2.2.2 Speaker information contained in the speech signal . . . 17
2.2.3 Automatic speaker recognition techniques . . . 22
2.3 Prosody in speaker recognition . . . 33
2.3.1 Prosodic elements in speech . . . 33
2.3.2 Prosodic models . . . 35
2.4 Multimodal fusion . . . 38
2.4.1 Feature-level fusion . . . 39
viii CONTENTS
2.4.3 Decision-level fusion . . . 47
2.5 Voice imitation and conversion . . . 48
2.5.1 Voice imitation . . . 48
2.5.2 Voice conversion . . . 52
2.5.3 System robustness to voice imitation and conversion . . . 54
3 Using Prosody, Jitter and Shimmer for Speaker Recognition 57 3.1 Spectral baseline system . . . 58
3.2 Prosodic system . . . 59
3.2.1 Description of the prosodic features . . . 59
3.2.2 Experiments on individual features . . . 62
3.2.3 Fusion of prosodic features . . . 65
3.3 Fusion of spectral and prosodic parameters . . . 67
3.4 Jitter and shimmer . . . 68
3.4.1 Jitter and shimmer measurements . . . 69
3.4.2 Verification experiments . . . 71
3.5 Fusion of jitter and shimmer with prosodic and spectral features . . . 72
3.6 Conclusions . . . 74
4 A Voice and Face Biometric System using HE-SVM 77 4.1 Speech and face parameters . . . 77
4.2 Histogram equalisation . . . 79
4.3 Multimodal database . . . 82
4.4 Multimodal fusion experiments . . . 83
4.4.1 Fusion strategies using MW and SVM . . . 83
4.4.2 HE-SVM multimodal fusion . . . 87
4.4.3 MW, SVM and HE-SVM using a reduced database . . . 89
4.5 Conclusions . . . 92
5 Robustness Analysis to Imitated and Converted Voices 95 5.1 Dialect and accent imitation . . . 95
5.1.1 Perception experiment on English dialects . . . 96
5.1.3 Automatic speaker recognition experiment . . . 98
5.1.4 Results . . . 98
5.1.5 Discussion and conclusion . . . 98
5.2 Vulnerability of prosodic and acoustic features to voice imitation . . . 101
5.2.1 Material . . . 101
5.2.2 Experimental setup . . . 103
5.2.3 Identification results . . . 104
5.2.4 Conclusions . . . 106
5.3 Robustness analysis to converted voices . . . 106
5.3.1 Voice synthesis system . . . 106
5.3.2 Voice conversion method . . . 110
5.3.3 Voice conversion database . . . 112
5.3.4 Speaker identification using original and converted voices . . . 112
5.4 Conclusions . . . 117
6 Conclusions and Future Work 119 6.1 Conclusions . . . 119
6.2 Future work . . . 120
2.1 Architecture of a typical biometric recognition system. . . 11
2.2 Automatic identification system. . . 12
2.3 Automatic verification system. . . 13
2.4 FRR and FAR as a function of a threshold θ. The intersection point determines the EER. . . 14
2.5 Examples of a ROC curve and the corresponding DET curve . . . 15
2.6 Human vocal system. . . 18
2.7 Waveform and spectrogram for a female voice speech sentence. . . 19
2.8 Schematic representation of the speech production system. . . 19
2.9 Linear speech production model. . . 20
2.10 Output energy spectrum as a combination of a laryngeal source and a vocal tract filter function. . . 20
2.11 Spectral coefficients extraction process. . . 24
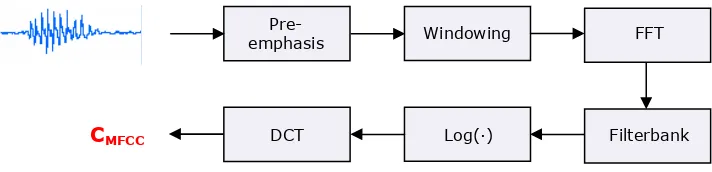
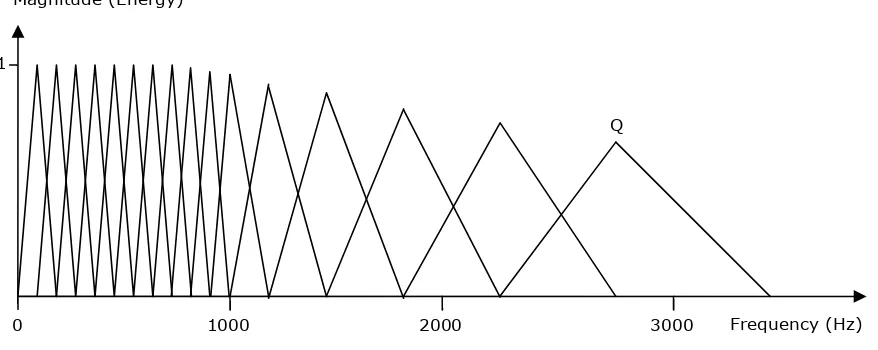
2.12 Mel-frequency cepstral coefficients extraction process. . . 24
2.13 Example of a mel-scale filterbank representation for a set of 16 coefficients. . . . 25
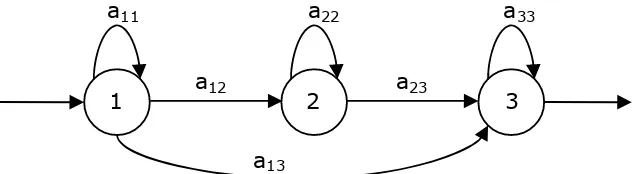
2.14 Example of a three-state hidden Markov model. . . 28
2.15 Fundamental frequency and intensity contours of a female utterance . . . 35
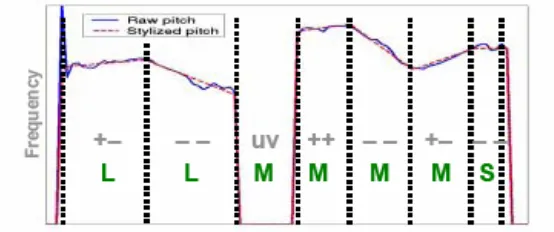
2.16 State symbol sequence estimation for F0 and energy contours. . . 37
2.17 Symbol sequence for F0 and energy contours tagged with quantised duration: short , medium and long. . . 37
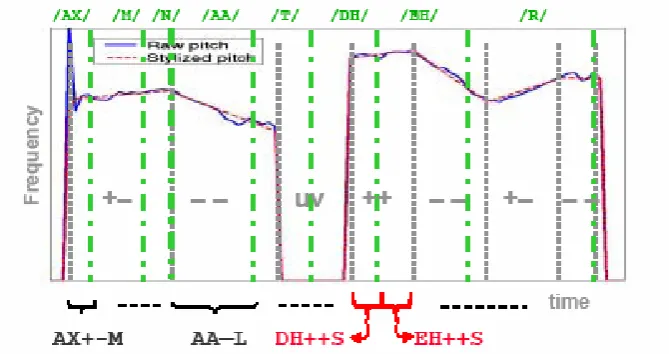
2.18 Phoneme context information added to F0 slope and duration features. . . 38
2.19 Biometric verification process using one single biometric. . . 39
2.20 Verification process using fusion of two biometric modalities at the score level. . 42
xii LIST OF FIGURES
3.1 Example of a F0 contour stylisation using a frequency resolution of 2 semitones. Green big points indicate the stylised F0 contour and grey small points correspond
to the original F0 points. . . 61
3.2 EER for each prosodic feature using three different distances: Euclidean, Ma-halanobis and Kullback-Leibler divergence, the 3rd nearest neighbour and splits 1-6. . . 64
3.3 DET curves for the overall fusion of 13 prosodic features combining two normal-isation techniques (min-max and z-score) with two types of fusion (simple sum and matcher weighting). . . 66
3.4 DET curve showing the fusion of 2 features related to segment duration, the fusion of 6 features related to fundamental frequency, and fusion of all 8 features, using z-score normalisation and matcher weighting technique. . . 66
3.5 Jitter measurement for N=5 F0 periods. . . 69
3.6 Shimmer measurement for N=5 F0 periods. . . 70
3.7 DET curves for prosodic and spectral systems before and after adding jitter and shimmer features. . . 73
3.8 DET plot showing the improvement of the baseline system after adding jitter and shimmer. . . 74
4.1 A set of 25 basis images for NMF and NMF-faces. . . 79
4.2 Histogram equalisation: matching of the cumulative distribution. . . 81
4.3 Bimodal prosodic-spectral system fused in one and two steps, and bimodal spectral-facial system . . . 84
4.4 One-step fusion strategy for a trimodal system. . . 85
4.5 Two-step fusion strategies for a trimodal system. . . 86
4.6 Three-step fusion strategy for a trimodal system. . . 87
5.1 Recording session at Technical University of Catalonia. . . 102
5.2 IER for each prosodic feature (and fusion) using 1st NN and 10 sentences for training. . . 105
5.3 Identification of each converted voice using 30 sentences in the transformation function. Green, yellow and red bars indicate source,target and other identifica-tion, respectively. . . 116 5.4 Identification of intra-gender and cross-gender conversions using 30 training
2.1 Comparison of several biometric identifiers. . . 11
2.2 Application areas of biometric recognition. . . 16
2.3 Linguistic levels and their corresponding object of study. . . 21
2.4 Some of the most commonly used score normalisation methods. . . 44
2.5 Some of the most commonly used score fusion methods based on the combination approach. . . 46
2.6 AND an OR fusion of decisions for a case of two biometric modalities. . . 47
2.7 Types of voice disguise based on Rodman’s classification. . . 48
2.8 Voice imitation areas, aims and characteristics. . . 49
2.9 Voice conversion applications. . . 53
3.1 EER for each prosodic feature using different distance measurements and k=1 . . 63
3.2 EER for each prosodic feature using different distance measurements and k=3 . . 63
3.3 EER for each prosodic feature combination using min-max and z-score normali-sations, and simple sum and matcher weighting fusion techniques. . . 65
3.4 EER for prosodic feature sets combined with spectral parameters, using min-max and z-score normalisations and simple sum fusion. . . 67
3.5 EER for prosodic feature sets combined with spectral parameters, using min-max and z-score normalisations and matcher weighting fusion. . . 67
3.6 EER for jitter measurements. . . 71
3.7 EER for shimmer measurements. . . 71
3.8 EER of jitter and shimmer measurements used in the JitShim system and EER of their combination. . . 72
3.9 EER for prosodic and spectral systems before and after adding jitter and shimmer features. . . 73
xiv LIST OF TABLES
4.2 EER for each prosodic feature using the multimodal database. . . 84
4.3 EER for each unimodal recognition system. . . 84
4.4 EER for each bimodal recognition system, using ZS-MW and SVM techniques and one- and two-step fusion strategies in the prosodic-spectral system. . . 85
4.5 EERs for a trimodal system in one-step fusion using MW and SVM fusions. . . . 85
4.6 EERs for a trimodal system in two-step fusion. . . 86
4.7 EERs for three-step ZS-MW and SVM trimodal fusions. . . 87
4.8 EER for the prosodic and each bimodal recognition system using SVM and HE-SVM techniques. . . 87
4.9 EERs for a trimodal system in one-step fusion using SVM and HE-SVM techniques. 88 4.10 EERs with equalised and non-equalised scores in the best fusion strategy. . . 88
4.11 EERs obtained applying HE before trimodal two-step SVM fusion. . . 88
4.12 EERs obtained applying HE before three-step SVM fusion. . . 89
4.13 EER for each unimodal recognition system. . . 90
4.14 EER for each unimodal recognition system. . . 90
4.15 EERs for a trimodal system using ZS-MW, SVM and HE-SVM techniques in one, two and three fusion steps over the reduced database. . . 91
4.16 Summarised results for both extensive and reduced databases, using one-, two-and three-step strategies two-and ZS-MW, SVM two-and HE-SVM fusion techniques. . . 93
5.1 Speakers and their corresponding dialects involved in Experiment 1. . . 96
5.2 Speakers and their corresponding dialects and accents involved in Experiment 2. 97 5.3 Percentage of Yes-responses in Experiments 1 and 2 for Test 1 (Speaker) and Test 2 (Dialect). Italics indicate when the correct answer was No. . . 99
5.4 Percentage dialect selection (test 3) by Experiment 1 and 2 listeners. Italics indi-cates correct dialect selection where correct is defined as the dialect Imitated for the A I voices and the speakers actual dialect for the A Oam, B and C voices. . . 99
5.5 Voice assignment from the automatic speaker recognition condition 1 test, where each of Speaker A’s dialects formed a separate speaker model. . . 100
5.6 Voice assignment from the automatic speaker recognition condition 2 test, where none of Speaker A’s dialects formed a training speaker model. . . 100
5.7 Characteristics of the impersonators and the target politicians. . . 102
5.8 Mean F0 of impersonators and target voices. . . 103
5.9 IER obtained for each prosodic system after fusing all the features. . . 105
5.11 Identification matrix for two male and two female original voices. . . 113 5.12 Source,target and other identifications using 10 sentences in training the
trans-formation function. . . 113 5.13 Source,target and other identifications using 30 sentences in training the
trans-formation function. . . 114 5.14 Source,target and other identifications using 80 sentences in training the
trans-formation function. . . 115 5.15 Identification in percent of intra-gender and cross-gender conversions depending
Introduction
Speech processing by computer is a field that encompasses, among others, computer science, linguistics and speech communication. This multidisciplinary field is normally divided into three distinct subfields: speech synthesis, speech recognition and speaker classification.
Speaker classification is mainly concerned with extracting information about individuals from their speech. This includes guessing whether the speaker is male or female, adult or child, their emotional state (Hecker et al., 1968; Williams and Stevens, 1972), the language the person is speaking, the education level and social rank, or even the speaker’s nationality (Baldwin and French, 1990).
A speaker’s identity can also be determined by the speech signal. This task is known as speaker recognition, which is one of the most widely investigated subareas in speaker classifica-tion (Kersta, 1962; Stevens et al., 1968; Bolt et al., 1969; Atal, 1972; Doddington, 1985; Soong et al., 1985; Furui, 1996; Campbell, 1997; Klevans and Rodman, 1997), and the focus of this thesis.
Next, an overview of the most important applications in speaker recognition is described; the motivation and main objectives of this thesis are presented in section 1.2 and, finally, the structure and contents of the thesis are outlined in section 1.3.
1.1
Speaker recognition applications
Automatic speaker recognition is the use of a machine to identify an individual from a spoken sentence. In a human speaker recognition process, the better one knows a person, the easier it is to identify others by their speech. Like humans, automatic speaker recognition systems need a training period to learn what speech is like.
Speaker and speech recognition use similar speech signal processing techniques. However, speech recognition —if it is to be speaker independent—, focuses on those aspects of the speech signal carrying more linguistic information, whereas speaker recognition is based on those idio-syncratic speech features that characterise an individual.
2 Introduction
et al., 1969; Tosi et al., 1972). Computer technology was, at that time, not advanced enough to complement the manual work of phoneticians interpreting the spectrograms.
According to Reynolds et al. (2002), there are two main factors that make human voice a compelling characteristic to recognise people: in the first place, speech is a natural signal to produce that is not considered threatening by users to provide. Second, the telephone system provides currently a ubiquitous, familiar network of sensors for obtaining and delivering the speech signal. Therefore, nowadays, there is a wide variety and continued growth of applications based on speaker recognition technologies. The most common areas where these applications can be found are listed next.
Access control Applications related to secure access to physical and electronic site are prob-ably the most common ones. These applications have the advantage that, unlike personal passwords and keys, voices cannot be stolen. However, they can be copied by using, for instance, recording devices. In order to protect security systems from this risk, the speaker wishing to access to a secure place is usually asked to pronounce a specific text. In this case, both speaker and the linguistic content of the speech are taken into account.
Transaction authentication In addition to access control, higher levels of verification may be needed for telephone banking, for example, in order to achieve more secure transactions. Some recent applications are also focused on user authentication tasks for remote electronic purchases and both fixed telephone and mobile shopping.
Law enforcement and forensics Law enforcement includes several applications such as home-parole monitoring —where parolees are called in order to check that they are staying at home— prison call monitoring, border controls, etc. Forensic applications are highly related to law enforcement applications, especially those concerning location of missing people and criminal identification.
Speech data management The use of speaker recognition is also incipient in several applica-tions such as voice mail browsing or intelligent answering machines, where incoming voices are labeled with the speaker name. Speech data management can also be found in smart rooms to automatically track who said what, for example, in a boardroom meeting.
Personalisation More and more, a wide variety of devices and smart systems can be found to organise and facilitate our daily life. Presumably, those devices controlled by voice will perform better with a good personal customisation. Furthermore, there is also an incipient interest in using speaker characterisation in order to provide personal information to be used in advertisements or other services.
Speaker recognition applications can be classified into text-dependent and text-independent
applications. In the former, the speaker is required to pronounce the same text in both training and testing steps. In the latter, the applications do not rely on any specific spoken message. In this case, it is more difficult to achieve a good accuracy; however, the task becomes more flexible.
1.2
Motivation and objectives
One of the central questions addressed by automatic speaker recognition research is what is it in the speech signal that conveys speaker identity. We, humans, rely on several distinct types or levels of information contained in the speech signal in order to identify people from voice alone (Schmidt-Nielsen and Crystal, 2000). These can be related to diverse aspects such as the voice timbre, a characteristic laugh or specific words repeatedly used.
Traditionally, these levels of information have been roughly hierarchised from low-level to high-level information. Low-level information has been mainly associated to those features re-lated to the physical traits of the vocal apparatus —such as the voice timbre—, whereas high-level is mostly associated to those features depending on the learned habits and style —such as a particular word usage.
Automatic speaker recognition systems have relied mostly on low-level characteristics by us-ing short-term features related to the spectrum of the voice. However, other levels of information play an important role in the human recognition process, which means that they convey useful speaker information. Therefore, there is reason to believe, as recent studies have demonstrated (Carey et al., 1996; S¨onmez et al., 1998; Doddington, 2001; Andrews et al., 2002; Bartkova et al., 2002; Weber et al., 2002; Peskin et al., 2003; Reynolds et al., 2003), that these levels can add complementary knowledge to the traditional spectrum-based recognition systems, improving their accuracy. Moreover, they appear to be more robust to acoustic degradations from channel and noise effects (Atal, 1972; Carey et al., 1996).
The main objective of this thesis is to add prosodic information to the traditional spectral systems in order to improve their performance. The idea is to find and select appropriate charac-teristics related to the human speech prosody —which is conveyed through intonation, rhythm and stress— and to combine them with the existing and widely used spectral features. Such prosodic characteristics include parameters related to the fundamental frequency in order to capture the intonation contour, and other parameters such as the length of the speech segments, as well as the rate and duration of pauses, in order to represent the speaker speech tempo.
The use of prosodic features for speaker recognition requires a set of characteristics that should be taken into consideration. Just as systems relying on short-term spectral features can achieve a good performance with a reasonable low amount of training and testing data, prosodic features need much more data in order to capture the speaker prosodic style. Moreover, prosodic characteristics related to a specific speaker are especially manifested when speaking in spontaneous style. For this reason, a conversational speech database is required in order to obtain a reasonable reliable analysis. In this thesis, the Switchboard-I database will be used in the proposed prosodic recognition system in order to ensure both dimension and spontaneity requirements.
4 Introduction
of this thesis.
These complementary features are especially useful when combined within them and with the short-term spectral parameters; when used alone, the performance of individual parameters is normally too worse to be used to recognise individuals in a reliable manner. In the same way, the results achieved in a person recognition task can be improved by using more than a single biometric modality. To this end, multimodal biometric fusion combines the information from multiple modalities. As well as the use of complementary speech features for speaker recog-nition, the objectives of this thesis include the combination of such features with face related parameters in order to improve the global performance of the system. This combination of fea-tures —both within the same modality and between different modalities— involves the use of normalisation and fusion techniques. Therefore, the above-mentioned tasks include other objec-tives: to implement existing normalisation and fusion techniques, to find those techniques with which the best performance is obtained, and to try to improve the corresponding normalisation and fusion steps with new methods and strategies.
Nevertheless, although the performance of biometric recognition systems can be highly im-proved when using different biometric identifiers, these systems are still exposed to several external threats. Voice imitation and other types of disguise are, for instance, potential threats to security systems that rely on automatic speaker recognition. It is well-known that human speaker recognition can be quite reliable in small sets of people and specially when the listeners are familiar with the speakers. Even more, humans are able to identify others from voice even when their voices are disguised (Reich, 1981). However, the question arises as to how vulnera-ble automatic speaker recognition systems are against different voice disguises, such as human imitation or artificial voice conversion. The last objective of this thesis is to test the robustness of speaker recognition systems against human and synthetic voice imitation.
1.3
Thesis overview
This thesis is structured as follows. The state of the art in speaker recognition is reviewed in chapter 2. This chapter includes several parts. The first one is a brief description o biometrics, focusing on the general performance of automatic biometric recognition systems and their areas of application. The second one deals with several aspects about speaker recognition: the differ-ences between automatic and human recognition, the speaker information that can be found in the speech signal, and some of the most common automatic speaker recognition techniques. Next, the role of prosody in speaker recognition is reviewed, followed by the description of fusion techniques used to combine different biometric modalities. Finally, the chapter contains a brief state of the art in voice imitation and conversion in speaker recognition, focusing on the features and techniques normally used and their robustness against automatic recognition systems.
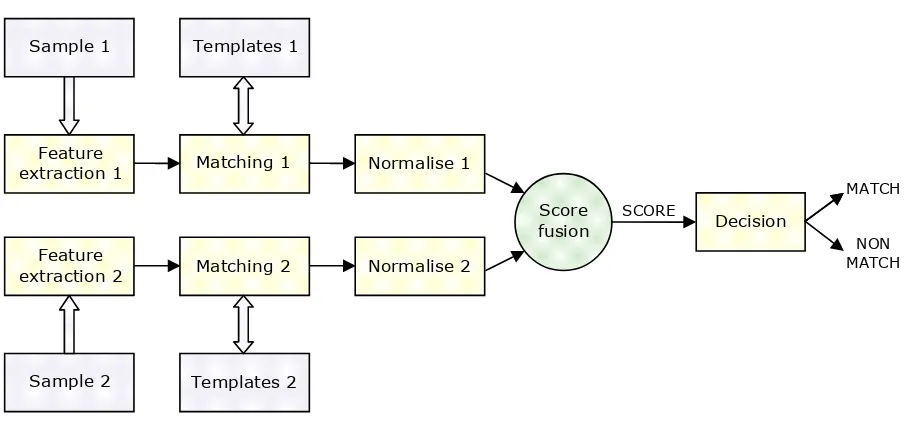
Chapter 4 focuses mainly on the importance of normalisation and fusion techniques in mul-timodal biometric recognition systems. The prosodic and spectral features used in the previous chapter are combined with facial parameters, obtaining a multimodal person recognition system based on speech and face parameters. Apart from normalisation and fusion methods used in chapter 3, fusion by support vector machines and a histogram equalisation as a normalisation technique is applied to the biometric scores. Furthermore, several fusion strategies based on the use of different fusion steps are proposed.
The experimental part of this thesis finishes in chapter 5 with an analysis of the vulnerability of the systems against imitated and converted voices. First, some experiments are performed in order to test the influence of foreign accents and dialects —as a sort of imitation— in audi-tory speaker recognition. Second, the voices of two well-known professional imitators trying to impersonate several well-known politicians are used to analyse the behaviour of some selected prosodic and acoustic features in the imitated voices. At the end of the chapter, converted voices are also used to test the robustness of speaker verification systems.
State of the Art in Speaker
Recognition
Automatic speaker recognition is the use of a machine to recognise an individual from a spoken sentence. Thus, a speaker recognition process is always concerned with extracting information about individuals from their speech.
Speech signal processing extracts features from the speech signal, which relate to the manner of sound generation in the larynx (source) on the one hand and to the acoustic filtering of the speech sounds in the vocal and nasal tracts (filter) on the other. Early automatic speaker recognition systems tended to use solely the filter parameters, which relate —in a complex way— to the physiology of the vocal tract and to the learnt articulatory configurations that shape the specific speech sounds (Rabiner and Juang, 1993). These features have also been being used in multimodal person recognition systems, where two or more human traits like voice, face, fingerprints, iris, hand geometry, etc. are involved in the recognition process.
More recently, some speaker recognition systems have begun to use also the source para-meters, which relate mainly to the fundamental frequency and power (or perceived pitch and loudness) of the speech sounds and, in turn, to the prosody of spoken phrases (Peskin et al., 2003; Reynolds et al., 2003). Generally, systems that use both source and filter parameters per-form better than systems that just use source parameters, when systems are evaluated by means of generic background models and without impostors who employ intentional voice mimicking techniques.
Some recent studies have tested the vulnerability of automatic speaker recognition systems to intentional voice mimicking (Lau et al., 2004, 2005). Such vulnerability is of particular concern where automatic speaker recognition is used to control client access in applications such as telephone banking or other financial services. Where a speaker recognition system uses both source and filter parameters, the question arises whether either the source or the filter parameters are more vulnerable to intentional mimicking. Moreover, current speech synthesis technology is more and more able to approximate the voice of a specific target speaker —as a sort of voice mimicking—, which raises the doubt about how reliable are security systems against such synthetic voices.
8 State of the Art in Speaker Recognition
recognition systems and their main applications. Section 2.2 contains a brief description of the speech production and the state of the art in current speaker recognition technologies. A more detailed report about the role of prosody in speaker recognition task is presented in section 2.3. The following section (2.4) is about fusion of different modalities, focusing on the most commonly used normalisation and fusion techniques. Finally, section 2.5 is focused on the importance of voice disguising in speaker recognition technologies.
2.1
Biometrics
More than a century ago, Alphonse Bertillon first conceived and then industriously practiced the idea of using body measurements for solving crimes (Jain et al., 1994). Nowadays, biometric recognition refers to the use of distinctive characteristics to recognise individuals (Maltoni et al., 2003; Bolle et al., 2004). These distinguishing characteristics, called biometric identifiers —or simply biometrics—, are usually classified into physiological or behavioural characteristics.
Physiological biometrics, like fingerprints, face, hand geometry, retina or iris, are physical characteristics that can be measured at some point of time. On the other hand, behavioural biometrics like, like signature, voice or gait, consist of the way some action is carried out and extend over time. Unlike physiological biometrics, behavioural biometrics are learned or acquired over time and they can be easily and deliberately changed (Bolle et al., 2004).
Nevertheless, although the classification of biometric identifiers into behavioural and phys-iological characteristics seems to be clear a priori, mostly all biometric identifiers are, in some way, a combination of both characteristics. Behavioural biometrics are related to movement or dynamics, but they are highly dependent on the physiological structure of the individual; voice and gait, for example, depend on the anatomical structure of the human vocal mechanism and the legs, respectively (Brand et al., 2001).
At this point, the question arises as to which human characteristics can be used as biometric identifiers. Maltoni et al. (2003) reported that
any human physiological and/or behavioural characteristic can be used as a biometric identifier to recognise a person as long as it satisfies the following requirements:
• Universality: each person should have the biometric.
• Distinctiveness: any two individuals should be sufficiently different in terms of their biometric identifiers.
• Permanence: the biometric should be sufficiently invariant over a period of time.
• Collectability: the biometric can be measured quantitatively.
However, in practical biometric systems, some other issues like the system accuracy, in-trusiveness (undesirable contact with the subject in order to acquire the biometric data) or acceptability (to which extent people are willing to accept a particular biometric identifier in their daily lives) should be also considered.
briefly described, focusing on their main characteristics, strengths and weaknesses, and applica-tions. These characteristics are summarised and compared in Table 2.1, according to (Maltoni et al., 2003).
2.1.1 Biometric identifiers
Face Face is one of the most acceptable biometrics, since it is one of the most common meth-ods of recognition that humans use in their visual interactions (Maltoni et al., 2003). In addition, unlike other —more reliable— methods of biometric personal identification like fingerprints, retinal or iris scan, face recognition is non-intrusive, and does not rely in the cooperation of the participants (Zhao et al., 2003).
Given still or video images of a scene, the aim is to recognise one or more individuals in the scene using a stored database of faces (Zhao et al., 2003). The main challenge is to develop face recognition techniques that can tolerate the effects of aging, facial expressions, slight variations in the imaging environment, and variations in the pose of the face with respect to the camera (Maltoni et al., 2003; Jain et al., 1994).
Fingerprints Fingerprints are the most commonly used biometrics due to their well-known distinctiveness and permanence properties over time. In 1893, the Home Ministry Office (UK) accepted that no individuals have the same fingerprints. Since then, this biometric identifier has been widely used in forensic applications for over one hundred years, and automatic fingerprint identification systems were introduced as one of the first applications of machine pattern recognition almost fifty years ago (Maltoni et al., 2003).
Fingerprints are characterised by medium universality, acceptability and collectability, and a high accuracy. Even so, fingerprint recognition is still a challenging and an important pattern recognition problem (Maltoni et al., 2003; Jain et al., 1994).
Voice Voice is not expected to have enough distinctiveness to allow the recognition of an in-dividual from a large database of speakers. Moreover, it is characterised by three other disadvantages: first, a speech signal can be degraded in quality by the microphone or the transmission channel; second, voice can be affected by a person’s health, stress or emotions; and finally, it has been shown that some people are extraordinarily skilled in mimicking others’ voices (Maltoni et al., 2003; Bolle et al., 2004).
However, voice is a non-intrusive biometric with a high acceptability. Moreover, it is nowa-days the only feasible biometric identifier in applications requiring person recognition over a telephone system, which provides a ubiquitous and familiar network of sensors for ob-taining and delivering the speech signal (Maltoni et al., 2003; Bimbot et al., 2004).
Iris Iris recognition technology is highly accurate and fast. The visual texture of the human iris is determined by the chaotic morphogenetic processes during embryonic development and is believed to have a high distinctiveness for each person and each eye. Universality and permanence over time are also high, and its weaknesses rely on a medium collectability and a low acceptability, since capturing an iris image is rather intrusive and requires coop-eration from the user (Maltoni et al., 2003; Jain et al., 1994). Iris recognition applications have been recently used in access control to hospitals and international frontiers.
10 State of the Art in Speaker Recognition
distinctiveness to individuals. They are also characterised by a medium acceptability, since the acquisition systems involve the cooperation of the user and they are perceived as quite intrusive methods. Their strength relies on the collectability, since the representational requirements of the hand are very small. Even so, finger geometry systems are sometimes preferred due to their more compact size (Maltoni et al., 2003; Jain et al., 1994).
Signature Each individual seems to have a characteristic way of signing, and signature has a high acceptability in many legal and commercial transactions as a verification method. Furthermore, the collectability is also very high. Its weaknesses in biometric recognition are the low universality, distinctiveness and permanence, which entails a low accuracy of the systems. Signatures change over a period of time or even between successive impressions of the same user. Furthermore, signatures can be easily be forged by professionals (Maltoni et al., 2003).
Ear The shape of the ear and the structure of the cartilaginous tissue of the pinna are not expected to be unique to an individual, but they are distinctive enough to be used in biometric recognition. Furthermore, they are characterised by a high user acceptability and permanence over time (Jain et al., 1994).
DNA Deoxyribonucleic Acid (DNA) is the one-dimensional ultimate unique code for one’s individually, used mostly in forensic applications for person recognition (Maltoni et al., 2003; Jain et al., 1994). Its high distinctiveness and permanence over time entail a high performance of the system based on this biometric. However, DNA as a biometric identifier is characterised by a low collectability and a low acceptability, since it is a very intrusive acquisition method.
Gait The way a person walks doesn’t seem to be very distinctive, but it is supposed to be peculiar enough to permit person verification in some low-security applications. Gait is not permanent over time, specially over a large time period. However, since acquisition of gait is similar to acquiring facial pictures, it is a very acceptable and non-intrusive biometric. Furthermore, it is characterised by a high degree of collectability (Maltoni et al., 2003; Jain et al., 1994).
Retinal scan As the iris visual texture, the retinal vasculature seems to be a characteristic of each individual and each eye. It is claimed to be the most difficult to forge biometric. However, the image acquisition is quite intrusive and requires a large cooperation and effort of the user; therefore, this method is characterised by a low public acceptability (Maltoni et al., 2003; Jain et al., 1994).
Odor A human body emits a chemical component that is distinctive to a particular individual. A part of this high distinctiveness, odor seems to be permanent over time and its acquisition is quite accepted by users. However, odor data is not easy to collect, and although its characteristic distinctiveness and permanence, the performance of the systems is still a challenge in biometric recognition (Maltoni et al., 2003; Jain et al., 1994).
acquisition of keystrokes data is a non-intrusive method, so that it is rather acceptable within the users (Maltoni et al., 2003; Jain et al., 1994).
Biometric identifier Universality Distinctiveness Permanence Collectability
Face H L M H
Fingerprints M H H M
Voice M L L M
Iris H H H M
Hand and finger geometry M M M H
Signature L L L H
Ear M M H M
DNA H H H L
Gait M L L H
Retinal scan H H M L
Odor H H H L
Keystroke dynamics L L L M
Table 2.1:Comparison of several biometric identifiers. Data based on the perception of Maltoni et al. (2003). H, M and L denote High, Medium and Low, respectively.
2.1.2 Automatic biometric recognition systems
Architecture of a recognition system
A typical biometric recognition system consists mainly of two phases: the training —or enrolment— phase and the testing —or recognition— phase. In the training phase, biomet-ric measurements from the users are captured by biometbiomet-ric sensors or readers. Next, relevant information is extracted in order to build a user model, which will be stored in a database.
2-15
DNA H H H L
Gait M L L H
Retinal scan H H M L
Odor H H H L
[image:30.595.80.521.548.731.2]Keystroke dynamics L L L M
Table 2.1. Comparison of several biometric identifiers. Data based on the perception of (Maltoni, Maio et al. 2003). H, M and L denote High, Medium and Low, respectively.
2.1.2
Automatic biometric recognition systems
2.1.2.1
Architecture of a recognition system
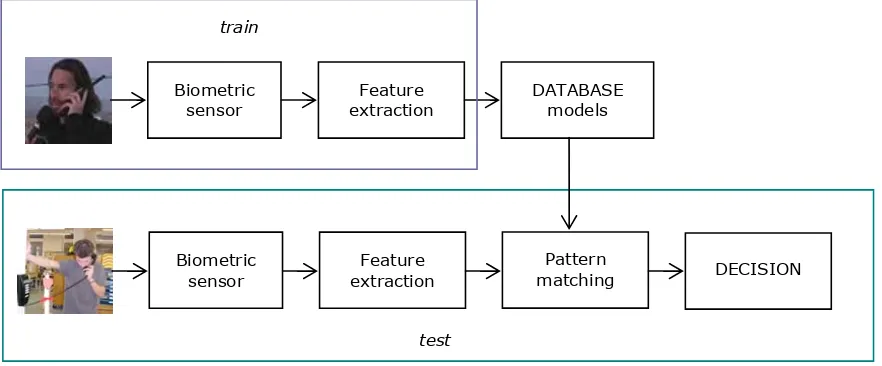
A typical biometric recognition systems consist mainly of two phases: the training – or enrolment – phase and the testing – or recognition – phase. In the training phase, biometric measurements from the users are captured by biometric sensors or readers. Next, relevant information is extracted in order to build a user model, which will be stored in a database.
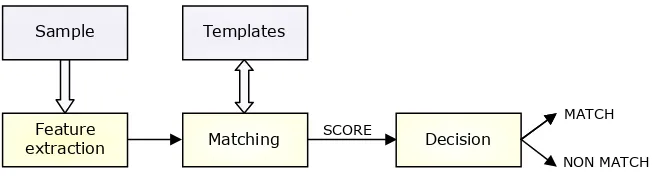
Figure 2.1. Architecture of a typical biometric recognition system.
In the recognition phase, biometric readers are also used to capture biometric information of the user to be recognised. Relevant information is then extracted in the feature extraction step. Next, this information is compared with the stored user models of the database, computing the degree of similarity - or score -, which will be used the determine the likelihood that the user corresponds to one of users whose model is stored in the database. In the end, a decision will be taken based on the computed similarity scores.
2.1.2.2
Biometric identification and verification
Depending on the type of application used, an automatic biometric recognition system can run in two modes: identification and verification (Campbell 1997).
Biometric sensor
Feature extraction
Pattern
matching DECISION
Biometric
sensor extraction Feature DATABASE models
train
test
12 State of the Art in Speaker Recognition
In the recognition phase, biometric readers are also used to capture biometric information of the user to be recognised. Relevant information is then extracted in the feature extraction step. Next, this information is compared with the stored user models of the database, computing the degree of similarity —orscore—, which will be used the determine the likelihood that the user corresponds to one of users whose model is stored in the database. In the end, a decision will be taken based on the computed similarity scores.
Biometric identification and verification
Depending on the type of application used, an automatic biometric recognition system can run in two modes: identification and verification (Campbell, 1997).
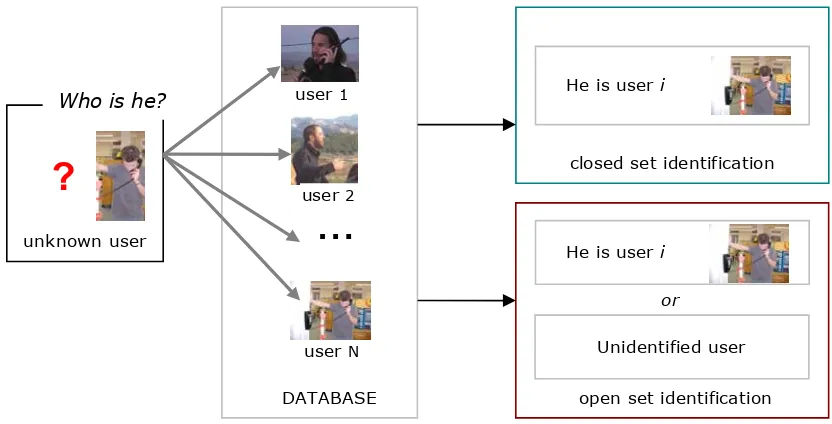
In a person identification mode, the aim is to determine which speaker, in a set of users whose models are stored in the database, matches an unknown user. The set of users can be a closed or an open set. In a closed set identification, it is assumed that the unknown user matches one of the known users of the database, and the biometric recognition system simply choose the known user that mostly matches the unknown user. In an open set identification, the unknown user may or may not be in the set of known users. In this case, it is like performing a closed set identification followed by a verification process to ensure that the unknown user is close enough to the chosen known user of the database to be identified as such. Figure 2.2 shows a diagram of an automatic identification system.
[image:31.595.86.502.415.627.2]2-16 In a person identification mode, the aim is to determine which speaker, in a set of users whose models are stored in the database, matches an unknown user. The set of users can be a closed or an open set. In a closed set identification, it is assumed that the unknown user matches one of the known users of the database, and the biometric recognition system simply choose the known user that mostly matches the unknown user. In an open set identification, the unknown user may or may not be in the set of known users. In this case, it is like performing a closed set identification followed by a verification process to ensure that the unknown user is close enough to the chosen known user of the database to be identified as such. Figure 2.2 shows a diagram of an automatic identification system.
Figure 2.2. Automatic identification system.
On the other hand, the aim of a system running in the verification mode (Figure 2.3) is to determine whether users are who they claim to be. Application of this recognition mode are mainly related to access restriction in secure areas. In verification systems, a user is claiming an identity. A model corresponding to that identity must be stored in the database, which must contain an impostor model as well. Then, the biometric features of the claimed user will be compared to the model of the claimed identity and to the impostor model. If a user seems to be closer to the claimed identity, they will be accepted as a known user (or client). Otherwise, the user will be rejected and treated as an impostor.
closed set identification
unknown user
?
Who is he?
…
user 1
user 2
user N
DATABASE
He is user i
He is user i
or
open set identification Unidentified user
Figure 2.2:Automatic identification system.
user will be rejected and treated as an impostor.
2-17
Figure 2.3. Automatic verification system.
2.1.2.3 Evaluation of a biometric verification system
After having computed a match score of similarity between the input user and the corresponding template stored in the database, a decision is taken whether the user must be accepted or rejected by the system. However, such decision can be both correct or not correct. If the decision is incorrect, two different types of error can occur (Bimbot, Bonastre et al. 2004):
• False rejection (or non detection): the system rejects a valid identity claim.
• False acceptance (or false alarm): the system accepts an identity claim from an impostor.
Both types of errors give rise to two types of error rates, which are commonly used to measure the performance of a system:
• False rejection rate (FRR): percentage of incorrectly rejected clients.
• False acceptance rate (FAR): percentage of incorrectly accepted impostors. Either of the two types of errors can be reduced at the expense of an increase in the other, so that the trade-off between FRR and FAR depends on a decision threshold. In a real-world system, which is usually not perfect, FRR and FAR intersect at a certain point (Figure 2.4) The value of FRR and FAR at this point is known as the Equal Error Rate (EER).
If the threshold is set to a low value, the system tends to accept most of the identity claims, giving few false rejection errors but many false acceptances. On the contrary, with a high threshold the system tends to reject most of the identity claims, giving rise to few false acceptance errors and a lot of false rejection.
Therefore, when designing a biometric verification system, the decision threshold must be adjusted so that both errors are as low as possible, or one of the errors must be always below a certain threshold, if this property is required by a specific application. The trade-off between the two types of error rates is usually depicted in different ways. Two of the most common representations are the ROC and the DET curves.
unknown user
?
Is she Clara?
DATABASE impostor
YES
NO or Clara
Figure 2.3:Automatic verification system.
Evaluation of a biometric verification system
After having computed a match score of similarity between the input user and the corresponding template stored in the database, a decision is taken whether the user must be accepted or rejected by the system. However, such decision can be both correct or not correct. If the decision is incorrect, two different types of error can occur (Bimbot et al., 2004):
• False rejection (or non detection): the system rejects a valid identity claim.
• False acceptance (or false alarm): the system accepts an identity claim from an im-postor.
Both types of errors give rise to two types of error rates, which are commonly used to measure the performance of a system:
• False rejection rate (FRR): percentage of incorrectly rejected clients.
• False acceptance rate (FAR): percentage of incorrectly accepted impostors.
Either of the two types of errors can be reduced at the expense of an increase in the other, so that the trade-off between FRR and FAR depends on a decision threshold. In a real-world system, which is usually not perfect, FRR and FAR intersect at a certain point (see Figure 2.4). The value of FRR and FAR at this point is known as theEqual Error Rate (EER).
14 State of the Art in Speaker Recognition
2-18
Figure 2.4. FRR and FAR as a function of a threshold θ. The intersection point determines the EER.
The Receiver Operating Characteristic (ROC) curve plots the FRR versus the FAR (Bimbot, Bonastre et al. 2004). This curve is monotonous and decreasing, and the better the system is, the closer to the origin the curve will be. Another representation of the ROC curve is used sometimes by plotting the correct detection rate (instead of FRR) versus the false alarms (Duda, Hart et al. 2001).
It is also common to plot the error curve on a normal deviate scale. In this case, the curve is known as the Detection Error Trade-offs (DET) curve (Martin, Doddington et al. 1997; Bimbot, Bonastre et al. 2004). In an hypothetical system whose client and impostor scores are Gaussians with the same variance, the DET curve is a linear curve where the slope equals -1, which becomes more easily readable and comparable to other DET curves. As in the ROC curve, better systems are closer to the origin. In a real system, the score distributions are not exactly Gaussians, but they are close enough to them to allow this representation.
Examples of both ROC and DET curves are plotted in Figure 2.5. The intersection of each curve with the diagonal dotted line indicates the value of the EER.
Error rate (%)
Threshold θ
0 EER 100
FAR FRR
(a) (b)
Figure 2.4: FRR and FAR as a function of a thresholdθ. The intersection point determines the EER.
Therefore, when designing a biometric verification system, the decision threshold must be adjusted so that both errors are as low as possible, or one of the errors must be always below a certain threshold, if this property is required by a specific application. The trade-off between the two types of error rates is usually depicted in different ways. Two of the most common representations are the ROC and the DET curves.
TheReceiver Operating Characteristic (ROC) curve plots the FRR versus the FAR (Bimbot et al., 2004). This curve is monotonous and decreasing, and the better the system is, the closer to the origin the curve will be. Another representation of the ROC curve is used sometimes by plotting the correct detection rate (instead of FRR) versus the false alarms (Duda, 2001).
It is also common to plot the error curve on a normal deviate scale. In this case, the curve is known as the Detection Error Trade-offs (DET) curve (Martin et al., 1997; Bimbot et al., 2004). In an hypothetical system whose client and impostor scores are Gaussians with the same variance, the DET curve is a linear curve where the slope equals−1, which becomes more easily readable and comparable to other DET curves. As in the ROC curve, better systems are closer to the origin. In a real system, the score distributions are not exactly Gaussians, but they are close enough to them to allow this representation.
Examples of both ROC and DET curves are plotted in Figure 2.5. The intersection of each curve with the diagonal dotted line indicates the value of the EER.
2.1.3 Application areas of biometric recognition
The need of recognising people in many daily life situations has given rise to many application relying on biometrics. This section reports some of the areas where this technology can be found: access restriction, electronic commerce transactions, personal service customisation, forensic applications and law enforcement.
0 20 40 60 80 100 0
20 40 60 80 100
FAR (in %)
FR
R
(
in
%
)
ERR
1 2 5 10 20 40 1
2 5 10 20 40
FAR (in %)
FR
R
(
in
%)
ERR
Figure 2.5:Examples of a ROC curve (a) and the corresponding DET curve (b).
environment or recording conditions, and the characteristics of the database, among others. The most common applications are briefly described next, and summarised in Table 2.2.
Access control
Access control and restriction is one of the areas in which biometric technologies have had the greatest impact. So far, access security has been normally restricted by using several objects or codes like keys, cards, passwords or personal identification numbers. Nevertheless, these per-sonal objects and codes can be lost, stolen, or copied, so that biometric identifiers provide an alternative to access secured areas.
Transaction authentication
Online banking, trading and electronic purchasing transactions need verification methods to avoid frauds. Signature and pin numbers are currently the most used verification methods in electronic commerce. However, as in the access restriction applications, these methods can be easily copied by professionals. On the other hand, signature cannot be used in some applications such as telephone or remote credit card purchases. Therefore, other biometric identifiers will be even more used to increase the security in this kind of applications.
Service customisation
16 State of the Art in Speaker Recognition
Law enforcement
Fingerprint identification was the first application of biometrics in law enforcement. Since bio-metrics is even more being used in daily life, it will also be increasingly used in law enforcement applications: locating missing people, identifying criminals, border controls, etc. Unlike security applications, which usually require that the recognition system respond within a short period of time, applications occurring in law enforcement may not have this constraint (Klevans and Rodman, 1997).
Forensics
Biometric forensic applications are highly related to law enforcement applications, especially those concerning the location of missing people and criminal identification. However, forensics has its own role in other issues not related to the law, such as mass disaster victim identification. In these cases, the use of biometric identifiers such as the teeth have been crucial to identify victims.
Application Examples
Access control Physical facilities
Computer network and website Transaction authentication Online banking
Electronic commerce
Service customisation Intelligent answering machine Domotics
Law enforcement Home parole
Forensics Mass victim identification
Table 2.2:Application areas of biometric recognition.
2.2
Speaker recognition
This section deals with several aspects about speaker recognition: the differences between auto-matic and human recognition, the speaker information that can be found in the speech signal, and some of the most common automatic speaker recognition techniques.
2.2.1 Auditory and automatic speaker recognition
Human beings and computers recognise speech patterns in different ways (Ladefoged, 2001; Alexander et al., 2005). Humans use normally aural —hearing perception—, linguistic and other kinds of knowledge to identify others from their voices (Hollien, 2002; Rose, 2002); on the contrary, automatic speaker recognition systems rely on the use of acoustic properties extracted by computers (Rose, 2002).
listening to a very short segment of speech, but they find more difficult to recognise the voices of less familiar speakers. Nevertheless, humans can be trained by listening repeatedly these less familiar voices in order to improve the recognition. Automatic speaker recognition systems can also be trained to learn the voice characteristics of a specific person. Like humans, the more training data, the better the speaker recognition will be.
Rose (2002) reports how the earlier history of forensic-phonetic activity was divided into the use of acoustic and auditory analysis. With respect to these two different approaches, three radically different positions were encountered:
• auditory analysis is sufficient on its own (Baldwin, 1979; Baldwin and French, 1990);
• auditory analysis is not necessary at all: it can be done with acoustics; and
• auditory analysis must be combined with other, i.e. acoustic, methods (K¨unzel, 1987; French, 1994; K¨unzel, 1995).
The third approach is the common method used nowadays in the forensic-phonetic context. However, auditory analysis cannot cover the use of a large number of speakers, which is one of the aims of the state-of-the-art automatic speaker recognition systems. Moreover, auditory analysis cannot be used neither in most of the real-time applications that need to identify many people in a very short-period of time; therefore, its use is normally restricted to some forensic applications.
2.2.2 Speaker information contained in the speech signal
Speech production
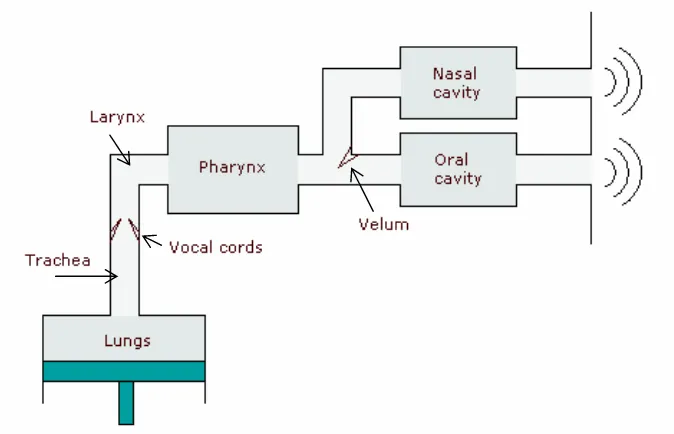
By means of spoken utterances, a person is able to communicate a message made up of sounds, words and sentences with a specific meaning. But besides carrying a meaning, the speech message can also provide information about the individuals themselves: the anatomy, physiology, age, linguistic characteristics or even emotional states (Dellwo et al., 2007).
The part of the human vocal mechanism responsible for the sound production —when driven by the brain— is the vocal tract. The elements of the human vocal tract were formerly associated only with vegetative functions —the tongue for mastication, the epiglottis and pharynx for swallowing, etc. These structures evolved, about 1.6 million years ago, in their ability to produce speech in order to enhance the human communication. This capability evolved in parallel with the peripheral hearing mechanism and the expansion in the neural circuitry for controlling muscles to produce sounds and for making sense of the incoming acoustic signals, giving rise to the beginning of human speech (Rose, 2002).
18 State of the Art in Speaker Recognition
The area between the vocal folds is called the glottis. The vocal folds are placed between the thyroid cartilage and the arytenoid cartilages. All these elements, together with the top of the cricoid cartilage, comprise the larynx, where the sound is generated through the oscillatory movement of the vocal folds. Above the vocal folds, all the organs related to the speech produc-tion comprise the vocal tract, which consists mainly of the pharynx, the oral and nasal cavities, the tongue, the velum —or soft palate—, the hard palate, the teeth and the lips.
Speech sounds are rapid fluctuations in air pressure, generated when air is made to move by the vocal organs. These pressure fluctuations cause the listener’s ear drum to move rapidly in an out. In this process, acoustic energy is transformed into mechanical energy at the ear-drum. Then, this mechanical energy goes through several more transformations before arriving as patterns of neural energy at the listener’s brain, where the information is processed resulting in the percept of sound.
Figure 2.6:Human vocal system.
Physically speaking, the speech signal is a series of pressure changes in the medium. The oscillogram or waveform (air pressure changes in a speech wave as a function of time), the spectrum (amplitude plotted against frequency), and the spectrogram (amplitude, frequency and time plotted 3-dimensionally) are some of the most common representations of the speech signal. Figure 2.7 shows the waveform and the spectrogram corresponding to a sentence uttered by a female speaker; (as a reference, it is said that the fundamental frequency of general female voice is 225 Hz, male voice is 120 Hz and a small child’s voice is 300 Hz (Kent and Read, 1992). Note that, in the spectrogram, amplitude is represented as a third dimension by dark shades.
2-23
Figure 2.7. Waveform and spectrogram for a female voice speech sentece.
The speech production system is usually modeled as the scheme in Figure 2.8, and described as two separate and independent processes: the sound generation in the larynx (source) on the one hand and the acoustic filtering of the speech sounds in the vocal tract (filter). This representation of the speech production is known as the source-filter approach. According to it, the voice can be modeled as an acoustic source signal in the larynx, filtered by a dynamic filter mimicking the supralaryngeal filter in the vocal tract, as mentioned above. Voiced sounds generated in the larynx are represented as a periodic pulse-train, while unvoiced sounds are represented as noise (Fant 1982).
Figure 2.8. Schematic representation of the speech production system.
The linear speech production model introduced by (Flanagan 1972), assumes that, for a voiced speech S(z), the source U(z) is a delta train, while for an unvoiced speech the source
U(z) is represented by a random white noise. The filter is a cascade of a glottal pulse filter
G(z), a vocal tract filter V(z) and a lip radiation filter L(z) (Figure 2.9).
Amp
litu
d
e (Pa)
Fr
eq
ue
nc
y (
H
z)
Figure 2.7:Waveform and spectrogram for a female voice speech sentence.
represented as noise (Fant, 1982).
Figure 2.8:Schematic representation of the speech production system.
The linear model of speech production was developed by Fant in the late 1950s (Fant, 1960). The assumptions in this model are covered in detail by Flanagan (1972). The model assumes that, for a voiced speechS(z), the sourceU(z) is a delta train, while for an unvoiced speech the source U(z) is represented by a random white noise. The filter is a cascade of a glottal pulse filterG(z), a vocal tract filterV(z), and a lip radiation filterL(z) (Figure 2.9).