I. Cañellas
1*, M. Sánchez-González
2, S.M. Bogino
3, P.Adame
4, D.
Moreno-Fernández
5, C. Herrero
6, S. Roig
7, M. Tomé
8, J.A. Paulo
9,
F. Bravo
10Carbon Sequestration in Mediterranean Oak Forests
1 Introduction
The Kyoto Protocol requires every industrialized country to have a transparent and verifiable method for estimating the size and evolution of the carbon stored in forest ecosystems. The intergovernmental panel on climate change (IPCC, 2007) predicts the evolution of the stock over the first commitment period (2008-2012) using the “bottom-up approach”. This approach is based on the use of data from national or regional forest inventories. The biomass of living trees including their dead parts comprises the main carbon pool in forest ecosystems along with the biomass of understorey plants, litter, woody debris and soil organic matter (Pignard et al., 2004).
The most recent report on climate change (Ministerio de Medio Ambiente, 2005) and its impact on woodlands in Spain emphasised that the aptitude of woodlands as carbon sinks would increase over the course of the next few decades, but that in the last half of the XXI century woodlands could change from being sinks to emitters of carbon dioxide to the atmosphere. This report highlights the urgency of further studies to quantify the total amount of carbon fixed in woodlands and shrublands.
The objective of this chapter is to present some of the studies currently being carried out in Spain and Portugal which are concerned with the possibility of estimating the amount of carbon fixed by two of the main oak species in the Iberian Peninsula;
rebollo oak (Quercus pyrenaica Willd.) and cork oak (Quercus suber L.). Three different methodological approaches have been used. The first approach is to use growth models to evaluate the carbon sequestration in both cork and wood over the life of a cork oak plantation. This approach has been applied both for Spain and Portugal. The second approach involves using a yield table as a tool to estimate the carbon sequestration in Quercus pyrenaica forests based on Spanish National Forest Inventories. In a third approach, data from a network of plots is used to estimate the carbon sequestration in pure and mixed Quercuspyrenaica forests. The application of these different methodologies would allow us to forecast and improve the carbon sequestration in Iberian oak forests as well as increase our understanding of their dynamics.
2
600,000 ha in Spain and mixed stands are very frequent. Woodlands dominated by
rebollo oak were very important for firewood production until about 4 decades ago and were an essential element in traditional rural life. In this study we have focused on pure as well as mixed stands of Pinus sylvestris L. and Q. pyrenaica, which occupy more than 160,000 ha in Spain (ICONA, 1998).
2 Biomass Production and Carbon Sequestration in Spanish Cork Oak Forests
The objective of the present section is to estimate the amount of carbon (C) sequestered in Spanish cork oak forests and analyse its evolution over the life cycle of the forest. In this study, we consider the carbon content of wood as well as cork, along with all possible cork extractions made over the rotation period. The following initial hypothesis and restrictions were established:
The cork oak stand evaluated in the study consisted of a 1 ha plantation aimed mainly at cork production, with trees distributed on a 4 x 3 m2 design (corresponding to a density of about 825 trees/ha).
The site quality of the cork oak forest was medium-good, or Quality II according to Sánchez-González et al. (2005), which corresponds to a dominant height of 12 m at 80 years.
The rotation is about 150 years, which is considered the upper limit for quality cork production. The debarking period is 10 years, starting from the first cork harvest at 38 years until the end of the rotation, so in total, debarking takes place on thirteen occasions over the rotation.
The cork quality of all cork oaks in the stand was medium, which, according to Sánchez-González et al. (2008), corresponds to a cork thickness of 29.25 mm at the ninth year after debarking.
At the first cork extraction, the debarking height was 1.2 m, at the second it was 2 m, whilst at the third and consecutive extractions the debarking height was 3 m.
From an initial plantation density of 825 trees/ha and taking into account natural mortality and thinnings, the density would have been around 500 trees/ha (Montero & Cañellas, 1999) at the first cork extraction, after which the following thinning regime was applied, coinciding with different cork harvests:
- At the second cork harvest, the number of trees per hectare was reduced from 500 to 250.
- At the fifth, the stand was thinned to 150 trees/ha.
- At the eighth, the stand was thinned to 70 trees/ha in order to facilitate natural regeneration.
- Finally, at the eleventh cork harvest, the number of trees per hectare was reduced to 40 trees/ha to promote the establishment of the regeneration.
We are aware of the limitations of an estimation made under the aforementioned hypothesis but nevertheless believe it to be a valuable exercise which will contribute to our understanding of the role played by these systems in the mitigation of carbon emissions to the atmosphere.
2.1 Material and Methods
Owing to the fact that the carbon content of wood and cork is different, the dry biomass evolution for cork oak forests in Spain was estimated separately for wood and cork as follows:
2.1.1 Dry wood biomass estimation
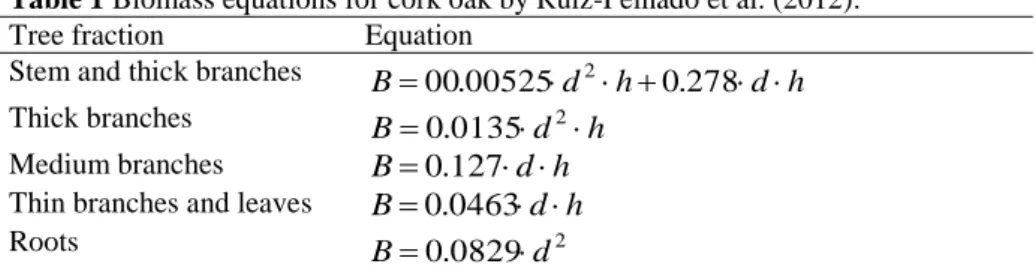
Biomass for the whole tree was estimated as the sum of above ground biomass and root biomass using the equations developed by Ruiz-Peinado et al. (2012) for cork oak (Table 1).
Table 1 Biomass equations for cork oak by Ruiz-Peinado et al. (2012).
Tree fraction Equation
Stem and thick branches B00.00525d2h0.278dh
Thick branches B d2h
0135 . 0
Medium branches
B
0
.
127
d
h
Thin branches and leaves
B
0
.
0463
d
h
Roots 2
0829 .
0 d
B
B is the biomass weight of each tree fraction (kg), d is the diameter at breast height (cm) and h is the tree height (m).
Since the equations developed by Ruiz-Peinado et al. (2012) consider diameter over cork and the authors do not provide any information with regard to the cork (thickness of cork on trees used to fit the equations or cork rotation year in which they were collected), it is impossible to know how much of the stem and branch biomass is wood and how much is cork. To overcome this shortcoming, we applied the equations from Table 1 using diameter under cork. Furthermore, to avoid the overestimation of cork biomass we applied a correction factor that reduced the estimated cork biomass by 5%.
The diameter at breast height under cork was estimated by applying the diameter increment model for cork oak forests (Sánchez-González et al., 2006):
𝑖𝑑𝑢 = 𝑖𝑑𝑢𝑝𝑜
1+𝑒−(0.73+94.97 1𝑁)
(2)
where idu is the annual diameter increment under cork (cm); idupo is the annual
potential diameter increment (cm) and N is the number of trees per hectare.
4 ) t e ( ) t e (
du
)
/du
h
SI
(
du
( e t )) t e ( 1 0063 . 0 1 ln 2 0063 . 0 1 ln 1 2 1 0063 . 0 1 ln 0063 . 0 1 ln 1 1 1
2
83
.
20
5
.
28
1
.
53
(3)where: dui is the diameter at breast height under cork (cm) at age ti (years); SI is the
site index (m) defined by Sánchez-González et al. (2005) assuming a site index of 12 m corresponding to Quality II and h/d is the height to diameter ratio (cm/cm).
Tree height was estimated using the following height-diameter equation based on the one developed by Sánchez-González et al. (2007):
1
.
3
0.48983
.
1
po podu
du
h
h
(4)where: du is the diameter at breast height under cork (cm); hpo is the potential height
estimated using the model developed by Sánchez-González et al. (2005) , dupo is the
potential diameter under cork estimated using Eq.3.
Having calculated dry biomass through the equations given in Table1, the percentage of carbon in the whole tree was calculated by multiplying that value by 0.472 (the average carbon content of cork oak wood; Ibañez et al., 2002), and by the weight ratio of the CO2 molecule and the carbon atom, 3.67.
2.1.2 Dry cork biomass estimation
Dry cork biomass or cork weight was estimated using the following expression:
density
cu. cork
cb . sh .
w
(5)where w is cork weight (kg D.M.), sh is stripped height (m); cu is circumference at breast height under cork (m) calculated from diameter at breast height under cork;
cork density was assumed to be 250 kg/m3 for dry cork (Pereira, 2007) and cb is predicted cork thickness estimated using the following cork growth model (Sánchez-González et al., 2008):
0 1 2 86 . 1 57 . 0 04 . 0 04 . 0 1 2
1
1
X t te
e
cb
cb
(6) where:
1 0.041 2 0.041
1 04
. 0 1
0 ln 0.57ln1 ln 0.57ln1 4 1.86ln1
2
1 t t t
e e cb e cb X
cbi is cork thickness (cm) at cork age ti (years).
first half year and last half year of a debarking period to the cork thickness corresponding to the last complete year before cork harvest.
Having obtained a value for cork weight, the percentage of carbon in cork was calculated by multiplying that value by 0.57 (according to Gil et al., 2005), the average carbon content of cork is 57%, and by the weight ratio of the CO2 molecule
and the carbon atom, 3.67.
2.2 Results and Conclusion
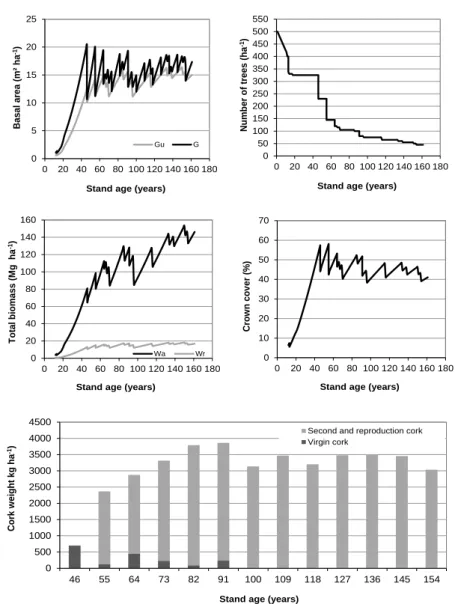
The wood biomass production in cork oak forests shows an increasing trend (Figure 1 and Table 2). The cumulative wood biomass extracted over the whole period totals 220.77 Mg ha-1. It should be mentioned that at the first cork extraction, the amount of cork biomass extracted is zero because this is “virgin cork” which has different characteristics to the cork extracted in successive harvests which is termed “reproduction cork”. Regarding cork biomass production (Figure 2 and Table 2), the maximum value is reached at 88 years, coinciding with the sixth cork harvest.
Figure 1 Biomass production and accumulated CO2 values for wood in cork oak
forests.
Table 2 Wood and cork biomass production in cork oak forests.
Age (years) du Tres ha-1 WB CB VCB
38 14.61 500 31,78 0,00 1,49
48 18.93 500 53,10 2,55 1,28
6
68 28.77 250 59,48 4,88 0,00
78 33.01 250 77,60 5,62 0,00
88 37.11 150 64,62 6,32 0,00
98 43.45 150 78,40 4,45 0,00
108 47.45 150 92,72 4,86 0,00
118 51.26 70 61,72 5,26 0,00
128 61.33 70 70,39 2,94 0,00
138 65.20 70 79,14 3,13 0,00
148 68.88 40 57,82 3,31 0,00
158 77.86 40 63,58 2,14 0,00
du: diameter at breast height under cork (cm); cu: circumference at breast height over cork (cm); WB: wood biomass (t D.M. ha-1); CB: cork biomass (t·ha-1), VCB: virgin cork biomass (t·ha-1).
As the carbon content of cork oak wood and cork is different, when evaluating the amount of CO2 stored in cork oak forests it is important to differentiate between the
CO2 accumulated in wood (Figure 1) and in cork (Figure 3). In the case of cork, the
accumulated CO2 is extracted at each cork harvest although it remains sequestered in
cork products. The total amount of accumulated CO2, taking into account all the
cork extractions, is 105.93 Mg·ha-1.
Figure2: Cork biomass production and accumulated CO2 values at each debarking.
3 Biomass Production and Carbon Sequestration in Portuguese Cork Oak Forests
Cork oak is a very important species in Portugal. According to the last National Forest Inventory (AFN, 2010) the species covers an area of 716 103 ha (pure stands and mixed stands). The great majority of the present stands are adult stands characterised by low density; the average stand density in the country is 65 trees/ha and 85% of the stands have less than 120 trees/ha. The establishment of new plantations began towards the end of the 1980’s and today they occupy a large of the country. According to official statistics (Torres, 2009; AIFF, 2013), rates of planting were 4800 ha/year, 9300 ha/year and 3767 ha/year for the periods 1990-1994, 1995-2003 and 2004-2009, respectively. The objective of the present work is to estimate the carbon sequestered by a stand of average site index and then by taking the rates of plantation into account, to estimate the amount of carbon that is expected to be sequestered by the plantations established after 1990 (article 3.3 of the Kyoto protocol) during the first commitment period of 2008-2012.
8
The estimates of the evolution of carbon stocks in cork oak stands were based on version 5 of the SUBER model (Paulo et al., 2012; Paulo, 2011; Tomé, 2004), which includes the system of equations for tree biomass and crown width estimation developed for the Portuguese NFI 2005/2006 (Tomé et al., 2007) along with the root biomass equation developed for Spain by Montero et al. (2005). In comparison to the previous version of the SUBER model, which was used for the study presented in Cañellas et al. (2008), the present model includes improved versions of some of the equations, as well as the possibility to simulate non-age-related mortality which, according to data from the Portuguese NFI, is known to occur and to greatly influence the development of cork oak stands (AIFF, 2013). The SUBER model is one of the models implemented in the sIMfLOR platform for Portuguese forest simulators (Faias et al., 2012). It allows the development of an existing or new stand to be simulated under different forest management approaches defined by the user and which are detailed below.
3.1.1. Developing the yield table
Figure 4 represents the site index curves developed by Sánchez-González et al. (2005) for Spain and which have been successfully tested for Portugal (Tomé, 2004) together with information from the 42 permanent plots included in the SUBERDATA data base for cork oak growth in Portugal (Coelho & Godinho, 2002) and for which the age is known. The figure clearly indicates that the new plantations (younger than 20 years) were established at better sites that the older ones: average site index for young stands is 16.6 m and for older stands 13.6 m. For the purposes of this study, new plantations were assumed to have an average site index of 16 m (base age 80).
Figure 3: Spanish site index curves for cork oak (Sánchez-González et al., 2005) and the permanent plots established in Portuguese stands for which the age is known. Observations from the same plots are connected with straight lines.
The SUBER model was run in order to build a yield table for a stand with site index equal to 16 m. The following assumptions were made for the development of the yield table:
Initialization was done using measured data (diameter at breast height and total height) from a 12 year old planted stand. The stand was planted with 500 trees/ha and at the time of the measurement there were 400 trees/ha (mortality prior to measurement was 20%).
The debarking period was assumed to be 9 years, starting when the quadratic mean diameter of the stand was greater than 25 cm (according to Portuguese legislation cork cannot be extracted before the perimeter at breast height reaches 70 cm).
The debarking coefficient values (ratio between debarking height and tree perimeter at breast height) were defined after a close analysis of the debarking heights recorded in the forest inventory data (AFN, 2010): 2 for the first and second cork extractions, and 2.5 for the third and consecutive extractions. These values are below the maximum limit allowed by law (2, 2.5 and 3), but reflect the practice of landowners in order to reduce the stress associated with cork debarking. For the same reason, increasing the debarking height is only applied when stand age is less than 100 years.
6 8 10 12 14 16 18
0 2 4 6 8 10 12 14 16 18 20
0 10 20 30 40 50 60 70 80 90 100 110 120
h
d
o
m
(m
)
10
Stand density was defined by thinning each time the crown cover percentage at the time of debarking was higher than 50%. This crown cover percentage is close to the maximum recommended by Natividade (1950). Stands were thinned using the thinning algorithm presented in Tomé (2004).
It has been assumed that cork produced during the second cork rotation, known as “second cork”, can be estimated using the equations available for reproduction cork (Paulo and Tomé, 2010).
The rotation considered was 150 years, which is considered the upper limit for quality cork production.
3.1.2. Simulation of future total carbon stocks
The simulation of the future carbon stocks was based on the yearly estimation of the areas of new plantations by age class (age classes of 1 year were used). According to official statistics (Torres, 2009; AIFF, 2013) rates of planting were 4800 ha/year, 9300 ha/year and 3767 ha/year for the periods 1990-1994, 1995-2003 and 2004-2009, respectively. This last rate (for 2009) was assumed for the years after 2010. This information was used to estimate the area of new plantations per year in age class 1 (between 0 and 1). The area in age class j in year t+1 was estimated as 98% of the area in age class (j-1) in year t, which means an annual loss rate of 2% of the area, mainly due to forest fire and land use change. An additional annual loss of 5% was assumed for stands with an age of less than 6 years to take into account the non-success of some plantations. Total carbon stock at year t was estimated as:
1501
,
5
.
0
57
.
0
472
.
0
jt j j j
j j
t
Ww
Wr
Wb
Wc
A
Cstock
, (6) where Wwj, Wrj, Wbj and Wcj are, respectively, stem wood, root, bark (cork) and crown biomass per ha at age j as given by the yield table and Aj,t is the area of new plantations in age class j in year t.
3.1.3. Estimation of carbon sequestration during the period 2008-2012
Carbon sequestered during the 1st commitment period of the Kyoto protocol (2008-2012) was estimated using the stock change approach:
2008
2013
Cstock
Cstock
C
, (7)
where Cstockt is the carbon stock at the start of year t.
3.2. Results and discussion
extent the stand regeneration. However, most of the new plantations are being managed with cork production as the main objective. This option can only be achieved with a complete use of the space by the trees, therefore a high percentage of crown cover was used in the development of the yield table.
Figure 4: Evolution of a new cork oak plantation with the characteristics presented in 3.1.1. G and Gu are, respectively, over and under bark basal area and Wa and Wr
are total aboveground and root biomass.
Mature cork production increases up to a stand age of 80 years (maximum value of 3675 kg ha-1 for 105 trees ha-1) due to tree growth and increasing of debarking
0 5 10 15 20 25
0 20 40 60 80 100 120 140 160 180
Basa l ar ea ( m ² ha -1)
Stand age (years)
Gu G 0 50 100 150 200 250 300 350 400 450 500 550
0 20 40 60 80 100 120 140 160 180
Nu mb er o f t ree s (h a -1)
Stand age (years)
0 20 40 60 80 100 120 140 160
0 20 40 60 80 100 120 140 160 180
T o tal b iom as s (M g ha -1)
Stand age (years)
Wa Wr 0
10 20 30 40 50 60 70
0 20 40 60 80 100 120 140 160 180
Crow n cov er ( % )
Stand age (years)
0 500 1000 1500 2000 2500 3000 3500 4000 4500
46 55 64 73 82 91 100 109 118 127 136 145 154
Co rk w eigh t kg h a -1)
Stand age (years)
12
height. Values up to 3000 kg ha-1 are maintained up to an age of 145 years, but tend to decrease at older ages. The differences between these values and those presented by Cañellas et al. (2008) are due to the use of lower debarking coefficient values, which better reflect the practice of landowners, as well as lower values for percentage crown cover, closer to reality than those used in the previous study.
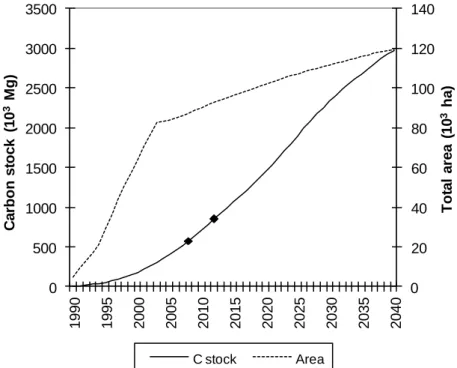
Figure 5 shows the estimations of total area and the corresponding carbon stock for the first 50 years (until 2040) of young plantations established after 1990. According to the assumptions used for the development of the yield table (see 3.1.1), new plantations of cork oak may sequester as much as 3.0 Mt over a period of 50 years if the plantation rates of 3767 ha year-1 achieved in 2003 are maintained. The estimates of carbon sequestration presented by Cañellas et al. (2008) for the same period (5.9 Mt) assumed annual plantation rates of 9300 ha year-1. The importance of plantation rates has also been demonstrated by Coelho et al. (2012). According to this study, the amount of C sequestered during the 1st commitment period of the Kyoto protocol was 344 103 Mg of C sequestered, which means 1.3 106 Mg of CO2 equivalent. This
value represents a large share of the value estimated by Portugal for this period for the new plantations of all species.
Figure 5: Estimation of the evolution of the area of new cork oak plantations and the corresponding fixation of carbon for the period 1990-2040. The black lozenges indicate the years 2008 and 2013.
0 20 40 60 80 100 120 140
0 500 1000 1500 2000 2500 3000 3500
1990 1995 2000 2005 2010 2015 2020 2025 2030 2035 2040
T
o
ta
l
a
re
a
(
10
3
h
a
)
C
a
rbo
n
s
toc
k
(
1
0
3
M
g)
This result is very important for Portugal as the European Commission recently (October 2007) reduced Portugal’s estimations for reductions induced by afforestation and reforestation due to the fact that the Portuguese estimates had not been adequately justified. The results presented here support Portugal’s initial predictions, indicating that far from being an over-estimation, the value presented may be an under-estimation.
4 Carbon quantification in pure Quercus pyrenaica Willd woodlands in Spain.
In the Iberian Peninsula, traditional uses of rebollo oak stands have been progressively abandoned over the last four decades. Today, these woodlands suffer from a number of silvicultural, ecological and socioeconomic problems (Cañellas et al., 2004) which often means that they do not meet the minimum requirements for the application of silvicultural treatment programmes. Nevertheless, the role of
rebollo oak woodlands as carbon stores should be taken into consideration when developing management plans. Given the widespread distribution of the species and current lack of demand for direct products which would justify the application of intensive silviculture (bearing in mind the high cost of such treatments), it is necessary to prioritize the management of these stands in accordance with the available resources and final objectives. Rebollo woodlands with medium to high densities and regular diameter distributions present critical problems of stagnation and fire risk and therefore should be considered a priority when applying silvicultural treatments.
Growth and yield models for variable silviculture indicate the silvicultural interventions to be carried out during the rotation, the approximate age of the stand in which these should be performed, and the results which may be expected according to the intensity of the interventions (Cañellaset al., 2000). Models of this type do not follow a strict procedure or a fixed set of rules, but sometimes provide very detailed guidelines for silvicultural interventions (Monteroet al., 2001).
The aim of this study is to quantify the current stocks and flows of carbon in the main Spanish rebollo stands (coppices) in which thinning treatments might be of interest. For the purposes of the study, four different site qualities and two silvicultural schemes were considered. The latter would be more intensive in the better quality sites and moderate in the lower quality sites.
4.1 Data and methods
14
Yield models for Q. pyrenaica in northwest Spain were built to simulate the different silviculture alternatives and predict changes in the basic stand variables: number of stems per hectare (N), quadratic mean diameter (Dg), basal area (G) and volume (V) for a wide range of density management regimes. Natural mortality was considered to be null as it was controlled by thinning. The structure of these models is based on equations involving site index (SI), stems per hectare (N), volume (V), and mean height (Hm):
-1st equation: site index defined by Adame et al. (2006) (8) -2nd equation: 𝑁 = 𝑒(8.49459−0.114019∙𝐻𝑜) (9) R2=0.37
-3rd equation:𝐷𝑔 = 2.17047 + 2174.69𝑁0.7415+ 0.215575 ∙ 𝐻𝑜 (10) R2=0.95
-4th equation: 𝑙𝑛(𝑉)= −0.709618 + 0.936607 ∙ 𝑙𝑛(𝐺 ∙ 𝐻𝑜) (11) R2=0.98
-5th equation: 𝐻𝑚 = 1.20895 + 0.643414 ∙ 𝐻𝑜 (12)
R2=0.64
where N: is the number of stems per hectare, Ho: dominant height (m), Dg: quadratic mean diameter (cm), V: stem volume per m3/ha, G: basal area (m2/ha),
Hm: mean height.
Intensive silvicutural treatments (Site index 16 and 13 Adame et al., 2006) and moderate silvicultural treatments (Site index 10 and 7) are presented in Table 3. The yield table according to site quality and silvicultural treatments is shown in Table 4.
Table 3 Thinning regimes applied in rebollo coppices.
Intensive silvicultural treatments Moderate silvicultural treatments ≈20 years: if initial density higher
2000-2500 trees/ha pre-commercial thinning has to be applied.
30 years: 1st low thinning. 40 years: 2nd low thinning. 60 years: 3rd low thinning. 80 years: 4th low thinning. Rotation: 100years.
≈15-20 years: if initial density higher 3500-4000 trees/ha pre-commercial thinning has to be applied.
30 years: 1st low thinning. 50 years: 2nd low thinning. 70 years: 3rd low thinning. 90 years: 4th low thinning. Rotation: 120 years.
Table 4 Yield tables according to site quality and silvicultural treatments. SITE INDEX 16: INTENSIVE SILVICULTURAL TREATMENTS
Age
years
Ho
m
Main crop
Before thinning Crop removed
Main crop After thinning N trees/ha Dg cm G
m2/ha
V
m3/ha
N
trees/ha
Dg
cm
V
m3/ha
N
trees/ha
Dg
cm
G
m2/ha
V
80 17.8 550 26.2 29.6 174.0 150 22.3 32.3 400 27.5 23.8 141.7 100 18.8 400 31.8 31.8 196.2
SITE INDEX 13: INTENSIVE SILVICULTURAL TREATMENTS
Age
years
Ho
m
Main crop
Before thinning Crop removed
Main crop After thinning N trees/ha Dg cm G
m2/ha
V
m3/ha
N
trees/ha
Dg
cm
V
m3/ha
N
trees/ha
Dg
cm
G
m2/ha
V
m3/ha 30 7.9 2500 10.4 21.4 60.0 700 8.7 10.9 1800 11.1 17.3 49.1 40 10.0 1800 12.7 22.9 79.8 600 10.5 17.3 1200 13.7 17.6 62.5 60 13.0 1200 16.3 25.0 110.9 400 13.5 24.0 800 17.5 19.3 86.9 80 14.8 800 20.7 26.8 133.7 300 17.1 32.6 500 22.5 19.9 101.1 100 15.9 500 27.3 29.2 155.2
SITE INDEX 10: MODERATE SILVICULTURAL TREATMENTS
Age
years
Ho
m
Main crop
Before thinning Crop removed
Main crop After thinning N trees/ha Dg cm G
m2/ha
V
m3/ha
N
trees/ha
Dg
cm
V
m3/ha
N
trees/ha
Dg
cm
G
m2/ha
V
m3/ha 30 5.3 3400 8.6 19.5 38.2 1000 6.4 6.8 2400 9.3 16.3 32.3 50 8.7 2400 10.8 22.1 68.2 750 8.1 11.3 1650 11.9 18.2 56.9 70 10.9 1650 13.5 23.6 89.5 600 10.1 17.3 1050 15.1 18.7 72.3 90 12.4 1050 17.3 24.8 105.3 350 13.0 18.6 700 19.2 20.2 86.7 120 13.6 700 22.0 26.6 122.7
SITE INDEX 7: MODERATE SILVICULTURAL TREATMENTS
Age
years
Ho
m
Main crop
Before thinning Crop removed
Main crop After thinning N trees/ha Dg cm G
m2/ha
V
m3/ha
N
trees/ha
Dg
cm
V
m3/ha
N
trees/ha
Dg
cm
G
m2/ha
V
m3/ha 30 3.1 4000 7.49 17.6 21.1 1200 5.62 3.36 2800 8.2 14.6 17.8 50 5.9 2800 9.49 19.8 42.5 900 7.12 7.25 1900 10.4 16.2 35.3 70 7.9 1900 11.9 21.2 59.6 650 8.95 10.8 1250 13.2 17.1 48.8 90 9.2 1250 15.1 22.5 72.8 400 11.4 12.3 850 16.6 18.5 60.4 120 10.4 850 19.0 24.2 87.1
Dry biomass of the whole tree was estimated as a sum of the different fractions (stem plus branches with a diameter over 7 cm, branches with a diameter between 2 and 7 cm, branches with a diameter of less than 2 cm with leaves, and the belowground fraction, the roots) using the equations developed by Ruiz-Peinado et al.(2012) for Q. pyrenaica (Table 5).
Table 5 Biomass equations for the rebollo oak by Ruiz-Peinado et al. (2012)
Tree fraction Equation
16
Medium branches 2 2
B = -0.0260 d +0.536 h+0.00538 d
h
Thin branches and leaves B = 0.898 d - 0.445 h
Roots 2
B = 0.143 d
B is the biomass weight of each tree fraction (kg), d is the diameter at breast height (cm) and h is the tree height (m).
The calculation of the amount of carbon stored in the biomass of trees is usually based on biomass expansion factors (Nabuurs et al., 2000). Once dry biomass has been estimated, the percentage of carbon in each fraction and in the whole tree was calculated by multiplying each value by 0.475 according to Ibáñez et al. (2002).The carbon stored in the soil organic matter is not considered in this study.
4.2 Results and discussion
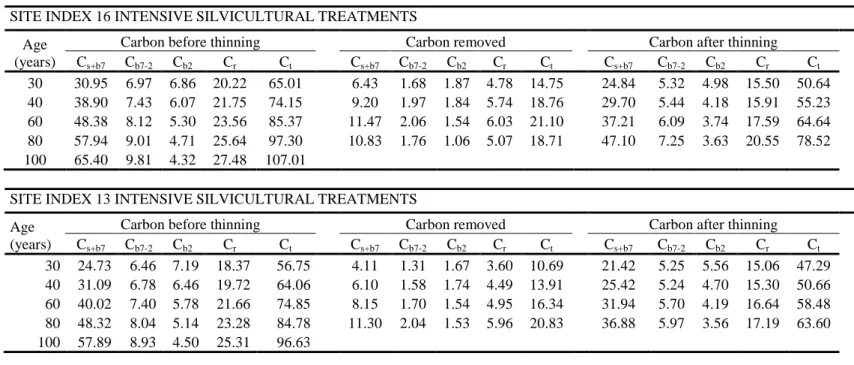
The results demonstrate the relevance of both site quality and forest management in the preservation of forests as carbon sinks. The carbon stocks in each biomass fraction of Q. pyrenaica in northwest Spain are given in Table 6 and 7. Figure 7 shows the total carbon fixed (t), taking into account site index and age.
The results for carbon accumulation in rebollo oak (Tables 6 and 7) show that the better the quality, the higher the total amount of carbon fixed since the biomass volume increases with quality. For example, the current increment in total carbon fixed at an average age of 60-70 years for site index 16 is 1.98 Mg/ha year, 1.66 Mg/ha yearfor site index 13, 1.22 Mg/ha year for site index 10 and 1.05 Mg/ha-year for site index 7.
Total fixed carbon at the end of the rotation on site index 16 represents 13.8 % more than on site index 13, 40.4 % more than on site index 10 and 68.5 % more than on site index 7. The importance of forest management can be seen in the final differences in total carbon sequestration (Fig. 6). Furthermore, initial differences at 30 years between intensive and moderate silvicultural treatments ranged between 79.3 % (between site index 16 and site index 7) and 12.1% (between site index 13 and 10).
0 50 100 150 200
30 40-50 60-70 80-90 100-120
Cu
m
u
lative
carb
o
n
sto
red
(M
g
h
a
-1
)
18
Table 6: Carbon concentrations (t ha-1 ha) in different components of rebollo oak for high quality sites.
SITE INDEX 16 INTENSIVE SILVICULTURAL TREATMENTS
Age (years)
Carbon before thinning Carbon removed Carbon after thinning
Cs+b7 Cb7-2 Cb2 Cr Ct Cs+b7 Cb7-2 Cb2 Cr Ct Cs+b7 Cb7-2 Cb2 Cr Ct
30 30.95 6.97 6.86 20.22 65.01 6.43 1.68 1.87 4.78 14.75 24.84 5.32 4.98 15.50 50.64 40 38.90 7.43 6.07 21.75 74.15 9.20 1.97 1.84 5.74 18.76 29.70 5.44 4.18 15.91 55.23 60 48.38 8.12 5.30 23.56 85.37 11.47 2.06 1.54 6.03 21.10 37.21 6.09 3.74 17.59 64.64 80 57.94 9.01 4.71 25.64 97.30 10.83 1.76 1.06 5.07 18.71 47.10 7.25 3.63 20.55 78.52 100 65.40 9.81 4.32 27.48 107.01
SITE INDEX 13 INTENSIVE SILVICULTURAL TREATMENTS
Age (years)
Carbon before thinning Carbon removed Carbon after thinning
Cs+b7 Cb7-2 Cb2 Cr Ct Cs+b7 Cb7-2 Cb2 Cr Ct Cs+b7 Cb7-2 Cb2 Cr Ct
30 24.73 6.46 7.19 18.37 56.75 4.11 1.31 1.67 3.60 10.69 21.42 5.25 5.56 15.06 47.29 40 31.09 6.78 6.46 19.72 64.06 6.10 1.58 1.74 4.49 13.91 25.42 5.24 4.70 15.30 50.66 60 40.02 7.40 5.78 21.66 74.85 8.15 1.70 1.54 4.95 16.34 31.94 5.70 4.19 16.64 58.48 80 48.32 8.04 5.14 23.28 84.78 11.30 2.04 1.53 5.96 20.83 36.88 5.97 3.56 17.19 63.60 100 57.89 8.93 4.50 25.31 96.63
where Cs+b7, Cb7-2, Cb2, Cr and Ct are the carbon stored (t ha -1
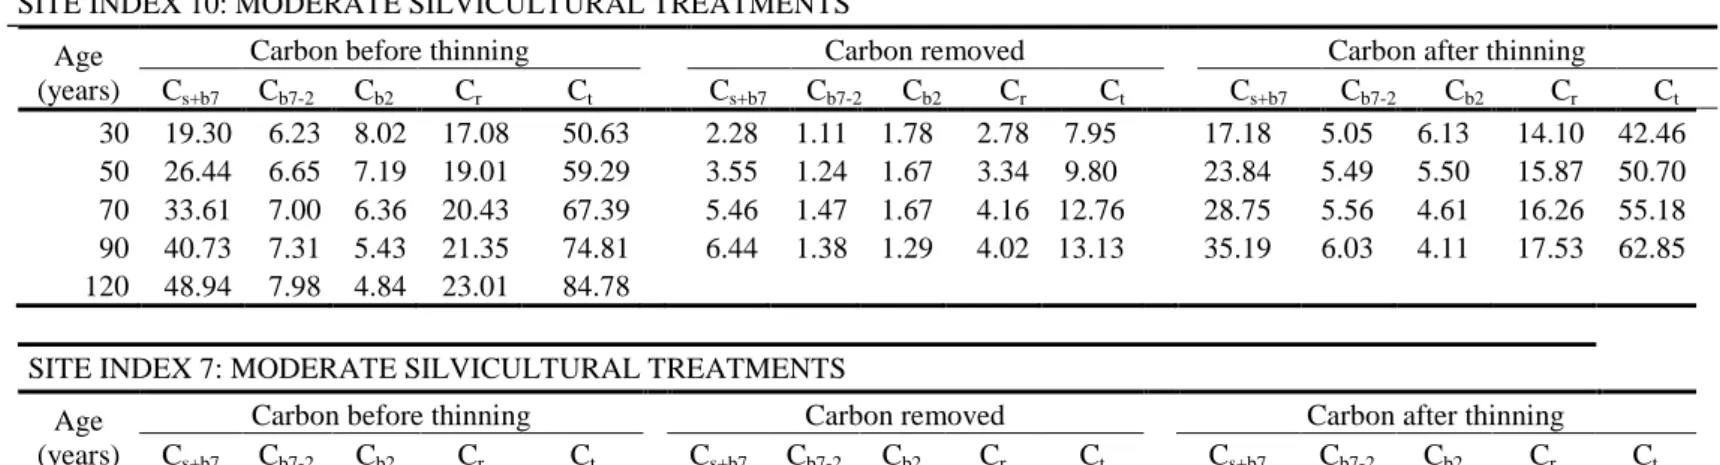
Table 7: Carbon concentrations (t/ha) in different components of rebollo oak for low quality sites.
SITE INDEX 10: MODERATE SILVICULTURAL TREATMENTS
Age (years)
Carbon before thinning Carbon removed Carbon after thinning
Cs+b7 Cb7-2 Cb2 Cr Ct Cs+b7 Cb7-2 Cb2 Cr Ct Cs+b7 Cb7-2 Cb2 Cr Ct
30 19.30 6.23 8.02 17.08 50.63 2.28 1.11 1.78 2.78 7.95 17.18 5.05 6.13 14.10 42.46 50 26.44 6.65 7.19 19.01 59.29 3.55 1.24 1.67 3.34 9.80 23.84 5.49 5.50 15.87 50.70 70 33.61 7.00 6.36 20.43 67.39 5.46 1.47 1.67 4.16 12.76 28.75 5.56 4.61 16.26 55.18 90 40.73 7.31 5.43 21.35 74.81 6.44 1.38 1.29 4.02 13.13 35.19 6.03 4.11 17.53 62.85 120 48.94 7.98 4.84 23.01 84.78
SITE INDEX 7: MODERATE SILVICULTURAL TREATMENTS
Age (years)
Carbon before thinning Carbon removed Carbon after thinning
Cs+b7 Cb7-2 Cb2 Cr Ct Cs+b7 Cb7-2 Cb2 Cr Ct Cs+b7 Cb7-2 Cb2 Cr Ct
30 8.65 2.16 10.18 15.28 36.27 1.78 1.07 1.90 2.56 7.31 6.87 1.09 8.28 12.73 28.96 50 18.44 4.89 7.87 17.13 48.31 2.85 1.19 1.76 3.08 8.88 18.80 4.91 5.47 13.96 43.13 70 26.35 5.93 6.47 18.28 57.03 4.09 1.27 1.59 3.50 10.44 23.97 5.08 4.69 14.79 48.53 90 32.51 6.11 5.62 19.36 53.60 5.00 1.21 1.26 3.47 10.94 29.70 5.44 4.18 15.91 55.23
120 39.95 6.62 5.02 20.84 72.04
where Cs+b7, Cb7-2, Cb2, Cr and Ct are the carbon stored (t ha-1) in the stem and branches larger than 7 cm, branches with a diameter of between 2
5 Carbon Quantification in Pure and Mixed Quercus pyrenaica stands in Central Spain
The objective of this section is to estimate the amount of carbon dioxide fixed by pure and mixed woodlands of Quercus pyrenaica Willd. and Pinus sylvestris L. located in the Central Mountain Range, Spain. At national level, pure Pinus sylvestris stands occupy 678,685.53 hectares, mixed stands of P. sylvestris and Q. pyrenaica 168,739.48 hectares and pure Quercus pyrenaica stands occupy 585,397 hectares (DGCN, 1996). A more complete understanding of the situation might help forest managers to adapt the management of these stands according to their specific composition and thus increase their capacity as carbon sinks.
5.1 Materials and methods
Permanent plot data from Valsaín forest (Central Spain) were used to estimate carbon sequestration by oak stands (Table 8). Three plots (50x50 m2) in each of the forest types (mixed, pure scots pine and pure oak woodland) were established. The total, above and below-ground dry biomass by fraction (stem, roots, branches and needles) were estimated using the Ruiz-Peinado et al. (2012a, 2012b) models (Table 1). Carbon content was estimated as 0.475 of biomass (Ibáñez et al., 2002; IPCC, 2007). The amount of carbon dioxide was estimated by multiplying the carbon amount by 3.67 (ratio between CO2 molecular weight and C atomic weight).
A two-way Analysis of Variance (ANOVA) was conducted to test whether there were significant differences between stands. The factors included in the model were forest structure (coefficient of variation of diameter at breast height distribution) and dominant species (pure stands of Scots pine, pure stands of oak and mixed woodlands) while the response was the total, above and below-ground amount of fixed carbon. The coefficient of variation was previously classified into three classes: coefficients less than 30% were considered homogeneous stands, coefficients more than 40% were considered heterogeneous stands and coefficients between 30 and 40% were considered intermediate stands. As the structure factor was not significant on the first attempt, the ANOVA was repeated using only mixture composition as the explicative factor (results shown below).
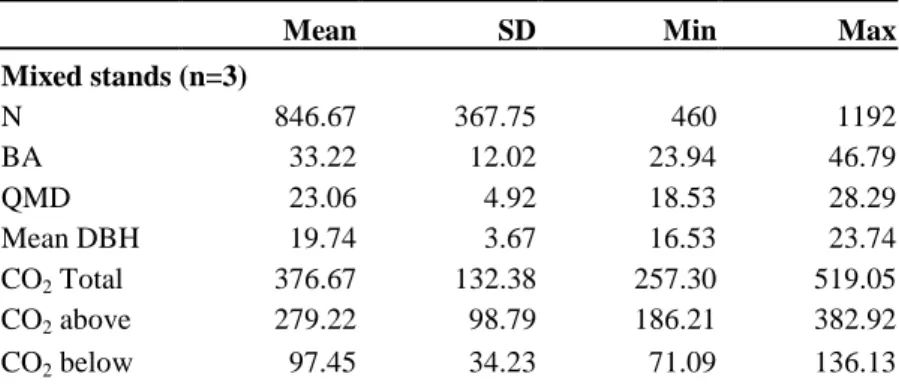
Table 8Main characteristics of sampled plots.
Mean SD Min Max
Mixed stands (n=3)
N 846.67 367.75 460 1192
BA 33.22 12.02 23.94 46.79
QMD 23.06 4.92 18.53 28.29
Mean DBH 19.74 3.67 16.53 23.74
CO2 Total 376.67 132.38 257.30 519.05
CO2 above 279.22 98.79 186.21 382.92
MEDITERRANEAN OAK FORESTS 21
Pine stands (n=3)
N 276 114.33 184 404
BA 24.03 10.99 16.44 36.63
QMD 34.1 9.81 24.48 44.08
Mean DBH 42.07 2.36 39.75 44.46
CO2 Total 472.09 125.61 377.31 614.56
CO2 above 357.79 92.584 289.36 463.14
CO2 below 114.30 33.09 87.952 151.42
Oak stands (n=3)
N 622.67 200.57 480 852
BA 13.86 1.93 12.57 16.08
QMD 17.1 1.52 15.5 18.53
Mean DBH 15.87 0.68 15.09 16.33
CO2 Total 152.82 23.66 133.75 179.30
CO2 above 108.77 17.22 93.89 127.63
CO2 below 44.05 6.61 39.86 51.67
Abbreviations: N: number of trees (tress ha-1); BA: Basal area (m2 ha-1); QMD: Quadratic mean diameter (cm); Mean DBH: Mean diameter at breast height (cm), CO2 total: total amount of CO2 (t ha-1); CO2 above: total amount of carbon dioxide
aboveground (t ha-1); CO2 below: total amount of carbon dioxide belowground (t ha
-1).
5.2 Results and Conclusions
Significant differences were found between the total, above and belowground CO2
stock and specific composition (Table 9). Forest structure (coefficient of variation of diameter at breast height distribution) was not a significant factor.
22 CAÑELLAS, I, SÁNCHEZ-GONZÁLEZ, M., BOGINO, S.M., ADAME P., HERRERO C., ROIG, S., BRAVO, F
.
22
Table 9:Analysis of variance related to total, aboveground and belowground amount of fixed carbon dioxide.
Carbon Dioxide CO2 Total
CO2
Aboveground
CO2
Belowground Source DF Sum of Sq. Pr > F Sum of Sq. Pr > F Sum of Sq. Pr > F
Model 2 161147.46 0.0197 97235.41 0.0213 8071.13 0.0482
Error 6 67725.44 37255.16 4618.71
Correct total 8 228872.91 134490.57 12689.84
Lsmeans
Pure stands of pine 472.09 a 357.79 a 114.30 a
Pure stands of oak 152.82 b 108.77 b 44.05 b
Mixed stands 376.67 ab 279.22 ab 97.45 ab
Note: Different letters denote significant differences in the total, above and below ground CO2 stock between dominant species at the 95% level (Tukey’s test).
6 Final Remarks
Management objectives and techniques in woodlands dominated by Quercus species have changed dramatically over the last few decades, especially in the case of coppices. The fact that these stands are of little economic importance today is in part compensated by their value, for example, as carbon sinks. The identification of this important role of Quercus woodlands allows us to contemplate the development of specific silviculture and to promote investment in the stands. It is also important, in the context of global change, to analyze the dynamics involved in the transformation of Quercus woodlands from carbon sinks to emitters.
MEDITERRANEAN OAK FORESTS 23
It is difficult to compare the results with those of previous studies because of the differences in forest types, site conditions, management systems, monitoring methodology or time scales. Furthermore, this study focuses exclusively on that part of the carbon cycle in forest ecosystems related to wood and cork production. In previous studies, carbon sequestration related to afforestation, agro forestry and forest management projects (Masera et al., 2003) was modelled to estimate the rate of variation of carbon dioxide in different ecosystems. The authors concluded that forest stands of Norway Spruce, Picea abies (L.) Karst, in Northern Europe fixed 120 Mg ha-1of carbon dioxide in 100 year old plantations. Even aged beech forest in Atlantic Europe, during the same period, fixed 150 Mg ha-1. Although the species analysed were different from this study, the results were similar to pure Q. pyrenaica woodlands. Other studies (Lal, 2004) have indicated that woodlands growing in tropical areas can restore 170 Mg ha-1 over a much shorter period of 50 years.
It is currently believed that not only the biomass but also the soil capacity is relevant to carbon dioxide capture and fixation. Previous studies developed in temperate and boreal woodlands (Patenaude, 2004) suggest that forest soils can capture similar amounts of carbon dioxide to that captured by the trees growing in our study site. Therefore, the inclusion of carbon dioxide sequestration by soils would appear to be an important element for future research. However, one of the greatest weaknesses of this kind of study is the lack of information regarding belowground biomass.
7. BIBLIOGRAPHY
AIFF 2013. Estudo prospetivo para o setor florestal. Relatório final. Associação para a competitividade da indústria da fileira florestal. 255 pp.
Adame, P., Cañellas, I., Roig, S., del Rio, M., 2006. Modelling dominant height growth and site index curves for rebollo oak (Quercus pyrenaica Willd.). Ann. For. Sci. 63, 929-940.
AFN 2010. Inventário Florestal Nacional Portugal Continental IFN5, 2005 - 2006. Autoridade Florestal Nacional, Lisboa, 209 pp.
Cañellas, I., del Río, M., Roig, S., Montero, G. 2004. Growth response to thinning in
Quercus pyrenaica Willd. coppice stands in Spanish central mountain. Ann. For. Sci. 61, 243-250.
Cañellas, I., Martínez, F., Montero, G. 2000. Silviculture and dynamics of Pinus sylvestris L.stands in Spain. Investigación Agraria. Sistemas y recursos forestales Fuera de serie, 233-254.
Cañellas, I., Sánchez-González, M., Bogino, S.M., Adame, P., Herrero, C., Roig, S. Tomé, M., Paulo, J.A., Bravo, F. 2008. “Silviculture and carbon sequestration in Mediterranean Oak forests”. In: F. Bravo et al. (eds.), Managing Forest Ecosystems: The Challenge of Climate Change. Springer Science. 2008. Coelho, M.B., Godinho, J.M. 2002. SUBER DATA 2 - Base de dados de sobreiro -
24 CAÑELLAS, I, SÁNCHEZ-GONZÁLEZ, M., BOGINO, S.M., ADAME P., HERRERO C., ROIG, S., BRAVO, F
.
24
Coelho, M.B., Paulo, J.A., Palma, J.H.N., Tomé, M. 2012. Contribution of cork oak plantations installed after 1990 in Portugal to the Kyoto commitments and to the landowners economy. Forest Policy and Economics 17: 59 – 68.. doi: http://dx.doi.org/10.1016/j.forpol.2011.10.005
DGCN, 1996. II Inventario Forestal Nacional 1986-1996. Direccion General de Conservación de la Naturaleza, Ministerio de Medio Ambiente, Madrid. Elena Roselló, R. 1997. Clasificación biogeoclimática de España Peninsular y
Balear. MAPA, Madrid.
Faias, S. P., Palma, J. H. N., Barreiro, S. M., Paulo, J. A., Tomé, M. Resource communication. sIMfLOR – platform for the Portuguese forest simulators. Forest Systems 21(3): 543 – 548. http://dx.doi.org/10.5424/fs/2012213-02951 Gil, L., Pereira, C., Silva, P. 2005. Cork and CO2 fixation. Proceedings of
SUBERWOOD: New challenges for integration of cork oak forests and products, Universidad de Huelva, Huelva, 20-22 de octubre de 2005.
Ibáñez, J.J., Vayreda, J., Gracia, C. 2002. Metodología complementaria al Inventario Forestal Nacional en Catalunya. In: Bravo, F., del Río, M., del Peso, C. (Eds.), El Inventario Forestal Nacional. Elemento clave para la gestión forestal sostenible. Fundación General de la Universidad de Valladolid, pp. 67-77.
ICONA, 1998. Segundo Inventario Forestal Nacional, España. Ministerio de Medio Ambiente, Dirección General de Conservación de la Naturaleza. 337p. IPCC, 2007. Intergovernmental Panel on Climate Change 2007. www. ipcc2007. Lal, R. 2004.Soil carbon sequestration to mitigate climate change. Geoderma, 123,
1- 22.
Masera, O., Garza-Caligaris, F., Kanninen, M., Karjalainen, T., Liski, J., Nabuurs, G., Pussinen, A., De Jong, B., Mohren, G. 2003. Modeling carbon sequestration in afforestation, agroforestry and forest management projects: the CO2FIX V.2 approach. Ecological Modelling 164, 177–199.
Ministerio de Medio Ambiente, Universidad de Castilla-La Mancha, 2005. Evaluación preliminar de los impactos en España por el efecto del cambio climático. p. 846.
Montero, G., Cañellas, I., Ruíz-Peinado, R. 2001. Growth and yield models for
Pinus halepensis Mill. Investigación Agraria. Sistemas y Recursos Forestales 10, 179-201.
Montero, G., Cañellas, I. 1999. Manual de forestación del alcornoque (Quercus suber L.). MAPA-INIA. 103 p.
Montero, G., Ruiz-Peinado, R., Muñoz, M. 2005. Producción de biomasa y fijación de C02 por los bosques españoles. Monografías INIA: Seria Forestal nº 13. 270 p.
Nabuurs, G., Mohren, F., Dolman, H. 2000. Monitoring and reporting carbon stocks and fluxes in Dutch forests. Biotechnol. Agron. Soc. Environ. 4, 308-310. Natividade, J. Vieira, 1950. Subericultura. Ministério da Economia, Direcção Geral
MEDITERRANEAN OAK FORESTS 25
Paulo, J.A. 2011. Desenvolvimento de um sistema para apoio à gestão sustentável de montados de sobro. Tese apresentada para obtenção do grau de Doutor em Engenharia Florestal e dos Recursos Naturais. Universidade Técnica de Lisboa, Instituto Superior de Agronomia, Lisboa, Portugal, 188 pp. (http://hdl.handle.net/10400.5/3850)
Paulo, J.A., Faias, S.P., Tomé, M. 2012. SUBER v5.0. Manual do utilizador. Publicações FORCHANGE. RT1/2012. Universidade Técnica de Lisboa. Instituto Superior Agronomia. Centro de Estudos Florestais. Lisboa. 41 pp. Paulo, J.A., Tomé, M. 2010. Predicting mature cork biomass with t years of growth
from one measurement takne at any other age. Forest Ecology and Management 259: 1993-2005. http://dx.doi.org/10.1016/j.foreco.2010.02.010 Patenaude, G., Hill, R., Milne, R., Gaveau, D., Briggs, B., Dawson, T. 2004
Quantifying forest above ground carbon content using LiDAR remote sensing Remote sensing of environment, 93, 368-380.
Pereira H. 2007. Cork: Biology, production and uses- Elservier 336 p.
Pignard, G., Dupouey, J., Arrouays, D., Loustau, D. 2004. Carbon stocks estimates for French forests. Biotechnol. Agron. Soc. Environ. 4, 285-289.
Ruiz-Peinado, R., Montero, G., del Río, M. 2012a. New models for estimating the carbon sink capacity of Spanish softwood species. Forest systems 20: 176-188.
Ruiz-Peinado, R., Montero, G., del Río, M. 2012b. Biomass models to estimate carbon stocks for hardwood tree species. Forest systems 21: 42-52.
Sánchez-González, M., Tomé, M., Montero, G. 2005. Modelling height and diameter growth of dominant cork oak trees in Spain. Ann. For. Sci. 62: 633-643.
Sánchez González, M., del Río, M., Cañellas, I., Montero, G. 2006. Distance independent tree diameter growth model for cork oak stands. For. Ecol. Manage. 225: 262-270.
Sánchez-González M., Cañellas I., Montero G. 2007. Base-age invariant cork growth model for Spanish cork oak (Quercus suber L.) forests. Eur. J. Forest Res. 127(3): 173-182.
Sprugel, D.G. 1983. Correcting for bias in log-transformed allometric equations. Ecology 64 (1): 209-210.
Tomé, M. 2004. Modelo de crescimento e produção para a gestão do montado de sobro em Portugal. Relatório final do projecto POCTI/AGR/35172/99. Publicações GIMREF RFP 1/2004. Universidade Técnica de Lisboa, Instituto Superior de Agronomia, Centro de Estudos Florestais, Lisboa, Portugal. 89 pp. http://hdl.handle.net/10400.5/2355.
Tomé, M., Meyer, A., Ramos, T., Barreiro, S., Faias, S.P., Paulo, J., Cortiçada, A., Correia, A. 2007. Equações para a estimação de variáveis da árvore desenvolvidas no âmbito do tratamento dos dados do Inventário Florestal Nacional 2005-2006. Publicações GIMREF. RT 3/2007. Universidade Técnica de Lisboa. Instituto Superior de Agronomia. Centro de Estudos Florestais. Lisboa, Portugal.
1990-26 CAÑELLAS, I, SÁNCHEZ-GONZÁLEZ, M., BOGINO, S.M., ADAME P., HERRERO C., ROIG, S., BRAVO, F
.
26
Climate Change and the Kyoto Protocol. Portuguese Environmental Agency, Amadora. 614 pp.
Zellner, A. 1962. An efficient method of estimating seemingly unrelated regressions and tests for aggregation bias. J. Am. Stat. Assoc. 348-368.
8. AFFILIATIONS
I. Cañellas, Joint Reserach Unit INIA-UVa, Dept. of Forest Systems and Resources, CIFOR-INIA, Madrid, [email protected]
M. Sánchez-González, Joint Reserach Unit INIA-UVa, Dept. of Forest Systems and Resources, CIFOR-INIA, Madrid, [email protected]
S.M.Bogino. Dept. of Agricultural Sciences. State University of San Luis, Argentina. [email protected]
P.Adame, Joint Reserach Unit INIA-UVa, Dept. of Forest Systems and Resources, CIFOR-INIA, Madrid, [email protected]
D.Moreno-Fernández, Joint Reserach Unit INIA-UVa, Dept. of Forest Systems and Resources, CIFOR-INIA, Madrid, [email protected]
C.Herrero, Joint Reserach Unit INIA-UVa, Dept. of Forest Resources, University of Valladolid, Palencia, Spain [email protected]
S. Roig, Dept. Sistemas y Recursos Naturales, ETS de Ingeniería de Montes, Forestal y Medio Natural, UPM, Spian [email protected]
M. Tomé, University of Lisbon, Instituto Superior de Agronomia, Centro de Estudos Florestais, Lisboa, [email protected]
J. A. Paulo, University of Lisbon, Instituto Superior de Agronomia, Centro de Estudos Florestais, Lisboa, [email protected]