Santiago Pérez, Higinio Facchini, Alejandro Dantiacq, Gastón Cangemi GRID TICs, National Technological University
Mendoza, 5500, Argentine and
Javier Campos
Department of Informatics and Systems Engineering, Zaragoza University Zaragoza, 50018, Spain
ABSTRACT
With the continuing development of the wireless technologies (Wi-Fi, 3G, 4G, WiMax and Bluethooth), the study of wireless multimedia transmissions has gained lately more attention. For example, the expectations of the company leaders on the growth of Wi-Fi video traffic has updated the lines of research on the standard IEEE 802.11e introduced to provide QoS (Quality of Service) to WLAN (Wireless LAN ) networks. In this paper we updated with greater accuracy, using other resources and the experience gained since the emergence of the standard, the work carried out previously on the quantitative impact of each EDCA (Enhanced Distributed Channel Access) parameter on the overall performance of the mechanisms MAC. A quantitative analysis of the optimizations that can be achieved has been performed by simulation. We use a node model EDCA 802.11e with the tool Möbius of the University of Illinois, which supports an extension of SPN (Stochastic Petri Networks), known as HSAN (Hierarchical Stochastic Activity Networks), what favors the contrast with other tools or mathematical resources. We use a realistic scenario formed by Wi-Fi stations with the capacity to transmit voice, video and best effort traffic. The results show that the default setting of EDCA parameters is not optimal, and that with an appropriate selection, very significant improvements can be obtained.
Keywords: QoS, WLAN, EDCA 802.11e, MAC
Parameters, Analysis of traffic.
1. INTRODUCTION
The services of wireless mobile data are on their way to meet the needs of many users on the network. The voice services with mobile devices are already considered as a necessity by most people. And the mobile devices for data services, video, and TV are rapidly becoming an essential part of the everyday life of consumers. The proliferation of handsets, laptops and tablets on mobile networks is a major traffic generator, because these devices offer the consumer content and applications not supported by previous generations of mobile devices. The projections for the next 5 years show a steady growth in the mobile video, despite macroeconomic conditions in many parts of the world. Because of that fact, the contents of mobile video have much higher bit rates than other types of mobile content, mobile video will generate much of the growth of future mobile traffic. It is expected for the 2018 that 65% of the total wireless traffic will be associated with video applications [1].
Up until a few years ago, the Wi-Fi traffic was more general, and included light flows of voice traffic. The greatest burden of the video traffic will be a test for the standard EDCA IEEE 802.11e and the algorithms of admission control, to sustain the QoS requested by the user.
The principal contributions of this article are i) to specify a new research methodology that simulates Wi-Fi dynamics
with conclusive quantitative results concerning its impact over a WLAN 802.11e network with QoS configured using default static parameters, ii) to demonstrate that the standard EDCA IEEE 802.11e mechanism using default static parameters provides traffic differentiation but it is possible to obtain higher performance with other static values, and iii) the contributions and conclusions made using an EDCA model with SPNs that complement, enrich, and facilitate comparison with precedents within Wi-Fi network knowledge obtained from pure trace collection or other types of analytical studies and modelling using mathematical tools for different real and hypothetical contexts.
Researchers and the industry could use these data for their proposals to algorithms of tuning and for manual adjustments of the parameters in the EDCA devices that have this capacity available. Actually, some products with certification EDCA/WMM (Wi-Fi MultiMedia) allow the user to change the default values of the parameters. The rest of this document is structured as follows. Section 2 provides a general view of the EDCA 802.11e standard. Section 3 presents the commercial deployment of the standard IEEE 802.11e EDCA. Section 4 describes the Wi-Fi station model built with HSANs and simulation scenarios defined for experimental evaluation. Section 5 gives the impact of the EDCA parameter on the relative performance. Section 6 describes a case study that compares the relative performance of the traffic using the default parameters with enhancement settings. Section 7 summarizes the most significant conclusions.
2. BRIEF DESCRIPTION OF EDCA 802.11e DCF and PCF in 802.11
The DCF (Distributed Coordination Function) 802.11 only provides the best-effort service [2]. As indicated previously, multimedia and real-time applications limited in time require certain guarantees. In DCF, all stations are competing for the channel with the same priority. There is no mechanism of differentiation to provide better service for multimedia traffic or real-time with regard to the application of common data. Although PCF (Point Coordination Function) 802.11 was designed to support multimedia applications limited in time, it presents problems which lead to a poor performance of QoS. This is due to the fact that PCF only defined a scheduling algorithm of round-robin for simple class or category of traffic, and several QoS requirements cannot be manipulated. On the other hand, a common problem of QoS, both for DCF and PCF, is that they do not specify any mechanism of admission control. When the traffic load is very high, the performance of both functions is degraded.
EDCA in 802.11e
function has been proposed for MAC layer, known as Hybrid Coordination Function (HCF) [2] (Figure 1). HCF uses a contention-based channel access method, also known as Enhanced Distributed Channel Access (EDCA), which operates concurrently with a polling-based, HCF-controlled channel access method (HCCA). The access point (AP) and the stations (STAs) using QoS facilities are called QoS-enhanced AP (QAP) and QoS-enhanced STAs (QSTAs), respectively.
Fig. 1MAC Architecture
The optimization process of QoS of EDCA is based on a generalization of contention-based DCF. Initially heterogeneous traffic reaches the MAC layer including voice, video, best effort, background and they are mapped to the corresponding Access Categories (ACs). In the MAC layer there are 4 queues, one for each AC, which receive the packets according to a specific priority of upper layer. Each AC acts as a separate DCF entity competing according to its own contention parameters (CWmin[AC], CWmax[AC], AIFS[AC] and TXOPLimit[AC]). Each AC maintains a contention window size variable (CW), which is initialized to CWmin. The CW is incremented after transmission failures until it reaches CWmax, and is reset to CWmin after a successful transmission. The maximum allowed duration for each acquired transmission opportunity is determined by TXOP limit. Once a station acquires a transmission opportunity, it may transmit multiple frames within the assigned TXOP limit. Assigning different TXOP values to ACs, therefore, achieves differential airtime allocations. To achieve differentiation in EDCA, instead of using fixed DIFS (Distributed Interframe Space) as in the DCF, an AIFS (arbitrary IFS) is applied (Figure 2), where the AIFS for a given AC is determined by the following equation:
AIFS[AC] =SIFS + AIFSN[AC] * SlotTime where AIFSN is AIFS number and determined by the AC and physical settings, SlotTime is the duration of a time slot, and SIFS is the Short Inter-Frame Space of DCF. The highest priority will be given to the AC with the smallest AIFS.
In general, smaller values of CWmin[AC], CWmax[AC], AIFS[AC], shorter delays of channel access to the corresponding AC, and the higher the priority for access to he medium. And to larger values of TXOP[AC], more time to retain the channel corresponding to the AC. A contention-based mechanism for admission control is also suggested for 802.11e, which calls for both QAP and QSTA support.
Fig. 2IFS Relationships
3. DEPLOYMET ASPECTS OF EDCA 802.11e There are commercial products that implement some features of EDCA so common, although the adoption of 802.11e is still not complete and with some years of experience in the voice traffic, but little mature using video. As with several standards, and due to the fact that there are optional components and suggestions of implementation, some manufacturers solve their own evolution of QoS in WLANs with proprietary alternatives and in their high-end devices. As a first step agreed, groups of industries (such as the Wi-Fi Alliance) and industry leaders defined in 2004 the fundamental requirements of the WLAN QoS through its EDCA/WMM ( Wi-Fi MultiMedia) [3-5], securing the support of the key features and interoperation through its certification programs. The APs and network boards are commercially available under the name WMM.
In WMM the mapping of categories of services given by ToS (Type of Service) or DS (Differentiated Services) of the IP header, or by CoS (Class of Service) of standard VLANs 802.1Q, is used with EDCA 802.11e. Some low-cost products only support the empowerment of the WMM QoS service. In this way, the AP is configured with the default EDCA IEEE 802.11e parameters. In a complementary manner, with proprietary solutions, some manufacturers allow the manual configuration of the EDCA parameters, in the lines of advanced wireless products [6].
On this basis, the natural evolution in this field of study has been and still is to analyze the mechanisms of inclusion of enhanced Admission Control Algorithms in order to ensure the stability of the system. Precisely, and even though the signalling messages required to support the procedure of admission control are defined in the 802.11e standard, the rules of admission are still open. In this way, it is noted that the latest versions of 802.11e and some commercial equipment allow a basic mechanism of update of the EDCA parameter, before any changes could be determined in the network. This implies a greater ease at the time of the effective implementation of the improvements that decided to run the network administrator using these configurations as variables of the Wi-Fi system. The optimization of the EDCA parameters is a simple and effective mechanism to increase the capacity of handling simultaneous heterogeneous traffic and with certain restrictions of QoS, and therefore to use less APs by quantity of STAs, allowing the reduction of costs for equipment.
[image:2.595.311.527.69.209.2] [image:2.595.72.287.179.319.2]parameter, there are some most relevant contributions. In [7] the Authors study the behavior of the EDCA parameter. The work confirmed the ability of differentiation of the standard EDCA IEEE 802.11e, when in the experimental scenario there are also stations that run on DCF. Unfortunately, for the development of that study it was assumed that each EDCA station has a simple AC, and therefore, a single traffic, which prevented to analyze the interference between different types of flows, and as a result, the virtual collisions that can incur at the same station could not be taken into account. In addition, measurements of performance were conducted in conditions of saturation, i.e. at a particular operational condition, limiting the accuracy of the results and the quality of the conclusions. While in [8] the Authors present a study of the behavior of the parameters in a scenario that uses a mixture of voice traffic, video, best effort, and background. For the simulations they used the simulator Opnet Modeler [9]. As in the previous case, the scenario did not include sources of interference and/or error. In order to overtake the above limitations, in this paper we model the standard in its entirety, we resolve some inconsistencies, eliminate the simplifications, and we include interference and a scenario of frequent use by researchers at the EDCA standard. The modeling of each Wi-Fi station is conducted with Petri Nets which favors the comparison with the contributions of the authors that use other simulators. The work [8] has been taken as a reference in terms of the methodological aspects, by varying the parameters EDCA on a subset of values. Experimental Model
To experimentally evaluate the function of the EDCA 802.11e mechanism, a simulation model is adopted that uses Hierarchical Stochastic Activity Networks (HSAN) [10-11] executed on a Möbius simulator [12] (Figure 3 y 4). HSANs are a variety of Stochastic Petri Nets (SPNs). This model comprises a precise and detailed EDCA implementation function associated with QoS stations, considering both functional and temporal perspectives. Several international authors have sufficiently validated the model in the literature [13-19]. From the modelling perspective, the model also shows significant flexibility in the following aspects: ease of including modifications or refinements, many different performance metrics may be obtained without structural modifications, and it may be used as a base structure for building more complex and higher-order models. To avoid the process of building a network model for each simulation scenario, an important advantage is that the adopted model represents a simple QoS-supporting station. This model is later replicated to obtain the required simulation scenario. The user parameterises the number of replications, which the Möbius modelling tool completely automates. This tool provides significant flexibility in the evaluation process, including a faster analysis of different network scenarios. Experimental scenario
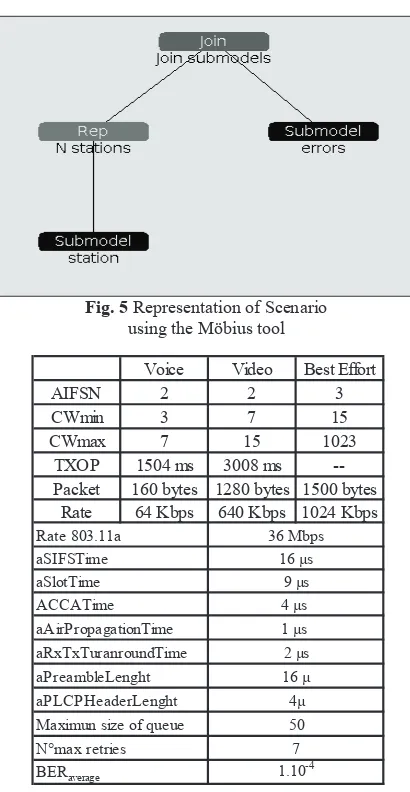
The experimentation scenario includes an error model, which is a variation of the Gilbert-Elliot error model [20]. An average bit error rate (BER) of 10-4was used as was the steady state probability of encountering the channel in interference at 13.3%. It considers traffic generated by stations operating on the same frequency bands while varying the load by increasing the number of active stations from 1 to 20, as in Figure 5.
Fig. 3Partial view of the model on the interface of the Project Editor of Möbius
Fig. 4Partial view of the model on the interface of the Möbius strip Study Editor
Our analysis used general 802.11a parameters at 36 Mbps and default EDCA configuration [1]. Stations were configured for the transmission of three different traffic types: an isochronic voice steam with fixed periods of 20 ms, a video stream with Poisson distribution, and a best effort stream with Pareto distribution [21-24] and 1.9 shape parameter (with average throughput equivalent to the Poisson distribution). The Table 1 shows all parameters and configuration values.
[image:3.595.312.527.70.330.2] [image:3.595.313.525.351.576.2]Fig. 5Representation of Scenario using the Möbius tool
Voice Video Best Effort
AIFSN 2 2 3
CWmin 3 7 15
CWmax 7 15 1023
TXOP 1504 ms 3008 ms
--Packet 160 bytes 1280 bytes 1500 bytes Rate 64 Kbps 640 Kbps 1024 Kbps
16 μ 4μ 50 7 1.10-4 Rate 803.11a
aSIFSTime aSlotTime ACCATime
Maximun size of queue N°max retries BERaverage
aRxTxTuranroundTime aPreambleLenght aPLCPHeaderLenght
2 μs aAirPropagationTime 1 μs 36 Mbps
16 μs 9 μs 4 μs
Table 1802.11 parameters in 36 Mpbs and default EDCA used in the experiment
Measured performance metrics are absolute or direct performance, relative performance, packet loss, average delay of queue, and average queue size.
5. IMPACT OF EDCA PARAMETERS IN RELATIVE PERFORMANCE
Using the characteristics of the traffic generated by the stations STA and the configuration 802.11a in 36 Mbps, it was proceeded to assess the relative performance varying each one of the parameters of service differentiation: AIFSN, CWmin, CWmax and TXOP. These tests were carried out in a hop count of 4 on the number of stations, starting with 4, and following with 8, 16 and 20. These simplifications in the experimental simulations did not alter the quality of the conclusions. On the other hand, for the preliminary analysis a broader set of possible combinations of the parameters was used, although for the purposes of the exposure and representation in the figures, the more compelling and relevant curves have been selected.
Impact of AIFSN
Initially, the tests retained the configurations, using the default parameters of CWmin, TXOP and CWmax, but varying AIFSN. Figure 6 shows the relative performance of voice traffic as function of different combinations of
values of AIFSN. The AIFSN values in the graph correspond to voice, video, and best effort traffic, in that order. It is noted that the values 2-2-3, corresponding to the default configuration, produce the most negative behavior, leaving a loss of the voice relative performance in the order of 28% for 20 stations. In addition, it emphasizes that the provision of voice traffic has less loss when different values for voice and video traffic are assigned. This behaviour is expected when different AIFSN are used, to prioritize voice traffic on the video. For the 2-3-5 values the loss is reduced to 15 %, and with 2-4-6 to 11 %.
[image:4.595.74.279.68.464.2]Fig. 6 Relative performance of voice traffic as function of different configurations of the AIFSN
Figure 7 shows the relative performance of the video traffic based on the same combinations used for voice traffic. The video traffic is less influenced than voice traffic. It is noted again that the values 2-2-3, corresponding to the default configuration, produce the most negative behavior, with a loss of video performance in the order of 18 %. For the 2-3-5 values the loss is reduced to 5 %, and with the 2-4-6 to 2 %.
In conclusion, moving away the best effort traffic AIFSN value from the video traffic one, and also this one from that of voice traffic, leads to a better voice and video traffic behavior.
[image:4.595.312.525.207.361.2] [image:4.595.312.525.528.683.2]Fig. 8 Relative performance of best effort traffic as function of different configurations of the AIFSN
parameter Impact of CWmin
For experimental trials of CWmin, we used the default settings by TXOP and CWmax, varying CWmin and adopting the values 2-3-5 of AIFSN. It was noted that the voice traffic and best effort had similar behavior, regardless of the values of CWmin.
Figure 9 shows the relative performance of the video traffic. This traffic is less influenced by CWmin than that of AIFSN. It is noted again that the values 3-7-15, corresponding to the configuration by default, produce the worst behavior, with a loss of video performance in the order of 5 %. For the values 7-31-63 the loss is reduced to a little more than 3 %.
In conclusion, moving away the best effort traffic CWmin value from the video traffic one, and also this one from that of voice traffic, leads to a better video traffic behavior. Then, voice traffic can be promoted by increasing the CWmin of the rest of traffic.
Fig. 9 Relative performance of video traffic as function of different configurations of the CWmin parameter Impact of CWmax
In the case of the experimental trials of CWmax, we retained the initial configurations of TXOP, but varying CWmax and adopting the values 2-3-5 for AIFSN and 7-31-63 for CWmin. It was noted that the video and best effort traffic had similar behavior, regardless of the values of CWmax.
Figure 10 shows the relative performance of the voice traffic. This traffic is less influenced by CWmax than by AIFSN. It is noted that the values 15-63-1023 produced
[image:5.595.66.282.75.229.2]the most negative behavior, with a loss of voice performance in the order of 2.5 %. For the values 63-1023 the loss is reduced to a little over 1 %. And for 31-127-1023 a little more than 0.8 %. We can conclude that there is a better behavior of voice traffic when the value of CWmax of the best effort traffic moves away from the video CWmax, and this from the CWmax for voice traffic. That is, voice traffic can be slightly favoured by an increase in the CWmax of the rest of the traffic.
Fig. 10 Relative performance of voice traffic as function of different configurations of the CWmax parameter Impact of TXOP
[image:5.595.311.525.176.325.2]Finally, experimental testing the TXOP was analyzed. For this parameter we used the following encoding: the value TXOP=1 should be considered equal to TXOP=1,504 ms, and proportionately for the other values. Modified TXOP, but adopting the values of 2-3-5 for AIFSN, 7-31-63 for CWmin and 31-63-1023 for CWmax. It was noted that the relative performance of video traffic had similar behavior, regardless of the values of TXOP. When evaluating the behavior of voice and best effort traffic, note that the TXOP affects less than the AIFSN parameter.
[image:5.595.72.285.472.621.2]Figure 11 shows the relative performance of the voice traffic. It is noted that the values 1-2-0, corresponding to the configuration by default, produce the best behavior causing a performance loss of voice in the order of 0.5 % for 20 stations. For the values 1-4-6 the loss extends to 1.3 %, and with the values 1-10-10 to 1.4 %.
[image:5.595.312.527.549.696.2]performance loss of best-effort in the order of 90 % to 20 stations, and always below from 8 station for the other configurations of TXOP. These others settings have a similar behavior with a loss of 80 %
Fig. 12 Relative performance of best effort traffic as function of different configurations of the TXOP parameter
6. COMPARISON OF THE PARAMETERS BY DEFAULT WITH ENHANCEMENT SETTINGS From the analysis of the differential impact of each EDCA parameter, we carried out a comparison of the network behavior using the default parameters versus the other ones, selected to achieve a better performance. These new parameters were the so-called enhancement settings because they showed a better overall network performance than the default ones. We preserved the general configurations of 802.11a in 36 Mbps and the types of traffic used in the experiments described previously. Table 2 presents the enhancement settings adopted for the test.
Voice Video Best Effort
AIFSN 2 3 5
CWmin 7 31 63
[image:6.595.310.526.106.267.2]CWmax 31 63 1023 TXOP 1,504 ms 15,040 ms 15,040 ms Packet 160 bytes 1280 bytes 1500 bytes Rate 64 Kbps 640 Kbps 1024 Kbps
Table 2Enhancement Parameters adopted for the test In Figures 13, 14 and 15 the comparisons of the flows of voice, video and best-effort performance are depicted, configured with the default parameters and with the enhancement parameters.
The voice traffic with the enhancement reaches a maximum of 1.26 Mbps for 20 stations, with an improvement of 36.62 %. While video traffic reaches a maximum of 13.030 Mbps for 20 stations, improving in 20.03 %. Finally, the best effort traffic reaches a peak of 12.22 Mbps for 12 stations from where the performance falls down. It reaches an improvement of 18.87 % in the maximum performance.
7. CONCLUSIONS
This study used simulation model variants built with HSANs to evaluate EDCA 802.11e protocol conditions for supporting QoS in 802.11a scenarios at 36 Mbps. Scenarios included diverse traffic, electromagnetic interferences, and considered traffic interactions with different priorities.
In this context and for all proposed scenarios metrics were exhaustively analysed for direct and relative performance,
[image:6.595.71.285.123.277.2]queue size, delay of queue, queue loss, and collision. For the sake of brevity, we discussed the relative performance.
[image:6.595.310.525.425.620.2]Fig. 13 Comparison of the performance in Mbps of voice traffic with default and enhancement parameters
Fig. 14 Comparison of the performance in Mbps of video traffic with default and enhancement parameters
[image:6.595.89.263.437.518.2]particular interest has the opposite effect that the value of the TXOPs has in the system performance. Larger values of TXOP, especially for video and best effort traffic, will produce improvements in their performance. On the contrary, the voice traffic falls down when using higher values of TXOP for the rest of the traffic.
It has been proven that with an appropriate selection of EDCA parameters, significant improvements for each individual traffic and overall network performance can be achieved. For example, to the setting used, voice traffic increases by 36 %, the video traffic by 20% and the best effort by 19 %. For the whole network, we got an improvement of 25% in performance with respect to the use of the default parameters.
The industry could use these data for manual adjustments of the parameters in the EDCA devices that have this capacity available. Some products with certification EDCA/WMM (Wi-Fi MultiMedia) allow to change the default values of CWmin, TXOP and CWmax. The information could also be used by the researchers that apply in its proposals static values of the EDCA parameters or for rapid convergence of their tuning algorithms [25]. These algorithms, which take into account the dynamic state of the system and experience, always work in points of improvement, they set the EDCA parameter to new values, ignoring the random changes in the Wi-Fi and all types of traffic present, as opposed to maintain the static values by default.
8. REFERENCES
[1] Cisco Visual Networking Index: Global Mobile Data Traffic Forecast Update, 2013–18, http://www.cisco.com/ c/en/us/solutions/collateral/service-provider/visual-networking-index-vni/white_paper_c11-520862.html, (Accessed July 16th, 2014).
[2] ANSI/IEEE Std 802.11, 2012 Edition (R2012), 2012. [3] http://www.wi-fi.org/discover-wi-fi/wi-fi-certified-wmm-programs, (Accessed July 16th, 2014).
[4] http://www.wi-fi.org/news-events/newsroom/wi-fi- alliance-introduces-two-new-certification-programs-for-advanced, (Accessed July 16th, 2014).
[5] www.cisco.com/en/US/prod/collateral/wireless/
ps5678/ps12534/data_sheet_c78-709514.html, (Accessed July 26th, 2014).
[6] http://www.wi-fi.org/certified-products-search, (Accessed July 16th, 2014).
[7]G. Bianchi, “Understanding 802.11e Contention-Bases Priorization Mechanism and Their Coexistence with Legacy 802.11 Stations”, IEEE Network, vol. 19, no. 4, pp. 28-34, 2005.
[8] J. Villalón, P. Cuenca and L. Orozco, “Estudio de QoS en WLANs IEEE 802.11e”, I Congreso Español de Informática (CEDI 2005), Publicación: Actas de las Jornadas de Paralelismo, I.S.B.N.: 84-9732-430-7, Granada, España, Setiembre 2005, pp. 267-274.
[9] Opnet Technologies Inc., OPNET, Available at: <
http://www.riverbed.com/products/performance-management-control/opnet.html?redirect=opnet>, 2014, (Accessed July 16th, 2014).
[10] R. Vasques, “Wireless Real-Time Communication for Industrial Environments using the IEE 802.11e Communicationprotocol”, <http://paginas.fe.up.pt/
~vasques/ieee80211e/>, (Accessed July 16th, 2014). [11] W. Sanders and J. Meyer, “Stochastic Activity Networks: Formal Definitions and Concepts”, Lectures Notes in Computer Science, vol. 2090, 2001, pp. 315–343.
[12] W. Sanders et al., "Model-Based Environment for Validation of System Reliability, Availability, Security, and Performance", <https://www.mobius.illinois.edu/>, (Accessed July 16th, 2014).
[13] R. Moraes, P. Portugal and F. Vasques, “A Stochastic Petri Net Model for the Simulation Analysis of the IEEE 802.11e EDCA Communication Protocol”, In Proceedings of the 11th IEEE International Conference on Emerging Technologies and Factory Automation (ETFA), Prague, Czech Republic, September 20-22, 2006, pp. 38-45. [14] S. Mangold, C. Sunghyun, O. Klein, G. Hiertz and L. Stibor, “IEEE 802.11 wireless LAN for quality of service”, European Wireless ‘02, vol. 1, 2002, pp. 32–39. [15] S. Wiethoelter and C. Hoene, “Design and verification of an IEEE 802.11e EDCF simulation model in NS-2.26 (TKN-03-19)”, Technical University Berlin -Telecommunication Networks Group, Technical Report, 2003
[16] S. Wiethoelter, M. Emmelmann, C. Hoene and A. Wolisz, “TKN EDCA model for NS-2 (TKN-06-003)”,Technical University of Berlin - Telecommunication Networks Group, Technical Report, 2006.
[17] S. Pérez, “Tuning Mechanism of EDCA parameters: Algorithm MTDA”, Thesis PhD Engineering, Universidad de Mendoza, Mendoza, Argentina, <http://www.um.edu.ar>, proximal publication, 2014.
[18] S. Perez, J. Campos, H. Facchini, G. Mercado and L. Bisaro, “EDCA 802.11e performance under different scenarios – Quantitative analysis”, AINA 2013 – 27th IEEE International Conference on Advanced Information Networking and Aplications, Barcelona, España, pp. 25-28 March 2013.
[19] S. Perez, J. Campos, H. Facchini, G. Mercado and L. Bisaro, "Throughput Quantitative Analysis of EDCA 802.11e in Different Scenarios”, Journal of Computer Science and Technology (JCS&T), vol. 13, no. 1, ISSN 1666-6038, abril 2013.
http://journal.info.unlp.edu.ar/journal/journal35/papers/JC ST-Apr13-3.pdf, (Accessed July 15th, 2014).
[20] A. Willig, A. Wolisz, “Ring stability of the PROFIBUS tokenpassing protocol over error-prone links”, IEEE Transactions on Industrial Electronics, Vol. 48, No. 5, 2001, pp. 1025–1033.
[21] S. Pérez, H. Facchini, G. Mercado and L. Bisaro, “Estudio sobre la Distribución de Tráfico Autosimilar en Redes Wi-Fi”, XVIII CACIC 2012, Congreso Argentino de la Computación 2012, <http://cs.uns.edu.ar/cacic2012>, (Accessed July 16th, 2014).
[22]G. He and J. Hou, “An In-Depth, Analytical Study of Sampling Techniques for Self-Similar Internet Traffic”, 25th IEEE International Conference on Distributed Computing Systems, ICDCS 2005, 2005, pp. 404-413. [23]M. Li, “Self-similarity and long-range dependence in teletraffic”, Proceedings of the 9th WSEAS international conference on Multimedia systems & signal processing, pp. 19-24, 2009, MUSP'09, World Scientific and Engineering Academy and Society (WSEAS), May 2009. [24] M. Abu-Tair, G. Min, Q. Ni and H. Liu, “An adaptive medium access control scheme for mobile ad hoc networks under self-similar traffic”, The Journal of Supercomputing, vol. 53, no. 1, pp. 212-230, Kluwer Academic Publishers, July 2010.
[25] S. Pérez, J. Campos, H. Facchini and G. Cangemi, "Tuning Mechanism for IEEE 802.11 e EDCA Optimization", Revista IEEE Latin America Transactions, vol. 11, no. 4, June 2013, pp. 1134-1142.