1
Aboveground biomass equations for sustainable production of fuelwood in a native dry tropical
1
afro-montane forest of Ethiopia
2
3
Key message: Biomass equations are presented for five tree species growing in a natural forest in
4
Ethiopia. Fitted models showed more accurate estimations than published generalized models for this
5
dry tropical forest.
6
This is a pre-copyedited, author-produced document of an article published in 2016 in
7
Annals of Forest Science following peer review. The final publication: Volume 73 Number
8
2
is available at Springer via:
http://link.springer.com/article/10.1007%2Fs13595-015-9
0533-2#/page-1
10
11
12
Abstract
13
Context: Biomass equations are needed to correctly quantify harvestable stock and biomass for
14
sustainability efforts in forest management, but this kind of information is scarce in Ethiopia.
15
Aims: This study sought to develop biomass models for five of the most common native tree species
16
in the Chilimo dry afro-montane mixed forest in the central highlands of Ethiopia: Allophyllus
17
abyssinicus, Olea europaea ssp.cuspidata, Olinia rochetiana, Rhus glutinosa and Scolopia theifolia.
18
Comparison with generalized models was intended to show the greater accuracy of the specific
19
models.
20
Methods: A total of 90 trees from different diameter classeswere selected, felled and divided into
21
different biomass compartments. Biomass equation models were fitted using joint-generalized least
22
squares regression to ensure the additivity property between the biomass compartments and total
23
2
Results: These were the first models developed for these species in African tropical forests. Models
25
were including diameter at breast height and total height as independent variables, obtaining more
26
accurate biomass estimations using these models than from generalized models.
27
Conclusion: Fitted models are reliable for estimating aboveground biomass in the Chilimo forest and
28
for more general application in similar forest types. Model applicability for biomass or carbon
29
estimation is high within forest inventory data contexts.
30
31
32
Key words: Chilimo forest, tropical forest, biomass models, fuelwood, carbon stock.
33
34
35
1. Introduction
36
37
Forests play an important role in mitigating global climate change. Forests cover over 4·109 hectares of
38
the earth’s surface (IPCC 2007), with an estimated carbon (C) stock of 363 Pg C in living biomass
39
(Pan et al. 2011). Tropical forests are especially important; they account for about 60% of global forest
40
cover and store from 229 Pg C (Baccini et al. 2012) to 263 Pg C (Pan et al. 2011) in aboveground
41
biomass, roughly 20 times the annual emissions from combustion and changes in land use
42
(Friedlingstein et al. 2010). Intact tropical forests contributed 1.2 Pg C ha-1 to the global carbon sink,
43
which represents half the contribution of all established world forests (Pan et al. 2011). Tropical dry
44
forests represent around 42% of all tropical forest ecosystems (Miles et al. 2006) and possess great
45
potential for carbon sequestration, especially through protection, conservation and forest management
46
in light of the high existing degradation and deforestation rates.
47
Biomass and carbon stock estimates for tropical forest species enhance our understanding of
48
the importance of tropical forests in the global carbon cycle and how to manage these forests for
49
3
energy consumption comes from forest biomass (Sims 2003); in Ethiopia, biomass supplies 93% of
51
total household energy consumption (Shiferaw et al. 2010). To successfully implement mitigating
52
policies and take advantage of the REDD+ (Reducing Emissions from Deforestation and Forest
53
Degradation) programme of the United Nations Framework Convention in Climate Change
54
(UNFCCC) (Chaturvedi et al. 2011),these countries need well-authenticated estimates of forest carbon
55
stocks.
56
Consequently, there is an urgent need to quantify tree biomass through direct or indirect
57
methods (Brown 2002). Destructive methods calculate biomass directly by harvesting the tree and
58
measuring the actual mass of each of its compartments (Kangas and Maltamo 2006). Though very
59
accurate (Henry et al. 2011),cutting down trees is both costly and time consuming. Indirect methods
60
using biomass models and biomass expansion factors (BEFs) to estimate tree biomass are time
61
efficient (Peltier et al. 2007). However, tools for biomass estimation remain scare in the tropics and
62
existing generalized models do not accurately represent biomass in the actual forests (Henry et al.
63
2011). Most existing models for tropical species were developed in Latin America and Asia. Though
64
great efforts have been made to develop models for several tropical species in recent years, particularly
65
in Africa (e.g., Henry et al. 2011; Fayolle et al. 2013; Mate et al. 2014; Ngomanda et al. 2014),
66
attempts to develop biomass equations for Sub-Saharan Africa have been very limited (Henry et al.
67
2011). To obtain precise and accurate biomass and carbon stock estimates in forests, different models
68
must be developed for different species and forest types. Most of the recent biomass models in Africa
69
have been developed for wet or moist forests (e.g., Djomo et al. 2010; Fayolle et al. 2013; Ngomanda
70
et al. 2014), leaving dry forests poorly studied. The 2011 review of Henry et al. reported biomass
71
equations for only six forest species in Ethiopia.
72
Biomass partitioning is an important factor in quantifying exploitable dendromass (for timber
73
yield or firewood). Data that accurately reflects biomass amounts and distribution between
74
compartments for different species in tropical forests can aid in the application of sustainable forest
75
4
Deforestation has reduced Ethiopia’s forest cover in the last century. Forest policies aimed at
77
stopping this process are being implemented, due to the important ecosystem services that the forest
78
provides (timber, firewood, soil erosion reduction, carbon sink…). Carbon stock estimates in Ethiopia
79
range from 153 Tg C (Houghton, 1999) to 867 Tg C (Gibbs et al. 2007). Estimates of mean
80
aboveground biomass carbon stock density vary from 26 Mg C ha-1 (Brown 1997) to 18 Mg C ha-1
81
(FAO 2010) depending on the methodology and tools used. Mean values as high as 278 Mg C ha-1 and
82
414 Mg C ha-1 have been found in dense forests such as the Egdu Forest (Feyissa et al. 2013) and the
83
Arba Minch Ground Water Forest (Wolde et al. 2014), respectively. Localized carbon stocking
84
capacity studies are urgently needed to aid sustainable management of the existing forest (IBC 2005).
85
Located in the central highland plateau of Ethiopia, the Chilimo-Gaji forest is one of the few
86
remaining dry afro-montane mixed forests, composed of broad-leaf and predominantly coniferous
87
species (Kassa et al. 2009). The forest represents a vital ecological space for birds, mammal species
88
and water supply. It is the source of several large rivers, including the Awash River. However, the
89
Chilimo-Gaji forest has been subjected to human impact for over 2,000 years. The current rate of
90
deforestation is extremely high due to clearing for fuelwood, agricultural land expansion, lumber and
91
farming. Chilimo forest cover has shrunk from 22,000 ha in 1982 to its present-day size of 6,000 ha
92
(Dugo 2009; Teshome and Ensermu 2013). In order to preserve this area and the important
93
environmental services it provides, the Ethiopian government has moved to protect this woodland by
94
proclaiming it a National Forest Priority Area. Although some species were protected by law, other
95
species are under increased pressure from the local human population in search of wood for fuel,
96
construction, farm implements and charcoal (Teshome and Ensermu 2013).
97
Given the lack of aboveground biomass estimates for most Ethiopian species (see the review
98
of Henry et al. 2011), the main objective of this study was to develop biomass and carbon stock
99
estimation models for use in sustainable biomass harvesting practices and carbon stock estimation for
100
five of the most common native broadleaf species in a dry tropical afro-montane forest: Allophyllus
101
abyssinicus (Hochst.) Radlk. Olea europaea L. ssp. cuspidata (Wall. ex G. Don) Cif, Olinia
5
rochetiana A. Juss, Rhus glutinosa Hochst. ex A. Rich. and Scolopia theifolia Gilg. Although the
103
coniferous Juniperus procera Hochst. ex Endl. and the broadleaf Podocarpus falcatus (Thunb.) R.Br.
104
ex Mirb. are the most abundant and dominant tree species in this forest, cutting them down is
105
prohibited by law and it was therefore not possible to develop biomass-based equations for these
106
endangered species.
107
108
2. Materials and methods
109
2.1. Study site location
110
The experimental site was located in the Chilimo-Gaji dry afro-montane forest of the Western Shewa
111
zone, in the Dendi district of the central highlands of Ethiopia (38° 07′ E to 38° 11′ E longitude and 9°
112
03′ to 9° 06′ N latitude), at an altitude of 2,170–3,054 m above sea level (Figure 1). The mean annual
113
temperature ranges between 15ºC and 20ºC and average annual precipitation is 1,264 mm (Dugo 2009)
114
with a bimodal rainfall distribution of lower precipitation from November to January and a higher
115
rainy season from May to September. Köppen’s typology classifies the Chilimo-Gaji forest as a
116
temperate highland climate with dry winters (Cwb, Subtropical highland variety) (EMA 1988). The
117
main rock type in the area is basalt and some areas are covered with other volcanic rocks of more
118
recent formation.
119
120
2.2. Exploration and pilot study
121
This study included a stratification of the Chilimo-Gaji forest based on dominant species composition,
122
representativeness and accessibility. Due to the lack of data, a pilot survey was taken prior to biomass
123
data collection in order to compile information about species composition, diameter distribution and
124
general forest conditions. A total of thirty-five 20 × 20 m square sample plots were established (Figure
125
1) between the altitudes of 2,470 and 2,900 m, based on the Neyman optimal allocation formula (Köhl
126
et al. 2006). Thirty-three different native species (22 tree and 11 shrub species) were recorded in the
127
6
and the most abundant species were J. procera and P. falcatus (136±28 and 116±24 tree ha-1
129
respectively; 42% of N and 50% of G). The five next most abundant species accounted for one third of
130
the total tree population in terms of mean density and 27% of total basal area: A. abyssinicus 36.4±11.1
131
tree ha-1 (6% of total N) and 0.8±0.3 m2 ha-1 (3% of total G); O. europaea 54.3±13.0 tree ha-1 (9% of
132
N) and 3.0±0.7 m2 ha-1 (12% of G); O. rochetiana 59±16 tree ha-1 (10% of N) and 2.1±0.6 m2 ha-1 (8%
133
of G); R. glutinosa 16±5 tree ha-1 (3% of N) and 0.5+0.2 m2 ha-1 (2% of G) and S. theifolia 34±11 tree
134
ha-1 (6% of G) and 0.4±+0.2 m2 ha-1 (2% of G).
135
136
2.3. Data
137
2.3.1. Data collection
138
The five most abundant and dominant broadleaf tree species in the natural forest (after the endangered
139
and protected coniferous species J. procera and P. falcatus) were selected for developing aboveground
140
biomass-based equations for sustainable fuelwood production: A. abyssinicus, O. europaea, O.
141
rochetiana, R. glutinosa and S. theifolia.
142
Trees of each species were randomly selected along a forest transect, based on diameter
143
classes at 5-cm intervals that had been obtained from the pilot inventory data. The trees were
144
dendrometrically representative of the population, with typical shape and development for each species
145
studied. A total of 20 trees were felled for each of the most abundant species, in which it was possible
146
to complete a suitable diameter range (O. europaea, O. rochetiana and R. glutinosa), while 15 trees
147
were for each of the other species (A. abyssinicus and S. theifolia) (Table 1). Prior to felling, diameter
148
at breast height (dbh at 1.30 m), stump diameter (db), crown diameter (cd) and crown length (cl) were
149
measured for each tree. After the trees were cut down, diameter at each meter interval, total height (h),
150
commercial height (hc) (height up to a stem diameter of 7 cm) and height at branching stems (hb) were
151
measured. Several biomass compartments were considered: stem with bark, thick branches (diameter
152
greater than 2 cm) and thin branches (diameter less than 2 cm) with leaves. Trees were felled and
153
7
(calculated through Smalian’s formula in logs 2 m length) and wood density (Picard et al. 2012),
155
because it was not possible to weigh heavier logs. Although this indirect method might overestimate
156
stem biomass (Moundounga Mavouroulou et al., 2014) the short length of the logs would minimise
157
this tendency. Fresh weights of each compartment were recorded in the field and then samples were
158
taken to the laboratory and oven dried at 102 ºC until constant weight was reached. The main
159
dendrometric variables for the sampled trees are listed by species in Table 1. Sampling of larger trees
160
was not possible due to the prohibition on felling trees in this natural forest (this research was an
161
exceptional case agreed upon with the local forest user groups) and the fact that trees with diameter
162
greater than 30 cm were not abundant in the forest.
163
164
2.3.2. Data analysis
165
A correlation analysis between the biomass dry weight of the different compartments and the biometric
166
tree measurements was carried out using the Spearman method. To fit the biomass models, different
167
linear and non-linear equations (Table 2) with additive error term were evaluated for each dry biomass
168
weight compartment. The best one was selected based on the statistics calculated for each equation:
169
bias (MRES), root mean square error (RMSE), adjusted coefficient of determination (R2adj)
(Pérez-170
Cruzado and Rodríguez-Soalleiro 2011), and a graphical analysis of the biological behavior of the
171
models and the residuals. The selected models were then simultaneously fitted using joint-generalized
172
least squares regression (also known as seemingly unrelated regression-SUR), where cross-equation
173
error correlation was taken into consideration to ensure the additivity property between biomass
174
compartments and total aboveground biomass (Parresol 1999; 2001; Balboa-Murias et al. 2006;
Pérez-175
Cruzado and Rodríguez-Soalleiro 2011; Ruiz-Peinado et al. 2011, 2012). Weighted regression was
176
used to avoid heteroscedasticity: each observation was weighted by the inverse of its variance to
177
homogenize the variance of residuals. Models were fitted using the MODEL procedure included in
178
8
In order to determine how biomass is partitioned between compartments for the species
180
studied, models were applied to the mean value of each diameter class and the mean height for each
181
class (calculated in a dbh-height relationship using field data).
182
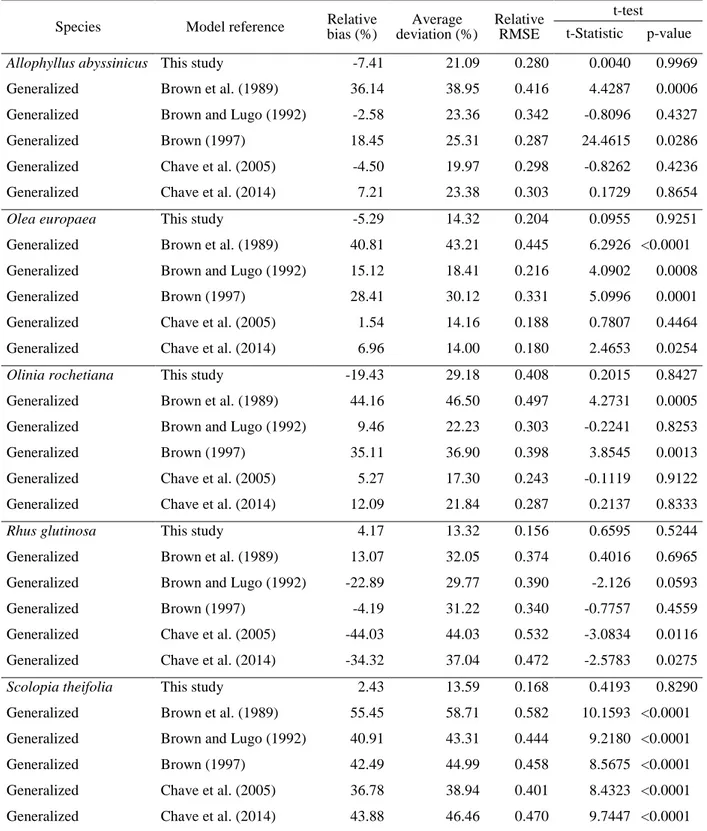
To compare the predictive accuracy of the main general equations developed for tropical dry
183
forests (Brown et al. 1989; Brown 1997; Brown and Lugo 1992; Chave et al. 2005; Chave et al. 2014),
184
the Ethiopian site-specific fitted models were evaluated using relative bias (RB) [equation 1], average
185
deviation (S) [equation 2], relative root mean square error (rRMSE) [equation 3] and a paired t-test for
186
estimation values.
187
𝑅𝑅𝑅𝑅=∑ �
𝑌𝑌𝑖𝑖−𝑌𝑌𝚤𝚤� 𝑌𝑌𝑖𝑖 � 𝑛𝑛 𝑖𝑖=1
𝑛𝑛 [1]
188
𝑆𝑆(%) = 100∙ �∑ �
�𝑌𝑌𝑖𝑖−𝑌𝑌𝚤𝚤�� 𝑌𝑌𝑖𝑖 � 𝑛𝑛 𝑖𝑖=1
𝑛𝑛 � [2]
189
𝑟𝑟𝑅𝑅𝑟𝑟𝑆𝑆𝑟𝑟= �𝑛𝑛1∑ �𝑌𝑌𝑖𝑖−𝑌𝑌�𝚤𝚤
𝑌𝑌𝑖𝑖 �
2 𝑛𝑛
𝑖𝑖=1 [3]
190
where 𝑌𝑌𝑖𝑖 is the observed value, 𝑌𝑌�𝚤𝚤 is the predicted value and n is the number of observations
.
191
192
3. Results
193
3.1. Correlation of dendrometric variables to biomass compartments
194
The aboveground, stem and thin branches plus foliage dry weight biomass compartments for all five
195
species were strongly correlated to dbh and stump diameter (Table 3). Similarly, most biomass
196
compartments were also correlated to total height and commercial height. However, the thick branches
197
compartment of A. abyssinicus and R. glutinosa were non-correlated to dbh and stump diameter and
198
most biomass fractions were not significantly correlated to tree branching height, crown length or
199
crown diameter. Spearman’s correlation results indicated that biomass models could use dbh and total
200
height as independent variables.
201
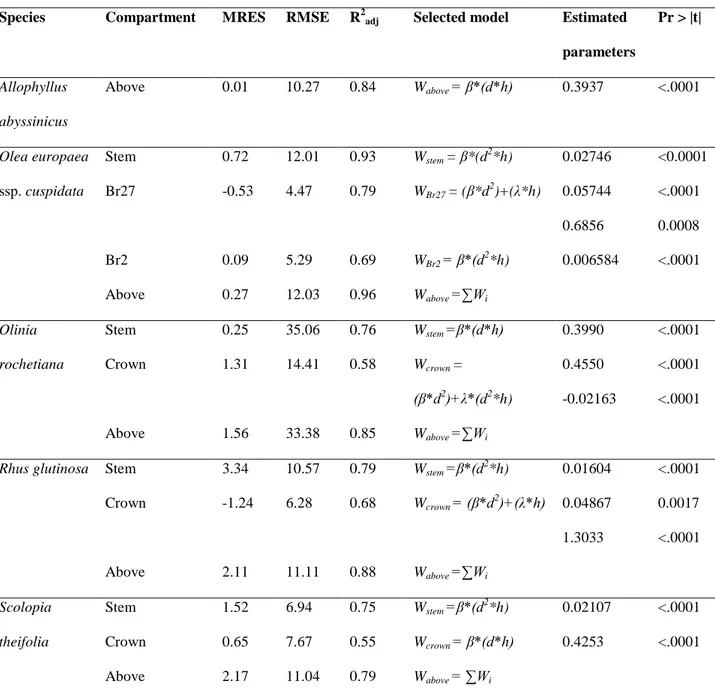
9 3.2. Fitted models
203
Based on goodness-of-fit statistics and biological behaviour, models 1, 2, 5 and 7 (Table 4) were
204
selected for different compartments and species. Due to fitting problems, biomass for the different
205
branches compartments were combined into a crown fraction for O. rochetiana, R. glutinosa and S.
206
theifolia and one model was fitted for this component. Similarly, the model that treated all
207
compartments together as aboveground biomass provided the best fit for A. abyssinicus. The calculated
208
model parameters were statistically significant at the 99% confidence level (p<0.001) (Table 4). All
209
fitted models for stem biomass showed R2-Adj values higher than 0.75. Due to high variability, branch
210
or crown models presented lower values, ranging from 0.79 for the thick branches compartment in O.
211
europaea to 0.55 for crown biomass in S.theifolia. Aboveground biomass models fitted with SUR
212
(except for A. abyssinicus) showed high R2-Adj values ranging from 0.96 for O. europaea to 0.79 for
213
S. theifolia.
214
The selected models were also tested for accuracy based on observed and predicted data.
215
Figure 2 shows how observed and predicted aboveground biomass values are close to the 1:1 line and
216
the simultaneous F-test provided no evidence for rejecting the null hypothesis (intercept = 0 and slope
217
= 1). Thus, bias was not revealed in the fitted models, though model efficiency varied among the
218
species (Table 4).
219
220
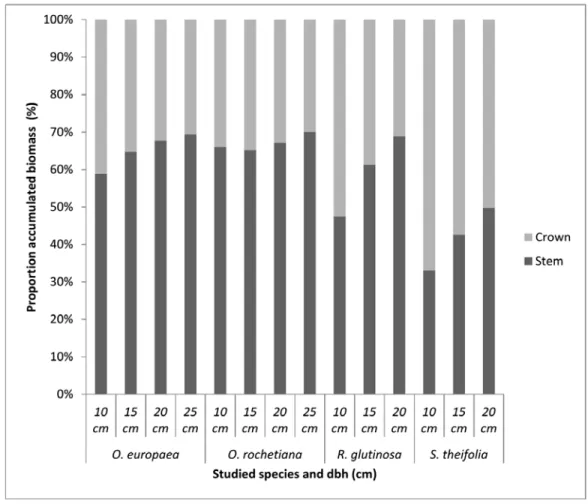
3.3. Biomass partitioning
221
Aboveground biomass partitioning of O. europaea, O. rochetiana, R. glutinosa and S. theifolia into
222
stem and crown biomass compartments is summarized in Figure 3. The biomass proportions were
223
estimated by applying the fitted models to the sample diameter classes and the corresponding
224
estimated total height. O. europaea and O. rochetiana exhibited similar biomass allocation: the stem
225
compartment accumulated more biomass than the crown fraction (~60-70%) in all diameter classes. R.
226
glutinosa crown fraction accumulated more biomass (53%) than stem compartment (47%) in the 10 cm
227
10
20 cm diameter classes (61% and 69%, respectively). The S. theifolia crown fraction was always
229
greater than the stem fraction for all sampled diameter classes.
230
231
232
4. Discussion
233
The biomass models for these tropical dry forest species are valuable tools for policy-makers and
234
stakeholders, mainly in assisting forest managers in the necessary estimation of fuelwood or carbon
235
stocks for sustainable management. The models developed in this study included dbh and total height
236
as independent variables in all the biomass compartments (Table 4). Goodman et al. (2014) showed the
237
importance of include crown variables to improve tropical biomass estimations. Nevertheless,
238
correlations of crown variables with biomass were not high (Table 3) (with some exceptions) perhaps
239
due to the lack of large trees in our dataset. Although commercial height showed a high correlation
240
with biomass weight, accurate measurement of this variable in the field is very difficult (Segura and
241
Kanninen 2005). For this reason, total height was selected as independent variable, together with dbh.
242
Combining these independent variables provided better fit results and estimation values than the use of
243
dbh alone, as several authors have advocated (e.g., Henry et al. 2011; Feldpausch et al. 2012). Total
244
height could include information about competition or fertility of the site and may yield less biased
245
estimates. Though accurate measurement of total height may be challenging, Chave et al. (2005)
246
observed a standard error reduction from 19.5 % when total height was not available to 12.5% when
247
total height was available, across all tropical forests types. The independent variables of the models
248
developed here can be easily measured in the field or are commonly recorded in forest inventories,
249
facilitating practical, timely and virtually effortless application of these and similar models (Ketterings
250
et al. 2001).
251
Equations were developed for each biomass compartment according to species (Table 4).
252
Models were developed for all biomass compartments of O. europaea, but only an aboveground
253
11
biomass weight of this species. For the other studied species (O. rochetiana, S. theifolia and R.
255
glutinosa), stem and crown biomass compartment models were developed. Combining thick branches
256
and thin branches with leaves into a crown biomass compartment resulted in better fitting efficiency
257
and accuracy than individual models for each compartment. The lower prediction potential of the
258
branch and foliage biomass models over the stem model has been confirmed in other studies (e.g.,
259
Návar 2009; Ruiz-Peinado et al. 2011; Negash et al. 2013). Cole and Ewel (2006) argue that weather,
260
herbivores and inter-plant competition can affect the crown biomass compartment. In mixed forests,
261
inter-specific competition due to the competition process itself or to facilitation could strongly
262
influence crown geometry (Menalled et al. 1998; Dieler and Pretzsch, 2013), resulting in high crown
263
biomass heterogeneity. Moreover, although Chilimo-Gaji is a protected forest, pressure from local
264
people pruning trees for firewood might also modify crown growth and biomass weight (Smektala et
265
al. (2002), cited in Henry et al. (2010)).
266
All the estimator parameters for the biomass models showed positive coefficient values for all
267
species and biomass compartments, except one parameter for crown biomass in O. rochetiana
268
involving the combination of square diameter and total height (d2h) as an independent variable. This
269
may indicate that taller trees allocate less biomass to the crown due to light competition processes for
270
this species (the same tendency was found in Pinus sylvestris L. by Vanninen and Mäkelä 2000).
271
Although some authors have proposed the use of existing generalized equations to estimate
272
aboveground biomass in African tropical forests (e.g., Brown et al. 1989; Brown and Lugo 1992;
273
Chave et al. 2005), others report that generalized models are unsuitable for African tropical forests
274
(e.g., Henry et al. 2010; Ngomanda et al. 2014). So, the use of species-specific and site-specific
275
equations are encouraged (Cairns et al. 2003; Henry et al. 2011). Such equations reflect the great
276
variability in tree architecture and wood gravity among and within species (Henry et al. 2011; Litton
277
and Kauffman 2008), making it possible to more accurately quantify harvestable biomass for fuelwood
278
and other purposes. Comparison of generalized models (Brown et al. 1989; Brown 1997; Brown and
279
12
showed that accuracy varied according to species. All generalized models tested showed a high bias
281
and that rendered them inappropriate for biomass estimation of S. theifolia (p-value<0.0001).
282
Similarly, Brown et al. (1989) and Brown (1997) models were unsuitable for four of the species
283
studied (p-value>0.05 on the t-test only for R. glutinosa) having high average deviation values. Brown
284
et al. (1989) model has already been describe as unsuitable for tropical African species by Vieilledent
285
et al. (2012) for a dry forest and Ngomanda et al. (2014) for a moist forest. Brown and Lugo (1992)
286
model was applicable for three species (A. abyssinicus, O. rochetiana and R. glutinosa), but showed
287
poor statistics for the latter species. Chave et al. (2005)model proved unsatisfactory for two of the
288
species studied (R. glutinosa and S. theifolia), but showed acceptable statistics for the other three
289
species. This model was described as accurate for tropical species by Djomo et al. (2010) and Fayolle
290
et al. (2013) in African moist forests and Vieilledent et al. (2012) in an African dry forest. Finally,
291
Chave et al. (2014) model was unexpectedly unsuitable for the same two species as the 2005 model (R.
292
glutinosa and S. theifolia) and also for O. europaea, although this model was developed with an ample
293
dataset including trees in larger diameter ranges from tropical areas in America and Asia, including a
294
new dataset of trees collected in Africa. In light of these results and the high species heterogeneity in
295
tropical dry forests, the generalized models should be used judiciously and with full awareness of the
296
potential for error in the estimations (Table 5).
297
In recent years, several site-specific models have been developed for tropical species in
298
general. Although the number of site-specific models for sub-Saharan species in particular have been
299
increasing in last years (e.g, review by Henry et al. 2011; Mugasha et al. 2013; Mate et al. 2014), if
300
possible, more site-specific models should be developed in order to obtain non-biased biomass
301
(fuelwood or timber) or carbon estimates for REDD+ projects. So, estimations of carbon sequestration
302
potential for Ethiopian afro-montane forests (Mokria et al. 2015) could improve accuracy using the
303
developed biomass models.
304
Stem biomass proportions in O. europaea (58% in the 10 cm and 68% in the 25 cm diameter
305
13
increments across the sampled diameter classes (Figure 3). For R. glutinosa (47% in the 10 cm and
307
69% in the 20 cm diameter class) and S. theifolia (33% in the 10 cm and 49% in the 20 cm diameter
308
class), the stem compartment exhibited rapid growth along diameter. The crown biomass fraction of S.
309
theifolia was generally greater than the stem compartment in the sampled trees. This might be due to
310
the large, umbrella-shaped crown of this species, which tends to result in a greater proportion of
311
biomass in the branches than in the stem. Tropical species vary greatly in leaf morphology and crown
312
structure, leading to differences in biomass allocation among species (Poorter et al. 2006). Our
313
findings for biomass partitioning align with results of Mate et al. (2014)for three tropical species (of
314
greater diameter than those sampled in this study): mean biomass partitioning values ranged between
315
46% and 77% for stems and from 23% to 54% for crowns. Henry et al. (2010) alsoreported mean
316
figures indicating higher biomass accumulation in the stem (69%) than in the crown compartment
317
(28%) for 16 tropical rainforest species in Africa. Likewise, these authors found that stem biomass
318
proportion tended to decrease and crown biomass proportion increase with increasing tree size (from
319
trees with diameter larger than 20 cm to 100 cm). The latter was not corroborated for the species we
320
examined, where the stem percentage is increased with tree size for the sampled diameter range (up to
321
the maximum sampled dbh which ranged between 21 and 29 cm according to the species).
322
323
5. Conclusion
324
Models developed in this study for five of the most important species of an Ethiopian dry mixed forest
325
are using tree diameter and total height as independent variables to estimate biomass for different tree
326
compartments. Crown biomass models were fitted for three of the five species studied (O. rochetiana,
327
R. glutinosa and S. theifolia) due to high variability in branch biomass compartments resulting from
328
inter-specific competition in the mixed tropical forest. Similarly, an aboveground model was
329
developed for A. abyssinicus based on its biomass heterogeneity and small crown biomass weight.
330
These models were developed for trees in a fairly small diameter range (maximum sampled dbh: 28.8
331
14
The application of generalized models for estimating aboveground biomass produced biased
333
results for some of the species studied. Given the great diversity of species and variability within
334
species that characterize tropical forests, the development of species-specific models is suggested to
335
improve biomass estimation accuracy and reduce uncertainty. The equations developed in this study
336
can be used for estimating forest carbon stocks, identifying carbon sink capacity, establishing carbon
337
trade value and informing management policies related to sustainability and fuelwood harvesting for
338
these species.
339
The biomass models developed here and information about biomass distribution patterns for these
340
species could help in sustainable management of fuelwood harvesting. Sustainable fuelwood
341
harvesting might help to develop local fuelwood markets having an important, positive
socio-342
economic and ecological impact. Moreover, this might lead to a deforestation reduction and avoiding
343
degradation due to firewood collector preferences for deadwood, combined with identification of low
344
competition sites and recognized access rights (Hiemstra-van der Horst and Hovorka 2009).
345
346
References
347
348
Baccini A, Goetz SJ, Walker WS, Laporte NT, Sun M, Sulla-Menashe D, Hackler J, Beck PSA,
349
Dubayah R, Friedl MA, Samata S, Houghton RA (2012) Estimated carbon dioxide emissions
350
from tropical deforestation improved by carbon-density maps. Nat Clim Chang 2:182-185. doi:
351
10.1038/nclimate1354
352
Balboa-Murias MA, Rodriguez-Soalleiro R, Merino A, Álvarez-González JG (2006) Temporal
353
variation and distribution of carbon stocks in aboveground biomass of radiate pine and maritime
354
pine pure stands under different silvicultural alternatives. For Ecol Manage 237:29-38. doi:
355
10.1016/j.foreco.2006.09.024
356
Brown S, Gillapse AJR, Lugo AE (1989) Biomass estimation methods for tropical forests with
357
15
Brown S, Lugo AE (1992) Aboveground biomass estimates for tropical moist forests of the Brazilian
359
Amazon. Interciencia 17:8-18
360
Brown S (1997) Estimating biomass and biomass changes of Tropical Forests. FAO Forestry Paper
361
134, Rome
362
Brown S (2002) Measuring carbon in forest, current status and future challenges. Environ Pollut
363
116:363-372. doi: 10.1016/S0269-7491(01)00212-3
364
Cairns MA, Olmsted I, Granados J, Argaez J (2003) Composition and aboveground tree biomass of a
365
dry semi-evergreen forest on Mexico's Yucatan Peninsula. For Ecol Manage 186:125-132.
366
doi:10.1016/S0378-1127(03)00229-9
367
Chaturvedi RK, Ranhubanshi AG, Singh IS (2011) Carbon density and accumulation in woody species
368
of tropical dry forest in India. Forest Ecol Manage 262:1576-1588. doi:
369
10.1016/j.foreco.2011.07.006
370
Chave J, Andalo C, Brown S, Cairns MA, Chambers JQ, Eamus D, Fölster R, Fromard F, Higuchi N,
371
Kira T, Lescure JP, Nelson BW, Ogawa H, Puig H, Riėra B, Yamakura T (2005) Tree allometry
372
and improved estimation of carbon stocks and balance in tropical forests. Oecologia 145:87-99.
373
doi: 10.1007/s00442-005-0100-x
374
Chave J, Réjou-Méchain M, Búrquez A, Chidumayo E, Colgan MS, Delitti WBC, Duque A, Eid T,
375
Fearnside PM, Goodman RC, Henry M, Martínez-Yrízar A, Mugasha WA, Muller-Landau HC,
376
Mencuccini M, Nelson BW, Ngomanda A, Nogueira EM, Ortiz-Malavassi E, Pélissier R, Ploton
377
P, Ryan CM, Saldarriaga JG, Vieilledent G (2014) Improved allometric models to estimate the
378
aboveground biomass of tropical trees. Glob Change Biol 20:3177-3190. doi:10.1111/gcb.12629
379
Cole TG, Ewel JJ (2006) Allometric equations for four valuable tropical tree species. For Ecol Manage
380
229:351-360. doi: 10.1016/j.foreco.2006.04.017
381
Dieler J, Pretzsch H (2013) Morphological plasticity of European beech (Fagus sylvatica L.) in pure
382
16
Djomo AN, Ibrahima A, Saborowski J, Gravenhorst G (2010) Allometric equations for biomass
384
estimations in Cameroon and pan moist tropical equations including biomass data from Africa.
385
For Ecol Manage 260:1873-1885. doi: 10.1016/j.foreco.2010.08.034
386
Dugo SG (2009) The structure and regeneration status of tree and shrub species of Chilimo forest.
387
Ecological sustainability indicators for participatory forest management in Oromia, Ethiopia.
388
Dissertation, University of Dresden
389
EMA (1988) National Atlas of Ethiopia. Ethiopian Mapping Authority, Addis Ababa, Ethiopia
390
FAO (2010) Global forest resources assessment 2010, Main report, FAO forestry paper 163, Rome
391
Fayolle A, Doucet JL, Gillet JF, Bourland N, Lejeune P (2013) Tree allometry in central Africa:
392
Testing the validation of pantropical multi-species allometric equations for estimation biomass
393
and carbon stock.For Ecol Manage 304: 29-37. doi: 10.1016/j.foreco.2013.05.036
394
Feldpausch TR, Lloyd J, Lewis SL, Brienen RJW, Gloor M, Monteagudo Mendoza A,
Lopez-395
Gonzalez G, Banin L, Abu Salim K, Affum-Baffoe K, Alexiades M, Almeida S, Amaral I,
396
Andrade A, Aragão LEOC, Araujo Murakami A, Arets EJMM, Arroyo L, Aymard GA, Baker
397
TR, Bánki OS, Berry NJ, Cardozo N, Chave J, Comiskey JA, Alvarez E, de Oliveira A, Di Fiore
398
A, Djagbletey G, Domingues TF, Erwin TL, Fearnside PM, França MB, Freitas MA, Higuchi N,
399
Honorio E, Iida Y, Jiménez E, Kassim AR, Killeen TJ, Laurance WF, Lovett JC, Malhi Y,
400
Marimon BS, Marimon-Junior BH, Lenza E, Marshall AR, Mendoza C, Metcalfe DJ, Mitchard
401
ETA, Neill DA, Nelson BW, Nilus R, Nogueira EM, Parada A, Peh KS-H, Pena Cruz A, Peñuela
402
MC, Pitman NCA, Prieto A, Quesada CA, Ramírez F, Ramírez-Angulo H, Reitsma JM, Rudas A,
403
Saiz G, Salomão RP, Schwarz M, Silva N, Silva-Espejo JE, Silveira M, Sonké B, Stropp J,
404
Taedoumg HE, Tan S, ter Steege H, Terborgh J, Torello-Raventos M, van der Heijden GMF,
405
Vásquez R, Vilanova E, Vos VA, White L, Willcock S, Woell H, Phillips OL (2012) Tree height
406
integrated into pantropical forest biomass estimates. Biogeosciences 9:3381-3403. doi:
407
17
Feyissa A, Soromessa T, Argaw M (2013) Forest carbon stocks and variations along altitudinal
409
gradients in Egdu Forest: Implications of managing forest for climate change mitigation. Sci
410
Technol Arts Res J 2:40-46. doi:10.4314/star.v2i4.8
411
Friedlingstein P, Houghton RA, Marland G, Hackler J, Boden TA, Conway TJ, Canadell JG, Raupach
412
MR, Ciais P, Le Quéré C (2010) Uptake on CO2 emissions. Nat Geosci 3:811-812. doi:
413
10.1038/ngeo1022
414
Gibbs HK, Brown S, Niles JO, Foley JA (2007) Monitoring and estimating tropical forest carbon
415
stocks: making REDD a reality. Environ Res Lett 2:045023. doi: 10.1088/1748-9326/2/4/045023
416
Goodman RC, Phillips OL, Baker TR (2014) The importance of crown dimensions to improve tropical
417
tree biomass estimates. Ecol Appl 24 (4):680-698. doi:10.1890/13-0070.1
418
Henry M, Besnard A, Asante WA, Eshun J, Adu-Bredu S, Valentini R, Bernoux M, Saint-André L
419
(2010) Wood density, phytomass variations within and among trees and allometric equations in a
420
tropical rainforest of Africa. For Ecol Manage 260:1375-1388. doi: 10.1016/j.foreco.2010.07.040
421
Henry M, Picard N, Trotta C, Manlay RJ, Valentini R, Bernoux M, Saint-André L (2011) Estimating
422
tree biomass of Sub-Saharan African forests: A review of available allometric equations. Silva
423
Fenn 45(3B):477-569. doi:10.14214/sf.38
424
Hiemstra-van der Horst G, Hovorka AJ (2009) Fuelwood: The 'other' renewable energy source for
425
Africa? Biomass Bioenerg 33:1605-1616. doi: 10.1016/j.biombioe.2009.08.007
426
Houghton RA (1999) The annual net flux of carbon to the atmosphere from changes in land use
1850-427
1990. Tellus B 51:298-313. doi: 10.1034/j.1600-0889.1999.00013.x
428
IBC (2005) National biodiversity strategy and action plan. Institute of Biodiversity Conservation,
429
Addis Ababa
430
IPCC (2007) Climate change 2007: mitigation of climate change. In: Metz B, Davidson OR, Bosch
431
PR, Dave R, Meyer LA (eds) Contribution of working group III to the fourth assessment report of
432
the intergovernmental panel on climate change. Cambridge University Press, Cambridge
433
18
Kassa H, Campbell B, Sandwell M, Kebede M, Tesfaye Y, Dessie G, Seifu A, Tadesse M, Garedewe
435
E, Sandewall K (2009) Building future sceneries and uncovering persisting challenges of
436
participatory forest management in Chilimo forest, Central Ethiopia.J Environ Manage
90:1004-437
1013. doi: 10.1016/j.jenvman.2008.03.009
438
Ketterings QM, Coe R, VanNoordwijk V, Ambagau Y, Palm CA (2001) Reducing uncertainty in the
439
use of allometric biomass equations for predicting above-ground tree biomass in mixed secondary
440
forests. For Ecol Manage 146:199-209. doi: 10.1016/S0378-1127(00)00460-6
441
Köhl M, Magnussen SS, Marchetti M (2006) Sampling methods, remote sensing and GIS multi
442
resource forest inventory. Springer-Verlag, Berlin Heidelberg
443
Litton CM, Kauffman JB (2008) Allometric models for predicting aboveground biomass in two
444
widespread wood plants in Hawaii. Biotropica 40: 313-320. doi:
10.1111/j.1744-445
7429.2007.00383.x
446
Mate R, Johansson T, Sitoe A (2014) Biomass equations for tropical forest tree species in
447
Mozambique. Forests 5:535-556. doi: 10.3390/f5030535
448
Menalled FD, Kelty MJ, Ewel JJ (1998) Canopy development in tropical tree plantations: a
449
comparison of species mixtures and monocultures. For Ecol Manage 104:249-263. doi:
450
10.1016/S0378-1127(97)00255-7
451
Miles L, Newton AC, De Fries RS, Ravilious C, May I, Blyth S, Kapos V, Gordon JE (2006) A global
452
overview of the conservation status of tropical dry forests. J Biogeogr 33:491–505. doi:
453
10.1111/j.1365-2699.2005.01424.x
454
Mokria M, Gebrekirstos A, Aynekulu E, Bräuning A (2015) Tree dieback affects climate change
455
mitigation potential of a dry afromontane forest in northern Ethiopia. For Ecol Manage
344:73-456
83. doi:10.1016/j.foreco.2015.02.008
457
Moundounga Mavouroulou Q, Ngomanda A, Engone Obiang NL, Lebamba J, Gomat H, Mankou GS,
458
Loumeto J, Midoko Iponga D, Kossi Ditsouga F, Zinga Koumba R, Botsika Bobé KH, Lépengué
459
19
stocks? Some hints from a central African forest. Can J For Res 44:685-691. doi:
10.1139/cjfr-461
2013-0520
462
Mugasha WA, Eid T, Bollandsas OM, Malimbwi RE, Chamshama SAO, Zahabu E, Katani JZ (2013)
463
Allometric models for prediction of above- and belowground biomass of trees in the miombo
464
woodlands of Tanzania. For Ecol Manage 310:87-101. doi:10.1016/j.foreco.2013.08.003
465
Návar J (2009) Allometric equations for tree species and carbon stocks for forests of northwestern
466
Mexico. For Ecol Manage 257:427-434. doi:10.1016/j.foreco.2008.09.028
467
Negash M, Starr M, Kanninen M, Berhe L (2013) Allometric equations for estimating aboveground
468
biomass of Coffea arabica L. grown in the Rift Valley escarpment of Ethiopia. Agroforest Syst
469
87:953-966. doi: 10.1007/s10457-013-9611-3
470
Ngomanda A, Engone-Obiang NL, Lebamba J, Moudounga Mavouroulou Q, Gomat H, Mamkou GS,
471
Loumeto R, Midoko Iponga D, Kossi Ditsouga R, Zinga Koumba R, Botsika Bobé KH, Mikala
472
Okouyi C, Nyangadouma R, Lépengué N, Mbatchi B, Picard N (2014) Site specific versus
473
pantropical allometric equations: which option to estimate the biomass of a moist central Africa
474
forest? For Ecol Manage 312:1-9. doi: 10.1016/j.foreco.2013.10.029
475
Pan Y, Birdsey RA, Fang J, Houghton R, Kauppi PE, Kurz WA, Phillips OL, Shvidenko A, Lewis SL,
476
Canadell JG, Ciais P, Jackson RB, Pacala SW, McGuire AD, Piao S, Rautiainen A, Sitch S,
477
Hayes D (2011) A large and persistent carbon sink in the world's forests. Science 333:988-993.
478
doi: 10.1126/science.1201609
479
Parresol B (1999) Assessing tree and stand biomass: A review with examples and critical comparisons.
480
For Sci 45 (4):573-593
481
Parresol B (2001) Additivity of nonlinear biomass equations. Can J For Res 31:865-878.
482
doi:10.1139/cjfr-31-5-865
483
Peltier R, Njiti CF, Ntoupka M, Manlay R, Henry M, Morillon V (2007) Évaluation du stock de
484
carbone et de la productivité en bois d’un parc à karités du Nord-Cameroun. Bois et forêts des
485
20
Pérez-Cruzado C, Rodríguez-Soalleiro R (2011) Improvement in accuracy of aboveground biomass
487
estimation in Eucalyptus nitens plantations: Effect of bole sampling intensity and explanatory
488
variables. For Ecol Manage 261:2016-2028. doi:10.1016/j.foreco.2011.02.028
489
Picard N, Saint-André L, Henry M (2012) Manual for building tree volume and biomass allometric
490
equations, from field measurement to prediction. FAO, Rome & CIRAD, Montpellier
491
Poorter L, Bongers L, Bongers F (2006) Architecture of 54 moist-forest tree species: traits, trade-offs,
492
and functional groups. Ecology 87:1289-1301. doi:
10.1890/0012-493
9658(2006)87[1289:AOMTST]2.0.CO;2
494
Ruiz-Peinado R, Rio M, Montero G (2011) New models for estimating the carbon sink capacity of
495
Spanish softwood species. Forest Syst 20:176-188. doi: 10.5424/fs/2011201-11643
496
Ruiz-Peinado R, Montero G, Rio M (2012) Biomass models to estimate carbon stocks for hardwood
497
tree species. Forest Syst 21:42-52. doi: 10.5424/fs/2112211-02193
498
SAS INSTITUTE INC (2012) SAS/ETS® 9.2. User’s guide. In: SAS Institute Inc. Carry, NC
499
Segura M, Kanninen M (2005) Allometric models for tree volume and total aboveground biomass in a
500
tropical humid forest in Costa Rica. Biotropica 37: 2-8. doi: 10.1111/j.1744-7429.2005.02027.x
501
Shiferaw A, Jeeranandhan D, Eyerusalem L, Yishak S, Eyerusalem M (2010) Wood charcoal supply to
502
Addis Ababa city and its effect on the environment. Energy Environ 21:1-11. doi:
10.1260/0958-503
305X.21.6.601
504
Sims REH (2003) Bioenergy options for a cleaner environment in developed and developing countries.
505
Elsevier Ltd, Oxford
506
Smektala G, Hautdidier B, Gautier D, Peltier R, Njiemoun A, Tapsou 2002. Construction de tarifs de
507
biomasse pour l’évaluation de la disponibilité ligneuse en zone de savanes au Nord-Cameroun,
508
in: Jamin JY, Seiny Boukar L (Ed.), Savanes africaines: des espaces en mutation, des acteurs face
509
à de nouveaux défis. Actes du colloque, Mai 2002, Maroua, Cameroun. Cited in Henry M,
510
21
Wood density, phytomass variations within and among trees and allometric equations in a
512
tropical rainforest of Africa. For Ecol Manage 260:1375-1388.
513
Teshome S, Ensermu K (2013) Diversity and endemicity of Chilimo forest, central Ethiopia. Biosci
514
Discovery 4:1-4.
515
Vanninen P, Mäkelä A (2000) Needle and stem wood production in Scots pine (Pinus sylvestris) tree
516
of different age, size and competitive status. Tree Physiol 20:527-533. doi:
517
10.1093/treephys/20.8.527
518
Vieilledent G, Vaudry R, Andriamanohisoa SFD, Rakotonarivo OS, Randrianasolo HZ, Razafindrabe
519
HN, Rakotoarivony CB, Ebeling J, Rasamoelina M (2012) A universal approach to estimate
520
biomass and carbon stock in tropical forests using generic allometric models. Ecol Appl
22:572-521
583. doi:10.1890/11-0039.1
522
Wolde BM, Kelbessa E, Soromessa T (2014) Forest carbon stocks in woody plants of Arba Minch
523
Ground Water Forest and its variation along environmental gradients. Sci Technol Arts Res J
524
3:141-147. doi: 10.4314/star.v3i2.18
525
526
22
528
Figure 1 Location map of Chilimo dry afro-montane forest in Ethiopia and pilot survey plots
529
23
531
Figure 2 Observed against predicted aboveground biomass values for the studied species. Dashed line
532
24
534
25
Table 1 Summary of main variables of the sampled trees for the five most dominant species in Chilimo-Gaji forest
536
Studied variables
Allophyllus abyssinicus Olea europaea ssp. cuspidata Olinia rochetiana Rhus glutinosa Scolopia theifolia
Mean SD Minimum Maximum Mean SD Minimum Maximum Mean SD Minimum Maximum Mean SD Minimum Maximum Mean SD Minimum Maximum
dbh (cm) 11.3 3.9 6.4 21.3 14.5 5.9 6.3 28.8 14.9 6.68 6.2 27.5 15.6 4.9 9.0 23.5 11.8 4.1 6.4 22.0 db (cm) 13.9 6.2 0.2 27.3 18.2 6.3 9.9 31.9 17.9 8.36 7.6 34.8 18.8 5.0 12.7 27.5 14.6 4.1 8.0 22.9 h (m) 10.6 3.1 7.0 17.0 10.6 2.1 5.9 14.5 12.6 2.92 7.3 19.4 11.3 3.0 6.0 17.4 8.2 1.9 5.6 13.0 hc (m) 6.7 3.4 0.3 13.5 5.8 2.7 0.5 10.7 8.0 3.58 1.0 14.0 6.3 2.3 1.6 11.4 4.6 2.2 1.9 9.5 hb (m)
4.7 2.6 2.0 12.7 4.0 1.5 1.7 7.0 4.7 1.62 2.0 7.4 4.6 1.9 2.2 9.2 13.7 47.4 1.8 215.0 BS (kg)
32.3 35.6 0.0 130.4 84.2 83.5 4.9 302.9 93.5 97.33 0.0 349.9 65.2 50.4 9.0 168.8 36.3 37.2 5.3 129.3 Br27 (kg)
12.1 4.0 4.3 17.4 19.6 11.5 6.0 46.7 26.9 20.42 7.7 89.2 17.2 7.8 5.6 28.3 23.4 14.8 9.8 72.8 Br2 (kg)
7.7 3.5 1.5 13.2 16.7 12.2 1.4 37.9 19.2 14.05 3.0 48.3 8.8 5.7 2.4 22.5 22.6 14.8 6.3 79.1 Crown (kg)
19.8 6.5 5.8 28.3 36.3 22.7 7.4 84.6 46.1 32.19 11.7 129.8 26.0 12.1 8.1 49.6 46.0 28.2 17.8 151.9 Above (kg)
52.1 38.2 11.6 157.6 120.5 103.7 14.3 366.7 139.5 124.1 13.7 451.9 19.2 58.7 17.2 202.4 82.3 52.3 23.0 281.1 n
15 15 15 15 20 20 20 20 20 20 20 20 15 15 15 15 20 20 20 20
SD: standard deviation;
537
dbh: diameter at breast height (1.30m); db: diameter at base; h: total height; hc: commercial height; hb: branching height; BS: biomass of stem; Br27: biomass of thickbranches (diameter between 2-7cm);
538
Br2: biomass of thin branches (diameter < 2cm) plus foliage; Crown (kg): biomass of branches plus foliage; Above: stem + thick branches (2-7) + thin26
Table 2 Biomass models evaluated for different tree compartments
Model Equation Model Equation
1 W=β*(d*h) 7 W=(β*d2)+(λ*h)
2 W=β*(d2*h) 8 W=(β*d2)+(λ*h)+(θ*d2*h)
3 W=(β*d)+(λ*d2)+(θ*d2*h) 9 W=(β*d2)+λ*(d*h)
4 W=(β*d)+(λ*h) 10 W=β*(d2*h)+ λ *(d*h)
5 W=(β*d2)+λ*(d2*h) 11 W=β*(dλ) *(hθ)
6 W=β*(d2*h) λ 12 W=β*d+ λ*d2
27
Table 3 Spearman correlation coefficients between biomass compartments and dendrometric variables for the studied species
Species Biomass comparments Dendrometric variables
h hc hb dbh db
Allophyllus abyssinicus
Stem 0.72** 0.96*** 0.32 0.85*** 0.82***
Thick branches 0.20 0.02 0.01 0.22 0.25
Thin branches + leaves 0.64* 0.58* 0.38 0.65** 0.64*
Crown 0.48 0.36 0.19 0.54* 0.48
Above 0.86*** 0.93*** 0.24 0.91*** 0.89***
Olea europaea ssp. cuspidata Stem 0.71*** 0.81*** 0.09 0.95*** 0.89*** Thick branches 0.70** 0.86*** 0.08 0.89*** 0.84*** Thin branches + leaves 0.54* 0.76*** -0.11 0.92*** 0.88***
Crown 0.62** 0.84*** -0.02 0.95*** 0.91***
Above 0.68** 0.85*** 0.05 0.96*** 0.93***
Olinia rochetiana Stem 0.84*** 0.87*** 0.36 0.92*** 0.93*** Thick branches 0.69** 0.57** 0.41 0.76** 0.83*** Thin branches + leaves 0.67*** 0.56** 0.29 0.82*** 0.82***
Crown 0.69** 0.57** 0.37 0.83*** 0.87***
Above 0.83*** 0.83*** 0.40 0.94*** 0.95***
Rhus glutinosa Stem 0.49 0.88*** 0.19 0.98*** 0.94***
Thick branches 0.63* 0.36 -0.38 0.41 0.44
Thin branches + leaves 0.61* 0.59* 0.04 0.68* 0.68*
Crown 0.61* 0.52 -0.26 0.68* 0.71**
Above 0.63* 0.83*** 0.10 0.92*** 0.89**
Scolopia theifolia Stem 0.90*** 0.89*** 0.14 0.92*** 0.88*** Thick branches 0.79*** 0.81** 0.02 0.73*** 0.71** Thin branches + leaves 0.49* 0.53* 0.17 0.70*** 0.70**
Crown 0.76*** 0.81*** 0.05 0.85*** 0.88***
Above 0.87*** 0.90*** 0.16 0.89*** 0.83***
28
Table 4 Simultaneous fit of biomass models for the studied species
Species Compartment MRES RMSE R2adj Selected model Estimated parameters
Pr > |t|
Allophyllus
abyssinicus
Above 0.01 10.27 0.84 Wabove = β*(d*h) 0.3937 <.0001
Olea europaea
ssp. cuspidata
Stem 0.72 12.01 0.93 Wstem = β*(d2*h) 0.02746 <0.0001 Br27 -0.53 4.47 0.79 WBr27 = (β*d2)+(λ*h) 0.05744 <.0001
0.6856 0.0008 Br2 0.09 5.29 0.69 WBr2 = β*(d2*h) 0.006584 <.0001 Above 0.27 12.03 0.96 Wabove =∑Wi
Olinia
rochetiana
Stem 0.25 35.06 0.76 Wstem =β*(d*h) 0.3990 <.0001
Crown 1.31 14.41 0.58 Wcrown =
(β*d2)+λ*(d2*h)
0.4550 <.0001 -0.02163 <.0001 Above 1.56 33.38 0.85 Wabove =∑Wi
Rhus glutinosa Stem 3.34 10.57 0.79 Wstem =β*(d2*h) 0.01604 <.0001 Crown -1.24 6.28 0.68 Wcrown = (β*d2)+(λ*h) 0.04867 0.0017 1.3033 <.0001 Above 2.11 11.11 0.88 Wabove =∑Wi
Scolopia
theifolia
Stem 1.52 6.94 0.75 Wstem =β*(d
2
*h) 0.02107 <.0001 Crown 0.65 7.67 0.55 Wcrown = β*(d*h) 0.4253 <.0001 Above 2.17 11.04 0.79 Wabove = ∑Wi
29
Table 5 Comparison of models for aboveground biomass estimation (site-specific and generalized equations)
Species Model reference Relative bias (%)
Average deviation (%)
Relative RMSE
t-test t-Statistic p-value Allophyllus abyssinicus This study -7.41 21.09 0.280 0.0040 0.9969
Generalized Brown et al. (1989) 36.14 38.95 0.416 4.4287 0.0006
Generalized Brown and Lugo (1992) -2.58 23.36 0.342 -0.8096 0.4327
Generalized Brown (1997) 18.45 25.31 0.287 24.4615 0.0286
Generalized Chave et al. (2005) -4.50 19.97 0.298 -0.8262 0.4236
Generalized Chave et al. (2014) 7.21 23.38 0.303 0.1729 0.8654
Olea europaea This study -5.29 14.32 0.204 0.0955 0.9251 Generalized Brown et al. (1989) 40.81 43.21 0.445 6.2926 <0.0001 Generalized Brown and Lugo (1992) 15.12 18.41 0.216 4.0902 0.0008
Generalized Brown (1997) 28.41 30.12 0.331 5.0996 0.0001
Generalized Chave et al.(2005) 1.54 14.16 0.188 0.7807 0.4464
Generalized Chave et al. (2014) 6.96 14.00 0.180 2.4653 0.0254
Olinia rochetiana This study -19.43 29.18 0.408 0.2015 0.8427
Generalized Brown et al. (1989) 44.16 46.50 0.497 4.2731 0.0005
Generalized Brown and Lugo (1992) 9.46 22.23 0.303 -0.2241 0.8253
Generalized Brown (1997) 35.11 36.90 0.398 3.8545 0.0013
Generalized Chave et al. (2005) 5.27 17.30 0.243 -0.1119 0.9122
Generalized Chave et al. (2014) 12.09 21.84 0.287 0.2137 0.8333
Rhus glutinosa This study 4.17 13.32 0.156 0.6595 0.5244
Generalized Brown et al. (1989) 13.07 32.05 0.374 0.4016 0.6965
Generalized Brown and Lugo (1992) -22.89 29.77 0.390 -2.126 0.0593
Generalized Brown (1997) -4.19 31.22 0.340 -0.7757 0.4559
Generalized Chave et al. (2005) -44.03 44.03 0.532 -3.0834 0.0116 Generalized Chave et al. (2014) -34.32 37.04 0.472 -2.5783 0.0275 Scolopia theifolia This study 2.43 13.59 0.168 0.4193 0.8290 Generalized Brown et al. (1989) 55.45 58.71 0.582 10.1593 <0.0001 Generalized Brown and Lugo (1992) 40.91 43.31 0.444 9.2180 <0.0001
Generalized Brown (1997) 42.49 44.99 0.458 8.5675 <0.0001