Health Data in a Spanish Region
Diego Calvo Barreno1, Susel Góngora Alonso1(&), Isabel de la Torre Díez1, Miguel López Coronado1,
and Manuel Franco2
1 Department of Signal Theory and Communications, and Telematics
Engineering, University of Valladolid, 47011 Valladolid, Spain
2
Psiquiatry Service, Hospital Zamora, 49004 Zamora, Spain
Abstract. Mental Health disorders such as schizophrenia, depression, and dementia have a great impact on society worldwide. Recent developments have witnessed numerous advances in telemedicine that allow remote monitoring of elderly people with diseases of this pathology. One of key factors influencing recent advances in health information systems is the use of data extraction robust techniques used to extract knowledge from medical databases. The main objective of the paper is to develop a web application that allows extracting knowledge from a database of patients with psychiatric disorders and helps health personnel to know in depth the existing patient profiles and thus improve decision making. The scenario chosen for this study consists in a government of Castile and Leon database of 53641 income records of patients with Mental Health disorders between 2005 and 2015. Applying descriptive statistics for the analysis of data, the results show different parameters regarding Hospitalization behavior such as rate, average, hospitalization days of the patient’s number per hospital and outsourcing services.
Keywords: Application
HospitalizationsMental healthR software1
Introduction
Mental Health’s diseases are greatly influencing society [1]. Mental illnesses such as autism, bipolar disorder and schizophrenia have a particularly high impact on affected individuals and their families, and they represent a heavy economic burden for the health care system [2, 3]. These disorders are complex, with a significant degree of shared clinical presentation and may share common genetic origins [4].
Mental Health is an area with great needs for improvement, as the volume of data is growing, and its objective is to improve the classification and diagnostic analysis to better understand the accumulation of patient data and make them profitable [5, 6]. Data mining techniques and statistical analysis are the most used tools for prediction in this area.
The statistical analysis includes the concept of collection, settlement, scrutiny, representation, manipulation, clarification and presentation of significant information
©Springer Nature Switzerland AG 2020
J. Henriques et al. (Eds.): MEDICON 2019, IFMBE Proceedings 76, pp. 898–906, 2020.
[7]. There are two statistical techniques: descriptive and inferential statistics, in this study we will use descriptive statistics to analyze the data in the application.
Currently, many compliance monitoring technologies have been developed for medical purposes based on smartphones, sensors, etc. [8]. In [6] focus on the devel-opment of a mobile/web application, through which patients send their symptomatic queries to doctors through a server. The proposed model is the solution for the efficient collection of data, the provision of integrated medical care with analysis. While [2] propose a context-based approach, with the objective of providing medical supervisors with a series of customized applications and services aimed at exploiting the multi-parameter contextual data collected through a long-term monitoring procedure.
In societies, the diagnosis of mental disorders in individuals is often deficient due to lack of understanding of their behavior, symptoms and inadequate knowledge. Many times, an inadequate diagnosis leads to an incorrect treatment that can cause an irre-versible deterioration in the mental state of the client, including hospitalization and/or premature death [9].
In the present work we show the development and evaluation of data analysis software for its exploitation in Mental Health, in order to obtain patterns of hospital-ization, diagnosis and therapies.
There are similar publications in thefield of Mental Health that base their study on developing an online family health tree system that allows discarding types of patients with high risk depression and having a good risk management for health [10]. In [4] investigate how text mining based on Electronic Medical Records (EMRs) and sta-tistical analysis could define the phenotypic limits of three major neuropsychiatric diseases: autism, bipolar disorder and schizophrenia. The results can help to define the limits between different mental illnesses, facilitate the creation of cohorts for clinical and genomic studies and reveal how clear the limits are defined by the experts.
In [9] present a semiautomatic system that helps in the preliminary diagnosis of the patient with psychological disorder. In [11] present the PRISM platform that allows patients and physicians to use continuous sources of passive data for an early and accurate diagnosis, as well as constant monitoring of patients suffering from mental disorders. While in [12] they use the RStudio tool through different R codes to extract the tweets from the different mHealth applications and analyze the feelings and emo-tions of the users, classifying them as positive, negative or neutral, with the objective of preventing the depression.
The methodology used in this review is described below. Afterwards, the results obtained the discussion of them and thefinal conclusions of this research work will be finalized.
2
Methodology
The development framework used to build the graphical interface has been Shiny since it provides a series of advantages such as simple control over layout, interactivity through its functionality called reactivity and a multitude of combos to perform data filtering in a simple and fast way [15]. While the development environment used has been RStudio due to theflexibility and ease of use that it provides.
2.1 Database
It is based on an anonymous dataset of psychiatric patients from the 11 public hospitals of Castile and Leon. The dataset contains 53,641 records from 2005 to 2015. The data used follow the international standard for coding diseases CIE-9.
The initial dataset has 42fields; once we have made a series of treatments we obtain a dataset of 21fields, as shown in Fig.1. Initially irrelevant variables are eliminated for the study such as: descriptions of diagnoses or therapies. Null values, double blanks, special characters are also eliminated and the capitals and lowercase letter of each value is standardized in order to avoid false categories. Subsequently the variables are recategorized: hospitalization days, patient’s age, hospital unit, discharge reason and admission type, for some of them as the hospital unit a more exhaustive study had to be done since the original database did not have this categorization in a direct way.
Once the variables are re-categorized, all the diagnoses are reunited in a single category with multiple values and all the therapies that apply to each patient in another category. Finally, all the variables are translated, for this purpose, in the majority of cases, self-generated translation files have been used and in other cases, as in the diagnoses, the official table of international classification of diseases [16].
2.2 Statistic Techniques
Several statistical techniques have been implemented using the graphic package“ gg-plot2”of R that allow extracting knowledge from the dataset, these techniques can be categorized into 4 blocks:
Block 1 of Trend Evolution. Multiple line graphs, bar chart, horizontal bar chart, grouped bar chart, and Japanese box or candle charts are used.
Block 2 of Representation of a Part with Respect to Total. Circular graphs and bar graphs are used.
Block 3 of Frequency Distribution. Histograms are used.
Block 4 of Comparison. Japanese box or candle charts and grouped bar charts are used.
3
Results
3.1 Software
In this study we have developed a web application capable of extracting knowledge of each of the patient’s dataset variables with psychiatric disorders in the region of Castile and Leon, Spain for the period between 2005 and 2015.
The extracted knowledge can be dynamically segmented with respect to numerous criteria such as: hospital, hospitalization days, patient age, hospital unit, discharge reason, admission type, and group of diagnostic or therapy. It can also be categorized into 4 blocks:
Block 1 Hospitalization. It shows graphs of evolution where it visualizes the number and averages of hospitalizations, the hospitalizations ratio with respect to the global population of each community and hospitalization average days of the patients.
Block 2 Patients. It shows typology graphs of the patients and categorizes them by discharge reason, age, hospitalization days, admission type or recurrency.
Block 3 Diagnoses. It shows the cases number graphs presented by each diagnostic block or sub-block according to the CIE-9standard.
Block 4 Therapies. It shows graphs of the most repeated therapies and the ratio when no therapy is applied.
psychiatric analyzes, providing the health personnel answers to many questions that until now had no answer.
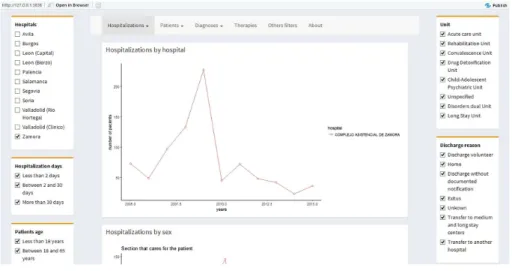
Figure2 shows the graphic interface of the application, from which results of hospitalization (rate, average, outsourcing services), diagnosis and therapies of patients with psychiatric disorders are obtained. The mainfilters take into account the patient age, provinces and the hospitalization days.
Afterwards in the next section we show the results of evaluations carried out with the data proposed in the methodology.
3.2 Evaluation of Database with Real Data
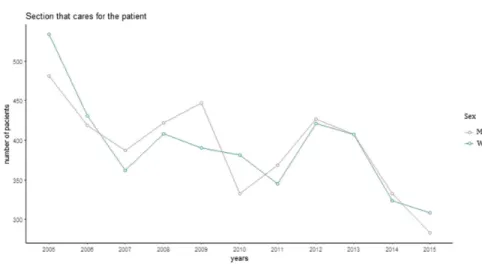
As a result of the database analyzed, the statistics per year of the patient’s number with hospitalization in each of the provinces is obtained, where the university hospital of Valladolid has the highest number reaching the highest number of 290 patients in 2013. Regarding gender, the number of female patients in the years 2005, 2006, 2010 and 2015 exceeded the number of hospitalizations in relation to male patients (See Fig.3), taking into account all age ranges. The results vary whenfiltering in patients younger than 18 years and older than 65 years, women being the most prevalent hospitalizations. The prevalent diseases were classified in the database taking into account the CIE-9 international standard for the selected period. When screening patients aged between 18 and 65 years to determine the diagnosis percentage of the most prevalent mental illnesses in the 11 hospitals of the region, we obtained (See Fig.4) that psychosis has the highest percentage of occurrence 60%, followed by neurotic, personality and non-psychotic disorders that make up 26% of all patients in that range.
The application determines the most common therapies in patients taking into account range of ages and hospitals. The therapies with higher percentages of occur-rence are: in the hospitals of Zamora, Burgos and Valladolid (Clinical) the determination of the psychiatric mental state, another vein puncture and the computerized axial tomography of the head. In Valladolid (Río Hortega), Palencia and Ávila is: another psychiatric therapy with drugs, the hospitals of Soria and Segovia is: the electrocar-diogram while in León (Capital) and León (Bierzo) are: EM blood, another microscopic
Fig. 3. Statistics hospitalization by gender.
examination and another interview with psychiatric evaluation respectively. Figure5
shows the most prevalent therapy taking into account the 11 hospitals.
The application also contains a series of additional filters that allows more expe-rienced users to obtain more accurate statistics regarding a more specific type of disorder such as suicide, poisoning, drug abuse, etc.
4
Discussion
Currently there are many medical applications for the exploitation of data, making use of both descriptive statistics and Data Mining techniques. How to achieve a more efficient result of medical care remains an open question for future work where medical data grow at a dizzying pace. A distributed system should be implemented to exchange data between laboratories, hospital systems, clinical centers and other interested parties. Traditional analysis tools have become friendly and transparent and can be used to improve the effectiveness of data analysis [17].
In this study, we developed a web application based on data from patients with psychiatric disorders in the region of Castile and Leon, Spain, with the aim of obtaining patterns of hospitalization, diagnosis and therapies in Mental Health.
The data were analyzed using descriptive statistics; in this case it takes into account age ranges of patients, gender, hospital where it belongs, admission days, admission type, among others. The results show different parameters regarding hospitalization behavior such as rate, average, hospitalization days of the patient’s number per hospital and outsourcing services.
The application allows to categorize the number of patients by age, hospitalization days, admission and recurrence, as well as categorizes the diseases diagnosed in Mental Health following the CIE-9 standard. Finally, it allows determining the occurrence frequency percentage of the most common therapies by hospitals included in the study.
The descriptive analysis tools used in the application are sufficiently flexible to allow experienced and less experienced analysts to perform useful analyzes in other Health pathologies. An important factor to highlight in the application is its ability to update the results according to the initial parameters you want to estimate, for hospi-talizations, diagnosis and therapies. In addition, the design of the interface is suffi -ciently generic to allow users with less experience in data analytics to handle it with ease.
The most notable limitation of this study has been that the data related to the dataset used only included the Autonomous Community of Castilla and León and therefore it has not been possible to extract comparisons of patients with other autonomous communities or countries.
5
Conclusion
The use of descriptive statistics as well as Data Mining applied to the database can increase the confidence level of the results obtained. In fact, the era of big data offers new opportunities to better understand the behavior of health data as well as the prediction of risk factors and patterns in diseases such as Mental Health. Hence, as future lines we intend to apply to the aforementioned database machine learning and deep learning techniques: (1) clustering of patients to determine pathological profiles, (2) use of neural networks for the prediction of pathologies, (3) use of machine learning for the prediction of therapies from diagnosed pathologies; and (4) comparison of supervised learning techniques for predicting diseases of Mental Health.
Acknowledgments. This research has been partially supported by European Commission and the Ministry of Industry, Energy and Tourism under the project AAL-20125036 named“Wetake Care: ICT-based Solution for (Self-) Management of Daily Living”.
Conflict of Interest. No author has a conflict of interest with the contents of this manuscript.
References
1. Becker, D., van Breda, W., Funk, B., Hoogendoorn, M., Ruwaard, J., Riper, H.: Predictive modeling in e-mental health: a common language framework. Internet Interv.12, 57–67 (2018)
2. Panagiotakopoulos, T.C., Lyras, D.P., Livaditis, M., Sgarbas, K.N., Anastassopoulos, G.C., Lymberopoulos, D.K.: A contextual data mining approach toward assisting the treatment of anxiety disorders. IEEE Trans. Inf. Technol. Biomed.14(3), 567–581 (2010)
3. Chen, W.-Y., Chen, L.-Y., Liu, H.-C., Wu, C.-S., Yang, S.-Y., Pan, C.-H., et al.: Antipsychotic medications and stroke in schizophrenia: a case-crossover study. PLoS One 12(6), e0179424 (2017)
5. Frantzidis, C.A., Bratsas, C., Klados, M.A., Konstantinidis, E., Lithari, C.D., Vivas, A.B., et al.: On the classification of emotional biosignals evoked while viewing affective pictures: an integrated data-mining-based approach for healthcare applications. IEEE Trans. Inf. Technol. Biomed.14(2), 309–318 (2010)
6. Panda, M., Ali, S.M., Panda, S.K.: Big data in health care: a mobile based solution. In: 2017 International Conference on Big Data Analytics and Computational Intelligence, ICBDAC, pp. 149–152. (2017)
7. Das, N., Das, L., Rautaray, S.S., Pandey, M.: Big data analytics for medical applications. Int. J. Mod. Educ. Comput. Sci.10(2), 35–42 (2018)
8. He, T., Ogunti, R., Puppala, M., Chen, S., Yu, X., Mancuso, J.J., et al.: A smartphone app framework for segmented cancer care coordination. In: 3rd IEEE EMBS International Conference on Biomedical and Health Informatics, BHI, pp. 372–375 (2016)
9. Azar, G., Gloster, C., El-Bathy, N., Yu, S., Neela, R.H., Alothman, I.: Intelligent data mining and machine learning for mental health diagnosis using genetic algorithm. In: IEEE International Conference on Electro Information Technology, pp. 201–206 (2015) 10. Chang, C.C., Chen, R.S., Liao, K.H., Sun, P.R.: Estimation of depression risky of family
health tree system - using the family functioning scale. In: Proceedings - International Conference on Management and Service Science, MASS (2009)
11. Kamdar, M.R., Wu, M.J.: PRISM: a data-driven platform for monitoring mental health. In: Pacific Symposium on Biocomputing, vol. 21, pp. 333–344 (2016)
12. Pai, R.R., Alathur, S.: Assessing mobile health applications with twitter analytics. Int. J. Med. Informatics113, 72–84 (2018)
13. Assink, M., Wibbelink, C.J.M.: Fitting three-level meta-analytic models in R: a step-by-step tutorial. Quant. Methods Psychol.12(3), 154–174 (2016)
14. Pradhananga, Y., Karande, S., Karande C.: CBA: cloud-based bigdata analytics. In: Proceedings - 1st International Conference on Computing, Communication, Control and Automation ICCUBEA, pp. 47–51 (2015)
15. Moraga, P.: SpatialEpiApp: a Shiny web application for the analysis of spatial and spatio-temporal disease data. Spat. Spatio-spatio-temporal Epidemiol.23, 47–57 (2017)
16. eCIE9MC Clasificación Internacional de Enfermedades. http://eciemaps.msssi.gob.es/ ecieMaps/browser/index_9_mc.html. Accessed 18 Jun 2018