Chirped pulse Phase sensitive Reflectometer Assisted by First Order Raman Amplification
8
0
0
Texto completo
(2) This article has been accepted for publication in a future issue of this journal, but has not been fully edited. Content may change prior to final publication. Citation information: DOI 10.1109/JLT.2017.2756558, Journal of Lightwave Technology. Chirped-pulse Phase-sensitive Reflectometer Assisted by First Order Raman Amplification Juan Pastor-Graells, Javier Nuño, María R. Fernández-Ruiz, Andres Garcia-Ruiz, Hugo F. Martins, Sonia Martin-Lopez, and Miguel Gonzalez-Herraez. Abstract— The use of linearly chirped probe pulses in phase sensitive-(Φ)OTDR technology has been recently demonstrated to allow for high-resolution, quantitative and dynamic temperature or strain variation measurements in a simple and very robust manner. This new sensing technology, known as chirped-pulse ΦOTDR, had a maximum reported sensing range of 11 km. In this paper, a 75 km sensing range with 10 m spatial resolution is demonstrated by using bidirectional first order Raman amplification. The system is capable of performing truly linear, single-shot measurements of strain perturbations with an update rate of 1 kHz and 1 nε resolution. The time-domain trace of the sensor exhibits a signal to noise ratio (SNR) in the worst point of >3 dB, allowing to monitor vibrations up to 500 Hz with remarkable accuracy. To demonstrate the capabilities of the proposed system, we apply <100 nε vibrations in the noisiest point of the fiber, with a frequency modulated from 70 Hz to 150 Hz over a period of 10 s. The results obtained in these conditions demonstrate a vibration detection SNR of >20 dB (with only 300 ms analysis window and no post-processing) and no evidence of nonlinearity in the acoustic response. The optical nonlinear effects that the probe pulse could suffer along the sensing fiber are thoroughly studied, paying special attention to potential distortions of the pulse shape, particularly in its instantaneous frequency profile. Our analysis reveals that, for proper values of peak power, the pulse does not suffer any major distortion and therefore the system performance is not compromised. Index Terms— Acoustic sensor, chirp modulation, distributed sensor, Rayleigh scattering, Raman amplification.. Manuscript received November xx, xxxx; revised Month xx, xxxx; accepted Month xx, xxxx. Date of publication Month xx, xxxx; date of current version Mont xx, xxxx. This work was supported in part by: H2020 European Research Council (ERC) (307441); Seventh Framework Programme (FP7) (608099); Ministerio de Economía y Competitividad (MINECO) (TEC201345265-R, TEC2015-71127-C2-2-R); Horizon 2020 Framework Programme (H2020) (DOMINO); European Commission (EC) (MSCA-ITN-ETN722509); Consejería de Educación, Juventud y Deporte, Comunidad de Madrid (SINFOTON-CM Program: S2013/MIT-2790). The work of JPG, JN and SML was supported by the Spanish MINECO (FPI, “Juan de la Cierva” and “Ramón y Cajal” contracts, respectively). J. Pastor-Graells, J. Nuño, M. R. Fernández-Ruiz, A. Garcia-Ruiz, S. Martin-Lopez and M. Gonzalez-Herraez are with the Departamento de Electrónica, Universidad de Alcalá, 28805 Madrid, Spain (e-mail: [email protected]; [email protected]; [email protected]; [email protected]; [email protected]; [email protected]). H. F. Martins is with FOCUS S. L., C/ Orellana, 1, 1º Izqda, 28804 Madrid, Spain (email: [email protected]). Color versions of one or more of the figures in this paper are available online at http://ieeexplore.ieee.org. Digital Object Identifier 10.1109/JLT.2014.2308354. I. INTRODUCTION. D. optical fiber sensors (DOFS) have attracted considerable attention in the last decades due to their capability for the continuous monitoring of different physical parameters (temperature, strain, etc.) over long fiber distances [1]. Particularly, DOFS based on phase-sensitive optical timedomain reflectometry (ΦOTDR) are commonly used for vibration detection with potential applications in pipeline surveillance and perimeter protection [2]. Recent advances in this technology have allowed to perform high-resolution, quantitative dynamic temperature or strain variation measurements in a simple, robust and time-effective manner [3]–[5], based on the use of linearly chirped probe pulses. This novel technique is named chirped-pulse phase-sensitive optical time-domain reflectometry (chirped-pulse ΦOTDR). As with traditional ΦOTDR, range and resolution are tightly related parameters of the system. In order to increase the measurable range, higher energy probe pulses are required. This could be achieved by increasing the pulse width, which translates however into a reduction of the sensing spatial resolution. On the other hand, the peak power of the pulse could be alternatively risen, but this solution is limited by the advent of nonlinear effects [6]–[8]. Usually, modulation instability (MI) is the first nonlinear effect that appears in a ΦOTDR-based sensor. Other nonlinear effects such as Brillouin scattering do not appear in the power regime in which ΦOTDR operates. MI generates two sidebands at each side of the probe carrier frequency. Furthermore, the use of traditional rectangular probe pulses generally induces a power exchange between the pump and the sidebands known as Fermi-Pasta-Ulam (FPU) recurrence [9]. This effect is revealed in the trace as a visibility fading at certain specific positions and, consequently, a loss in the sensing sensitivity at those positions. A recent study indicates that Gaussian or triangular envelope pulses limit the effect of MI and mitigate the advent of the FPU recurrence [10]. Still, this procedure cannot increase the measurable range of ΦOTDR sensors in a very significant amount. For a major increase of the ΦOTDR range, distributed amplification [11], [12] or signal postprocessing [13] could be more suitable solutions. Over the last years, distributed nonlinear amplification techniques (Raman, Brillouin or parametric) have been extensively implemented in DOFS [14]–[19]. As the attenuation losses are compensated along the measuring fiber, ISTRIBUTED. 0733-8724 (c) 2017 IEEE. Personal use is permitted, but republication/redistribution requires IEEE permission. See http://www.ieee.org/publications_standards/publications/rights/index.html for more information..
(3) This article has been accepted for publication in a future issue of this journal, but has not been fully edited. Content may change prior to final publication. Citation information: DOI 10.1109/JLT.2017.2756558, Journal of Lightwave Technology. the sensing range can be enlarged without compromising the resolution. Regarding sensors based on Rayleigh scattering, spatial resolutions of 10 m over sensing lengths exceeding 100 km have been demonstrated [17]–[19]. Nevertheless, when distributed amplification is to be applied to chirped-pulse ΦOTDR, it is important to consider that the nonlinear and chromatic dispersion effects that the pulse may suffer along the fiber will affect not only the pulse shape but also its instantaneous frequency profile. In this case, distortions in the linear frequency profile of the pulse can be detrimental for the proper operation of a chirped-pulse ΦOTDR system. For this reason, increasing the sensing range using nonlinear distributed amplification is not trivial, and deserves a careful study. To date, the maximum sensing range reported in this technique is 11 km [5] without distributed amplification. In this paper, the possibility of increasing the sensing range of chirped-pulse ΦOTDR by means of first order Raman amplification is studied. Additionally, we thoroughly analyze the possible distortions induced in the phase and intensity profiles of the optical probe pulse in its propagation along the sensing fiber. A sensing range of 75 km with 10 m spatial resolution and 1 nε resolution in the measurement of strain perturbations is successfully demonstrated. II. CHIRPED-PULSE ΦOTDR: GENERAL CONCEPTS In this technique, as in a traditional ΦOTDR, a highly coherent optical pulse is injected into a single mode fiber. The pulse generates a backscattered signal that is analyzed in the time domain. Since the scattering centers are positioned randomly along the optical fiber, the backscattered signal presents a noise-like pattern resulting from the coherent interference of the reflected light. This pattern remains constant over the time when no perturbation is applied onto the fiber. When a perturbation affects a fiber section, a refractive index change is induced in that particular location. In the traditional scheme, this refractive index change ∆n produces an intensity change in the corresponding section of the power trace, which is nonlinear with the undergone change. A linear recovery of the applied perturbation can be achieved by either scanning the frequency of the laser [20] or by measuring the phase of the backscattered field [21]. However, these procedures imply a substantial reduction of the bandwidth of the applied perturbations or complexities in the detection and processing scheme. In contrast, in chirpedpulse ΦOTDR a refractive index change simply translates into a proportional temporal shift ∆t in the corresponding section of the power trace. The relationship between ∆n and ∆t is given by [3]–[5]:. n 1 p n 0 p. t . (1). where ν0 is the central frequency of the probe pulse, ∆ν p is the chirp spectral content, τp is the probe pulse temporal length and ∆t the measured temporal shift. Notice that ∆t is simply. measured by means of temporal correlations using single-shot intensity-only traces. Finally, the measured ∆n can be related to temperature (∆T) or strain (∆ε) changes in conventional single-mode fibers by the following relations [20]:. n 6.92 106 T n n 0.78 n. (2) (3). where n is the effective refractive index of the fiber. Thus, the system allows for the quantitative measurement of distributed temperature or strain changes with no need for a frequency scan or the application of coherent detection methods. More information about the fundamentals of this sensor can be found in a previous work by the same authors [3]. III. EXPERIMENTAL SETUP The setup used to measure vibrations over long fiber distances is presented in Fig. 1. It is based on a chirped-pulse ΦOTDR scheme [3]–[5] but including a continuous wave (CW) Raman pump. The Raman pump is applied at the two ends of the sensing fiber aimed at compensating the energy loss of both the probe pulse and the reflected trace along the fiber, and consequently achieving larger measurement ranges. The probe light source is a laser diode (LD) with a linewidth of 10 kHz emitting at 1549.35 nm and working in continuous emission. A standard current and temperature (I&T) controller is used to select the emitted central wavelength of the LD. A secondary current control generates a repetitive ramp signal to induce a linear chirp in the LD output. A semiconductor optical amplifier (SOA), fed by an electrical square signal, gates the LD output light creating linearly chirped optical pulses. The 2.5 ns rise/fall times and extinction ratio (ER) of >50 dB of the SOA allow us to generate 100 ns-width quasi-square-shaped pulses with high ER. This leads to a spatial resolution of 10 m in the phasesensitive reflectometer scheme [1], [3]. The ramp signal is controlled so that the resulting linearly chirped pulse has a total spectral content of 630 MHz. The pulse power is boosted using an erbium doped fiber amplifier (EDFA). In order to eliminate the amplified spontaneous emission (ASE) added by the EDFA, a dense wavelength division multiplexer (DWDM) with a spectral width of 100 GHz is used. The remained ASE centered at the pulse frequency (distributed temporally outside the pulse), induces intra-band noise, which generally is an important limitation in phase-sensitive reflectometers [22]. To avoid this, in addition to the optical filter, the pulse is temporally gated using an optical switch with rise/fall times of 100 ns and a typical ER of 25 dB. The three electrical signals used (i.e., the ramp applied at the secondary current control, and the square signals for the SOA and switch) are generated by the same signal generator (SG), what ensures a perfect synchronization between them. The generated linearly chirped optical pulse is then. 0733-8724 (c) 2017 IEEE. Personal use is permitted, but republication/redistribution requires IEEE permission. See http://www.ieee.org/publications_standards/publications/rights/index.html for more information..
(4) This article has been accepted for publication in a future issue of this journal, but has not been fully edited. Content may change prior to final publication. Citation information: DOI 10.1109/JLT.2017.2756558, Journal of Lightwave Technology. Fig. 1. Experimental setup. Acronyms are explained in the text.. launched into the fiber under test (FUT). Previously, a tunable attenuator (TA) controls the power injected into the FUT to avoid nonlinearities in the fiber such as MI [7], [8]. The FUT is composed of two fiber spools of 50 and 25 km respectively, constituting a total sensing fiber of 75 km. Vibrations were applied along 20 meters strapped around a PZT and situated after the first fiber spool at the kilometer 50, which is the point with less signal to noise ratio (SNR) when the bidirectional distributed Raman amplification is applied. The Raman pump is a CW Raman Fiber Laser (RFL) emitting at 1455 nm with a RIN (relative intensity noise) <-110 dBc/Hz, which can achieve emission powers of up to 2 W. In our scheme, the RFL was emitting a total power of ~700 mW. The RFL beam is divided by a 50/50 optical coupler resulting in two beams of 350 mW. A TA is employed to reduce one of the beams to 230 mW. Two wavelength division multiplexers (WDM) are used to inject the Raman pump into the FUT. The chirped probe pulse and the Raman pumps are conducted through the 1550 and 1450 ports of the WDMs, respectively (see Fig. 1). The 350 mW and 230 mW beams are co-propagated and contrapropagated with the pulse, respectively. This unbalanced bidirectional pumping scheme has been chosen as it provides a good trade-off between noise and nonlinear impairments. The light backscattered from the fiber is first filtered in using a tunable optical filter with a spectral width of 15 GHz to minimize the ASE generated by the Raman pump before detection. Then, the filtered backscattered signal is amplified by another set of EDFA and DWDM. Finally, the resulting backscattered signal is detected by a p-i-n photodetector with a bandwidth of 1 GHz and a high-speed digitizer with 40 GHz sampling rate. IV. ANALYSIS OF THE SYSTEM LIMITATIONS: SNR AND NONLINEAR EFFECTS. In this section, the SNR of the Raman-assisted chirped-. pulse ΦOTDR and the induced distortions in the propagating probe pulses are analyzed. As it was explained above, sensing over longer distances without distributed amplification implies increasing the amount of energy of the input probe pulse. This can be achieved by either increasing the temporal width of the input probe pulse or its peak power. Commonly, it is undesirable to reduce the spatial resolution, which happens when the temporal width of the pulse is increased. Thus, it is generally preferred to rise the peak power of the pulse, up to the limit of appearance of nonlinear effects [6]–[8], particularly MI and its associated FPU recurrence. Practically this means that the distance range limit of conventional ΦOTDR schemes is in the order of 40-50 km with conventional spatial resolution values (in the order of several meters). Distributed amplification has proven to be a powerful tool to enhance the range of conventional ΦOTDR sensors, as the probe power along the fiber can be kept at a relatively high level all along the sensing fiber without reaching nonlinearities [17]–[19]. Nevertheless, the use of distributed amplification in these schemes requires a careful optimization of both the probe peak power and the Raman pump powers launched in both directions of the sensing fiber [17]. The optimization is not evident, and it is generally done with two basic guidelines: (1) the power of the input pulse has to be kept low enough to avoid MI in the probe pulse and (2) the Raman gain is only interesting up to the point of overcoming the thermal noise limitations of the detector. Beyond that point, the expectable SNR increase is marginal, and moreover the relative intensity noise (RIN) transfer from the Raman pump to the detected signal starts to dominate, as it grows exponentially with the pump power. The theoretical models of signal and noise evolution used in this paper have been already described in the literature [17], [23], and the different component parameters have been adapted to our particular devices. Compared to a conventional Raman-assisted ΦOTDR, it is interesting to note here that the problem of optimization in the Raman-assisted chirped-pulse ΦOTDR case is quite different, as the bandwidth of the signal of interest is typically one order of magnitude larger than in conventional ΦOTDR. This implies that the photodetector bandwidth is much larger, and that the weight of thermal noise in the equations is substantially larger than in the conventional scheme. To illustrate which is the maximum range measurable in a non-amplified and in an amplified chirped-pulse ΦOTDR respectively, we provide a clarifying example in what follows. Fig. 2-top shows a trace obtained in our system by injecting 100 ns-width transform-limited square pulses with 150 mW peak power in a 75 km fiber. This value of peak power has been proven experimentally to be the limit for the onset on nonlinear effects in this case. As it can be observed, the maximum measurable range with a reasonable SNR in the detected trace is around 20 km. Here, the most important sources of noise are the thermal noise of the photodetector and the ASE noise introduced by the EDFA. Next, we examine the achievable range when using distributed amplification. For. 0733-8724 (c) 2017 IEEE. Personal use is permitted, but republication/redistribution requires IEEE permission. See http://www.ieee.org/publications_standards/publications/rights/index.html for more information..
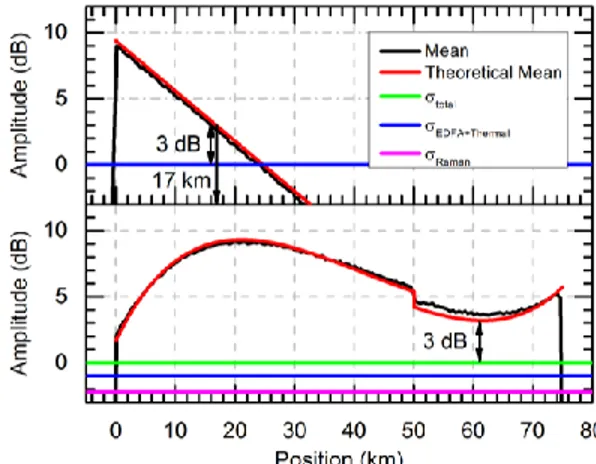
(5) This article has been accepted for publication in a future issue of this journal, but has not been fully edited. Content may change prior to final publication. Citation information: DOI 10.1109/JLT.2017.2756558, Journal of Lightwave Technology. Fig. 2. Detected traces in the experiment; Top - without distributed amplification and input peak power of 150 mW; Bottom - with distributed amplification and input peak power of 25 mW.. this purpose, we employ the configuration described in the previous section; namely, using first order Raman amplification. Fig. 2 – bottom shows the detected trace when the input pulse peak power is 25 mW (limit for the onset on nonlinear effects in this case, as proved below) and first-order Raman amplification is implemented. In this case, although the noise level is higher due to the Raman ASE, the entire trace shows a good SNR, which will allow for the monitoring of vibrations along the whole fiber (75 km). A deeper SNR analysis of the optimized Raman-assisted and the conventional configuration is subsequently developed and presented in Fig. 3. The average value of the experimentally obtained traces (in Fig. 2) is shown in black in Fig. 3, which has been obtained by calculating a moving average of the traces after 100 times averaging. The resulting curves have been normalized to the noise level of a single trace. As mentioned, a theoretical analysis of the evolution of the traces has been carried out using available models [17], [23], and the results are presented in red showing an excellent agreement with the experimental results. In the case without distributed amplification (Fig. 3 – top), an exponentially decaying trace is clearly visible, with an attenuation coefficient of αT ~ 0.4 dB/km. This corresponds to the double of the attenuation coefficient of the used fiber ( 0.2 dB/km), as expected from the fact that the pulse is attenuated in the forward direction while the backscattered light is attenuated in the backward direction (i.e. the net attenuation suffered by the optical trace is twice that of a single pass). On the other hand, the standard deviation of the different noise sources that affect the trace has been also included in the figure. In particular, the thermal noise induced by the photodetector and the ASE noise introduced by the used EDFA have been accounted for, resulting in a standard deviation of σEDFA+Thermal = 1.86 μW. It can be easily observed that the trace is completely buried under the noise after 25 km, and shows an SNR of 3 dB (minimum target SNR) at around only 17 km. However, regarding the case with distributed amplification (Fig. 3 – bottom), the trace SNR is always higher than 3 dB along the entire fiber (75 km). It is worth mentioning that this. Fig. 3. Detected traces and noise levels in logarithmic scale. The traces are normalized to their noise floor level. Top - without distributed amplification and input peak power of 150 mW. Bottom - with distributed amplification and input peak power of 25 mW.. value of SNR is enough to measure vibrations, as it will be shown in the following Section V. In this case, the theoretical signal and noise evolutions are obtained by considering the experimental input pulse peak power (25 mW) and Raman pump powers (350 mW and 230 mW co-propagating and counter-propagating to the pulse, respectively) [17], [23]. Losses of around 1 dB have been estimated in the connection between the two fiber spools. Moreover, the noise produced by the Raman ASE has been added to the total noise, together with the ASE-ASE beat of the Raman pump [23]. An excellent match between experimental and theoretical values is obtained, including the noise levels. In particular, the estimated noise generated by these two contributions from the Raman source is σRaman ~ 1.40 μW (an optical bandwidth of 15 GHz and detection bandwidth of 1 GHz were considered). Thus, the total noise is given by σT = √(σ2EDFA+Thermal + σ2Raman) = 2.28 μW. The estimation of σRaman is in good agreement with the value obtained experimentally for σT, which is ~ 1.32 μW. Next, the effects of MI on the proposed system were analyzed. For this purpose, probe pulses with different values of peak power were injected into the fiber, propagated along the 75 km fiber and subsequently analyzed with a spectrum analyzer. The results are presented in Fig. 4. The obtained results revealed that the pulses are spectrally distorted when their peak power is higher than 50 mW. In contrast, the effect of MI is negligible when the pulse peak power is 25 mW or below. Thus, a peak power of 25 mW seems in this case ideal to obtain the best SNR in the detected trace while avoiding nonlinear effects. In addition, as it was previously explained, it is essential to maintain the linearity in the pulse instantaneous frequency profile for the proper behavior of the sensor. Therefore, we finally study whether the instantaneous frequency profile is distorted during the pulse propagation along the fiber. Hence, the intensity and instantaneous frequency profiles of the probe pulse at the beginning and at the end of the FUT are measured by means of coherent detection [24]. Recall that the pulse peak power is 25 mW and the fiber length is 75 km. The measurements are represented in Fig. 5. In particular, Fig. 5 – top shows the intensity profile of the pulse at the beginning of. 0733-8724 (c) 2017 IEEE. Personal use is permitted, but republication/redistribution requires IEEE permission. See http://www.ieee.org/publications_standards/publications/rights/index.html for more information..
(6) This article has been accepted for publication in a future issue of this journal, but has not been fully edited. Content may change prior to final publication. Citation information: DOI 10.1109/JLT.2017.2756558, Journal of Lightwave Technology. pulse degradation due to the pump depletion typically arises at peak powers much higher than the MI threshold, so we are always working within the safe operation range of the amplifier. V. VIBRATION MEASUREMENTS. Fig. 4. Measured spectrum after the propagation along the FUT (75 km) of pulses with 25 mW and 50 mW. The reference pulse spectrum is represented in black.. the fiber (in black) and after propagation (red). It can be concluded that the intensity profile remains almost unchanged after the propagation. Fig. 5 – bottom shows the instantaneous frequency profile of the pulse before (black) and after propagation (red). It is also possible to observe that the instantaneous frequency profile is not distorted and remains basically linear after the 75 km propagation. These results confirm that the employed optical pulse does not suffer from nonlinear effects along the FUT when its peak power is kept below 25 mW. Under this precondition, vibrations can be properly measured using the presented scheme, as we will demonstrate in the next section.. The feasibility of the presented sensor for dynamic measurement of strain with nano-strain resolution over 75 km of standard single-mode fiber is demonstrated in this section. A 20 m fiber section was strapped around a PZT in the 50 km of the FUT (which is the point with less SNR in the detected trace, namely 3 dB). The PZT was fed with a sinusoidal signal whose frequency was linearly modulated from 70 Hz to 150 Hz with a period of 10 s, thus applying a controlled vibration in the perturbed fiber section. The optical pulses were injected into the fiber with a repetition rate of 1 kHz, allowing us to measure up to 500 Hz vibrations, which is very close to the limit imposed by the pulse time of flight (700 Hz) [22]. The optical pulse length is 100 ns, its spectral content is 630 MHz and the traces were digitized with 40 GSps sampling rate. With these parameters, the system has a spatial resolution of 10 m and strain resolution of 1 nε. Those values were experimentally verified in [3]. It is worth highlighting that Raman assistance does not modify the spatial resolution of the ΦOTDR system. This has been experimentally validated by checking that neither the pulse width nor the chirp distribution are modified by the Raman amplification (see Fig. 5). The method employed to calculate the applied strain in the fiber section is fully described in [3]. It is based on the measurement of the temporal shift induced by the perturbation by means of temporal correlations trace to trace. To provide a graphical example, Fig. 6(a) shows two temporal traces obtained at consecutive shots. The autocorrelation of the trace in black line is shown in black in Fig. 6(b). The crosscorrelation between the two traces in Fig. 6(a) is plotted in Fig. 6(b) in red line. In both cases, a correlation window similar to the pulse width has been employed. Hence, by comparing the correlation peaks, it is possible to measure a temporal delay between traces of 1.3 ns. The corresponding value of strain variation is obtained from the measured delay by using (1) and (3).. Fig. 5. Measured optical pulses for characterization of distortions induced in the propagation along the FUT (75 km). The input pulse and the transmitted pulse are represented in black and red, respectively. The intensity profile is represented in the top of the figure and the instantaneous frequency profile in the bottom.. Other important concerns of the use of Raman-assisted configurations are usually the RIN transfer from the pump to the signal and the pump depletion. Interestingly, in our system the effect of the RIN transfer is equivalent to the effect in a standard ΦOTDR, since the affected bandwidth remains essentially similar in both cases (for these distances, the RIN transfer problem is spectrally bounded below 100 MHz for standard fibers, so it fully enters into the bandwidth of standard ΦOTDR detection) [17]. This means that there is basically no extra RIN noise in this case over the standard ΦOTDR case. Besides, simulations indicate that the temporal. Fig. 6. a) Detail of two detected intensity traces at consecutive shots; (b) Autocorrelation of trace in black in a) (black line), and cross-correlation between the two traces (red line). A temporal shift between traces of 1.3 ns is measured.. Following the described procedure, the resulting dynamic strain measurements are shown in Fig. 7. The applied vibration was measured along 20 s (two frequency modulation periods between 70 Hz and 150 Hz). Fig. 7(a) shows a detail. 0733-8724 (c) 2017 IEEE. Personal use is permitted, but republication/redistribution requires IEEE permission. See http://www.ieee.org/publications_standards/publications/rights/index.html for more information..
(7) This article has been accepted for publication in a future issue of this journal, but has not been fully edited. Content may change prior to final publication. Citation information: DOI 10.1109/JLT.2017.2756558, Journal of Lightwave Technology. of the measured strain between the instants 4.6 s and 4.8 s. The observed vibration amplitude is ~50 nε. In this case, the measured strain is calculated by correlating all the measured traces always with the first one. Due to the fact that the maximum applied strain is ~50 nε, the maximum frequency shift is ~8 MHz, which is much lower than the spectral content of the pulse (630 MHz). For this reason, the measurement process is developed properly. Fig. 7(b) presents the spectrogram of the measured vibration along 20 s. The instantaneous frequency of the spectrogram was calculated using a moving window of 300 ms width. It is observed that the vibration is measured with an SNR >20 dB, which allows us to successfully detect and quantify the applied triangularvarying vibration signal. Here it is worth noting that in chirped-pulse ΦOTDR, the vibration measurement SNR relies on measurements of time shifts in the trace, rather. VI. CONCLUSION In this study, the authors have proposed a long-range chirped-pulse phase-sensitive reflectometer using first order Raman amplification. The spatial resolution of the proposed system is 10 m and the range is 75 km. In terms of measurement range, this implies a six-fold improvement over the previous best published result using this technique [5]. Dynamic linear strain is measured with a resolution of 1 nε, allowing precise detection and characterization of vibrations up to 500 Hz. The system was tested with a vibration whose frequency was modulated from 70 Hz to 150 Hz with a period of 10 s. The system can measure those vibrations with 20 dB SNR in the position of worse SNR of the trace, which is obtained in km 50 of the FUT. To date, it is the first system capable to realize linear and dynamic strain measurements along such long distance without the need for coherent detection, to the best of our knowledge. Additionally, the authors have studied the power limits for the onset of nonlinear effects in the probe pulse during its propagation along the fiber. It is confirmed that the probe pulse does not suffer any distortion in its propagation along the FUT (neither in the intensity shape nor in the linear instantaneous frequency profile) whenever a proper value of input peak power is selected (below 25 mW in our particular setup). REFERENCES [1] [2]. [3]. [4]. [5]. Fig. 7. Measured strain variations when a vibration (with linearly modulated frequency from 70 Hz to 150 Hz with a period of 10 s) is applied by a PZT in 20 m of fiber around kilometer 50 of the FUT during 20 s. a) Detail between 4.6 s and 4.8 s. b) Spectrogram (logarithmic scale – dB) along 20 s (instantaneous frequency calculated using a moving window of 300 ms width of the measured dynamic strain.. than on intensity/phase variations in the trace. That is why it is possible to obtain a measurement SNR higher than the trace SNR. Also, as it has been previously demonstrated in [3] and revisited in Section II, chirped-pulse phase-sensitive reflectometers, unlike traditional phase-sensitive OTDRs, can provide absolute values of refractive index variations from the direct detection of the trace. This is well demonstrated herein, where the amplitude of the applied vibrations is well recorded and moreover, no harmonic component appears in Fig. 7(b). It is worth highlighting that the presented results are obtained with no averaging (single shot), using direct detection (no phase recovery) and in the fiber point with lower SNR, which clearly indicates the potential of this system.. [6] [7]. [8]. [9]. [10]. [11]. [12]. X. Bao and L. Chen, “Recent progress in distributed fiber optic sensors,” Sensors (Basel), vol. 12, no. 7, pp. 8601–8639, 2012. J. Tejedor et al., “Toward prevention of pipeline integrity threats using a smart fiber-optic surveillance system,” J. Light. Technol., vol. 34, no. 19, pp. 4445–4453, 2016. J. Pastor-Graells, H. F. Martins, A. Garcia-Ruiz, S. Martin-Lopez, and M. Gonzalez-Herraez, “Single-shot distributed temperature and strain tracking using direct detection phase-sensitive OTDR with chirped pulses,” Opt. Express, vol. 24, no. 12, p. 13121, Jun. 2016. J. Pastor-Graells, H. F. Martins, A. Garcia-Ruiz, S. Martin-Lopez, and M. Gonzalez-Herraez, “Truly Linear and Dynamic Distributed Strain Sensor using intensity-only measurements,” in Advanced Photonics 2016, 2016, p. SeM3D.5. A. Garcia-Ruiz, H. F. Martins, J. Pastor-Graells, S. Martin-Lopez, and M. Gonzalez-Herraez, “Single-Shot True Distributed Strain Variation Measurements Over >10 km Using Phase-Sensitive OTDR with Chirped Pulses,” in Asia Pacific Optical Sensors Conference, 2016, p. Th3A.2. G. P. Agrawal, Nonlinear fiber optics. Academic Press, 2013. H. F. Martins, S. Martin-Lopez, P. Corredera, P. Salgado, O. Frazão, and M. González-Herráez, “Modulation instability-induced fading in phase-sensitive optical time-domain reflectometry,” Opt. Lett., vol. 38, no. 6, p. 872, 2013. H. Izumita, Y. Koyamada, and S. Furukawa, “The performance limit of coherent OTDR enhanced with optical fiber amplifiers due to optical nonline - Lightwave Technology, Journal of,” Lightwave, vol. 12, no. 7, pp. 1230–1238, 1994. G. Van Simaeys, P. Emplit, and M. Haelterman, “Experimental Demonstration of the Fermi-Pasta-Ulam Recurrence in a Modulationally Unstable Optical Wave,” Phys. Rev. Lett., vol. 87, no. 3, p. 33902, Jun. 2001. M. R. Fernández-Ruiz, H. F. Martins, J. Pastor-Graells, S. Martinlopez, and M. González-herráez, “Phase-sensitive OTDR probe pulse shapes robust against modulation-instability fading,” Opt. Lett., vol. 41, no. 24, pp. 5756–5759, 2016. C. G. Atkins, D. Cotter, D. W. Smith, and R. Wyatt, “Application of Brillouin amplification in coherent optical transmission,” Electron. Lett., vol. 22, no. 10, pp. 556–558, 1986. J. Bromage, “Raman Amplification for Fiber Communication Systems,” J. Light. Technol., vol. 22, no. 1, pp. 79–93, 2004.. 0733-8724 (c) 2017 IEEE. Personal use is permitted, but republication/redistribution requires IEEE permission. See http://www.ieee.org/publications_standards/publications/rights/index.html for more information..
(8) This article has been accepted for publication in a future issue of this journal, but has not been fully edited. Content may change prior to final publication. Citation information: DOI 10.1109/JLT.2017.2756558, Journal of Lightwave Technology. [13]. [14]. [15]. [16]. [17]. [18]. [19]. [20]. [21]. [22]. [23]. [24]. Z. Qin, L. Chen, and X. Bao, “Wavelet denoising method for improving detection performance of distributed vibration sensor,” IEEE Photonics Technol. Lett., vol. 24, no. 7, pp. 542–544, 2012. M. N. Alahbabi, Y. T. Cho, and T. P. Newson, “150-km-range distributed temperature sensor based on coherent detection of spontaneous Brillouin backscatter and in-line Raman amplification,” J. Opt. Soc. Am. B, vol. 22, no. 6, p. 1321, Jun. 2005. X. H. Jia, Y. J. Rao, L. Chang, C. Zhang, and Z. L. Ran, “Enhanced sensing performance in long distance brillouin optical time-domain analyzer based on raman amplification: Theoretical and experimental investigation,” J. Light. Technol., vol. 28, no. 11, pp. 1624–1630, 2010. M. A. Soto, G. Bolognini, and F. Di Pasquale, “Optimization of long-range BOTDA sensors with high resolution using first-order bi-directional Raman amplification.,” Opt. Express, vol. 19, no. 5, pp. 4444–4457, 2011. H. F. Martins, S. Martin-Lopez, P. Corredera, M. L. Filograno, O. Frazao, and M. Gonzalez-Herraez, “Phase-sensitive optical time domain reflectometer assisted by first-order raman amplification for distributed vibration sensing over >100 km,” J. Light. Technol., vol. 32, no. 8, pp. 1510–1518, 2014. Z. N. Wang et al., “Phase-sensitive optical time-domain reflectometry with Brillouin amplification,” Opt. Lett., vol. 39, no. 15, p. 4313, 2014. Z. N. Wang et al., “Ultra-long phase-sensitive OTDR with hybrid distributed amplification,” Opt. Lett., vol. 39, no. 20, pp. 5866– 5869, 2014. Y. Koyamada, M. Imahama, K. Kubota, and K. Hogari, “Fiber-optic distributed strain and temperature sensing with very high measurand resolution over long range using coherent OTDR,” J. Light. Technol., vol. 27, no. 9, pp. 1142–1146, 2009. A. Masoudi, M. Belal, and T. P. Newson, “A distributed optical fibre dynamic strain sensor based on phase-OTDR,” Meas. Sci. Technol., vol. 24, no. 8, p. 85204, Aug. 2013. H. F. Martins, S. Martín-López, P. Corredera, M. L. Filograno, O. Frazão, and M. González-Herráez, “Coherent noise reduction in high visibility phase sensitive optical time domain reflectometer for distributed sensing of ultrasonic waves,” J. Light. Technol., vol. 31, no. 23, pp. 3631–3637, 2013. J. D. Ania-Castañón and S. K. Turitsyn, “Noise and gain optimisation in bi-directionally pumped dispersion compensating amplifier modules,” 2003. E. Ip, A. Pak, T. Lau, D. J. F. Barros, and J. M. Kahn, “Coherent detection in optical fiber systems,” Electronics, vol. 16, no. 2, pp. 861–866, 2008.. Juan Pastor-Graells received the physics degree from the University of Valencia, Valencia, Spain, in 2013 and the Master’s degree in advanced electronics systems from the University of Alcala, Madrid, Spain, in 2014. Since 2013, he has been working toward the Ph.D. degree in the Photonics Engineering Group, University of Alcala, Madrid, Spain. His current research interests include nonlinear fiber optics and fiber optic sensors. Javier Nuño received the M.Eng. in Telecommunication Engineering from Universidad de Valladolid (Spain) in 2007 and the M.Sc in laser technology from the Polytechnic University of Madrid, (Spain) in 2010. Afterwards, he was working towards the Ph.D. degree (2014) at the Optics Institute “Daza de Valdés”, CSIC (Spain) with focus on experimental and theoretical understanding of ultra-long Raman lasers and Raman polarizers. In 2015, he joined the ICB (France) under the supervision of Dr. Julien Fatome. His research activities focused on the polarization control and the nonlinear pulse shaping. Currently, he is a postdoctoral research fellow at the Photonics Engineering Group at the University of Alcalá, Spain.. Maria R. Fernández-Ruiz received her M.S. degree in Electronic Systems and Signal Processing from the University of Seville, Spain, in 2011. She received her PhD degree in Telecommunications from the University of Quebec, Canada, in 2016. Currently, she is a postdoctoral research fellow at the Photonics Engineering Group at the University of Alcalá, Spain. Her research activities focus on the development of novel techniques for enhancing the performance (resolution, range) of distributed optical sensing systems, and the development of simple, energy efficient techniques for characterization of complex-envelope optical signals. Andres Garcia-Ruiz received the physics degree from the University of Salamanca (Salamanca, Spain) in 2013. He is currently working toward the Ph.D. degree in the Photonics Engineering Group (GRIFO) at the University of Alcala (Madrid, Spain). His main area of research covers distributed fiber optic sensors and he is also devoted to the development of their applications. Hugo F. Martins received his Ph.D. degree in Physics under jointly-awarded PhD program in the University of Porto, Porto, Portugal and the University of Alcala, Madrid, Spain, in 2014. His research career was mainly focused on distributed optical fiber sensing, mainly the use of phase-sensitive optical time domain reflectometry for distributed vibration/intrusions and temperature/strain detection along large structures/perimeters. Dr. Hugo F. Martins is currently the technical director at FOCUS S.L., a company specialized fiber optic distributed sensing applications. Sonia Martin-Lopez received the Ph.D. degree from the Universidad Complutense de Madrid, Madrid, Spain, in May 2006. She had a predoctoral stay at the Nanophotonics and Metrology Laboratory, Ecole Polytechnique Federale de Lausanne, Lausanne, Switzerland. She has been involved as a Postdoctoral Researcher at the Applied Physics Institute and at the Optics Institute at the Spanish Council for Research for six years. She is currently a Postdoctoral Researcher at the Photonics Engineering Group, Universidad de Alcala, Madrid, supported by the “Ramon y Cajal” program. Her current research interests include nonlinear fiber optics and distributed optical fiber sensors. Miguel Gonzalez-Herraez received the M.Eng. and D.Eng. degrees from the Polytechnic University of Madrid, Madrid, Spain, in 2000 and 2004, respectively. While working toward the D.Eng. degree, he worked first as a Research Assistant and then as a Postdoctoral Fellow in the Applied Physics Institute, Spanish Council for Research, Madrid, Spain, and had several long stays in the Nanophotonics and Metrology Laboratory, Ecole Polytechnique Federale de Lausanne, Switzerland. In October 2004, he was appointed as an Assistant Professor in the Department of Electronics, University of Alcalá, Madrid, Spain, where he was promoted to an Associate Professor in June 2006. His research interests include the wide field of nonlinear interactions in optical fibers. He is a Senior Member of the Optical Society of America.. 0733-8724 (c) 2017 IEEE. Personal use is permitted, but republication/redistribution requires IEEE permission. See http://www.ieee.org/publications_standards/publications/rights/index.html for more information..
(9)
Figure

Documento similar