Regional size, wealth and EU regional policy
15
0
0
Texto completo
(2) 128. Pavía, J. M. y Larraz, B.. 1.. Introduction. It is a fact that differences in development and wealth vary across space and that without proactive policies to reduce such differences they may even tend to increase (Ezcurra and Rapún, 2006; Polzin, 2001). Despite the European Union (EU) being one of the richest parts of the world, striking internal wealth disparities coexist among its territories. Hence, EU implements regional policy in order to reduce structural disparities between its regions. Introduced in 1988 after the adoption of the Single European Act and incorporated as a policy into the European Community Treaty itself (Articles 158 to 162) with the Maastricht Treaty in 1992, the regional policy has grown progressively over the years to become the EU’s second largest budget item, with an allocation of approximately 35.7% of the total EU budget for the period 2007-2013 (Larraz and Pavía, 2010). Structural and cohesion policies are the key instruments of EU regional policy and deal with the principal regional goal: Convergence, which will absorb almost 82% of structural funds in the period 2007-2013. The amount available under the Convergence objective is split (in 2006 prices) as follows: €199.3 billion for pure Convergence regions, €13.6 billion for «phasing-out» regions (those regions whose per capita GDP slightly surpassed 75% of the EU average due exclusively to the statistical effect of EU enlargement), and €69.6 billion, through cohesion funds, for the 15 member states where GDP is below 90% of the Community average (European Commission, 2007b, p. 25). The list of regions and areas eligible for Convergence are chosen from the NUTS-2 (Nomenclature of Territorial Units for Statistics, level 2) European regional classification, using regional gross domestic product (GDP) per inhabitant as variable of reference. Thereby, the amount of aid each country receives depends crucially on the regions the country have on the list. A list that has been modified —sometimes after drawn-out negotiations between member states and the Commission (European Commission, 2005)— several times. Examples may be found in Eurostat (2002), where the changes in NUTS classification between 1981 and 1999 are shown, or in Eurostat (2007), which presents more recent NUTS breakdowns. In order to reduce negotiations and make the classification and changes more objective, in 2003 the EU established criteria to consider a region as NUTS-2 (European Council, 2003). Despite the rules, there are still many regions that fail to fulfil the requirements and, moreover, the geo-administrative criteria followed in each country have produced a wide variety of regional sizes (in terms of both population and surface area). The issue is even more worrying due to, as the regulatory procedure itself stands, the regional breakdown being dynamic. «Amendments to the NUTS for the non-administrative units in a Member State [...] may be made if, at the NUTS level in question, the amendment reduces the standard deviation of the size in terms of population of all EU territorial units» (European Council, 2003, Art. 5.3) and besides «changes in national administrative regions lead virtually automatically to a change in the NUTS classification» (Eurostat, 2007, p. 10).. INVESTIGACIONES-23.indb 128. 8/10/12 13:19:08.
(3) Regional Size, Wealth and EU Regional Policy. 129. The aim of this article is (i) to show how sensitive the Convergence selection criterion is to the level of geographic aggregation used (assessing the impact that using a different NUTS level division would have had on the distribution of the regional budget among countries) and (ii) to warn about the risk that a dynamic NUTS-2 division may entail: a government might be tempted to restructure its regional breakdown only as a strategy to receive more funds. In this sense, this paper joins the growing literature that points towards the need to rethink current EU-wide regional development policies and the criteria followed to determine and select eligible regions for aid (e.g., Bachtler and MacMaster, 2008; Boldrin and Canova, 2001; Farole et al., 2011; Larraz and Pavía, 2010; Murias Fernández et al., 2010; Navarro et al., 2009; or, Petrakos et al., 2005). Section 2 offers more details about EU regional policy and its relationship with NUTS classifications and shows the great differences that exist, within each NUTS category, among regions. Section 3 analyses and presents the different spatial and budget distributions that would result in the 2007-2013 regional plan should a different NUTS breakdown had been used. Finally, Section 4 summarises and concludes.. 2.. The NUTS Classification and the Regional Policy. The Nomenclature of Territorial Units for Statistics was introduced by Eurostat more than forty years ago for the needs of classifying territorial structures and, nowadays, serves as a reference for the collection, development and harmonisation of Community regional statistics, for socio-economic analyses of the regions and for the framing of Community regional policies. It currently comprises a simple three-level hierarchical classification based on unified methodological principles (see Table 1), with a view to the administrative structure of each state. Each member state is subdivided into a whole number of NUTS-1 regions, each of which is in turn subdivided into a whole number of NUTS-2 regions and so on to form NUTS-3 level. Of these divisions, NUTS-2 division is the reference to distribute the EU regional budget, discarding NUTS-1 and NUTS-3 as secondary. Actually, according to Eurostat (2007, p. 10): «NUTS-1 (major socio-economic regions grouping together basic regions) should be used for analysing regional Community problems [... and] NUTS-3, which broadly comprises regions which are too small for complex economic analyses, may be used for specific analyses or to pinpoint where regional measures need to be taken» (Italics added by authors). Despite founders of EEC being most likely conscious that the benefits of the Treaty of Rome would be asymmetrically distributed, it was not until 1975 when the seeds of the present EU regional policy were planted. In its early formulation, however, a system of national quotas for the allocation of funds applied and eligible regions within each country were determined by the states. In 1988 —after the accession of Greece, Spain and Portugal, the adoption of the single market programme, and the entering into force in 1987 of the Single European Act— the European Council (1988) decided to significantly increase Structural Funds and to establish a real. INVESTIGACIONES-23.indb 129. 8/10/12 13:19:08.
(4) 130. Pavía, J. M. y Larraz, B.. European regional policy that, using (former regional European commissioner) Hübner’s words (2008, pp. 2-3), «is the market “visible hand” which aims at balanced and sustainable development while fostering economic integration throughout the EU as a whole.» NUTS classifications have been used in EU legislation since 1988, although it was in 2003 when a regulation on NUTS was adopted as a part of the process to adapt EU regional policy to the enlargement towards the East of Europe. According to the regulation, the NUTS level in which a given class of administrative units in a member state must be established is determined using the population thresholds given in Table 1. These thresholds must in turn be used as a reference to constitute, by aggregating an appropriate number of existing smaller contiguous administrative units, a given level of NUTS in those countries where no administrative units of a suitable scale exist (European Council, 2003, Art. 3). Table 1. Population Thresholds to Define EU NUTS Levels Level. Minimum Population. Maximum Population. NUTS-1. 3 million. 7 million. NUTS-2. 800,000. 3 million. NUTS-3. 150,000. 800,000. Source: Own elaboration from European Council (2003).. Formally, the legal framework for the geographical division of the territory of the European Union was introduced to establish clear rules for future amendments that could manage in the smoothest possible way the impacts of changes in the administrative structures of the member states, and in order to gain comparable data, mainly economic, on the areas, harmonising the collection, transmission and publication of regional statistics «so that all operators in the single market can be provided with comparable statistical data» (European Council, 2003, p. 1). Some important differences in the NUTS categories however remain. Despite the aim of ensuring that regions of comparable size appear at the same NUTS level, each level contains regions that differ greatly in terms of area, economic strength, administrative powers, and even population.. Indeed, the fact that according to the normative the actual political, administrative and institutional situation of each country must be respected along with the wide margins and the great flexibility that the rules impose to constitute non-administrative units —which must reflect economic, social, historical, cultural, geographical or environmental circumstances (European Council, 2003)— have permitted large differences in the three levels, both among and within countries. Focusing on level two, Figure 1 shows that regions vary enormously in terms of population size, despite NUTS-2 average populations of all member states falling within thresholds. This undoubtedly contrasts the goal of ensuring impartiality to compile and use comparable regional statistics to consequently distribute the EU regional budget.. INVESTIGACIONES-23.indb 130. 8/10/12 13:19:08.
(5) Regional Size, Wealth and EU Regional Policy. 131. Figure 1. Box and Whisker Plots: Regional Population (average 2000-2002) at NUTS-2 *. 6 mill. 5 mill. 4 mill.. *. 3 mill.. *. 2 mill. 1 mill. 0. AT BE BG CZ DE ES FI FR GR HU IT NL PL PT n=9 n=11 n=6 n=8 n=41 n=19 n=5 n=26 n=13 n=7 n=21 n=12 n=16 n=7. RO n=8. SE SK UK n=8 n=4 n=39. Note: The centre lines of the boxes indicate the country mean of the NUTS-2 regional population distribution; the lower and upper ends of the boxes are the 25th and 75th percentiles, respectively; the whiskers extend from the lower and upper ends of the box to cover the entire range of the population distributions, except for points deemed outliers, which are individually indicated by stars. The two horizontal lines at 0.8 and 3 million indicate NUTS 2 thresholds, and n represents the number of NUTS-2 regions in each country. Source: Own elaboration using data from Eurostat.. 3.. Regional Size and Convergence Funds. It is well-known that the results of any regional analysis depend on the scale of spatial (and/or temporal) aggregation used and on the specific variables considered. Regarding the second issue, GDPpc in PPS (per capita gross domestic product measured in purchasing power parities) has been the variable employed by European authorities to select eligible regions since EU regional policy was established. Under the hypothesis that convergence in GDPpc implies real convergence among EU citizens, the cohesion policy focuses upon helping those regions where development is lagging behind. From 2007 to 2013, the regions targeted by the Convergence objective are those whose GDPpc in PPS is less than 75 per cent of average GDPpc in the EU-25 for the period 2000 to 2002. Additionally, those regions where GDPpc exceeds 75 per cent due solely to the statistical effect of the EU enlargement from EU-15 to EU-25 (called «phasing-out» regions; which GDPpc falls between 75 per cent and 82.2 per cent) will also receive significant amounts of aid. NUTS-2 is employed as a basis for distributing cohesion funds, using eligible population, regional and national prosperity, and unemployment as variables for calculating the financial amounts corresponding to each country (European Council, 2006a). Of these indicators, population figures seem to be the most important ingredient. On one hand, there is a correlation of 0.90 between Convergence funds assigned to each country and the total population the country has in Convergence regions. On the other hand, this figure escalates to 0.98 for «phasing-out» regions. Thus, populations in aided regions could be used as an indicator to assess the impact. INVESTIGACIONES-23.indb 131. 8/10/12 13:19:08.
(6) 132. Pavía, J. M. y Larraz, B.. that the use of a different NUTS division would have on the distribution of the regional budget among countries. Figures 2, 3, and 4 display on the map the different solutions that would have been obtained if either the NUTS-1, NUTS-2 or NUTS-3 classifications had been used to select eligible regions for aid and Table 2 contains the population sizes that each country would have registered in Convergence and «phasing-out» regions. The first two categories in Figures 2, 3 and 4 contain the regions that fulfil the condition of having a GDPpc less than 75 per cent of EU-25 average GDPpc over the period 2000-2002. Those regions whose GDPpc surpassed the 75 per cent limit as a result of the enlargement statistical effect are displayed in the third group (interval 75-82.2). The fourth category includes the rest of regions whose GDPpc is under the EU-25 average. The remaining three categories comprise the regions whose GDPpc exceed the EU-25 average. As can be easily observed by comparing Figures 2, 3 and 4, the method of selecting regions for funding is quite sensitive to the scale of geographic aggregation used. Figure 2. Regional Classification of the EU-27 at NUTS-1 through GDPpc in PPS. Source: Own elaboration using data from Eurostat. ©EuroGeographics Association for the Administrative boundaries; Cartography: Eurostat - GISCO, 07/2009.. INVESTIGACIONES-23.indb 132. 8/10/12 13:19:08.
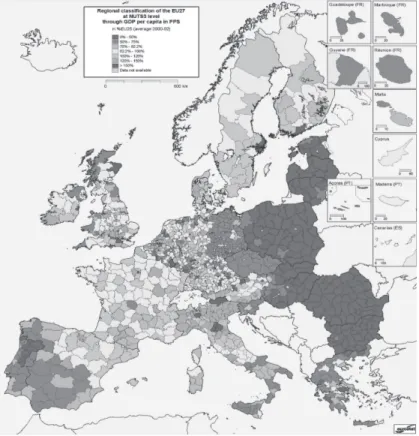
(7) Regional Size, Wealth and EU Regional Policy. 133. Figure 3. Regional Classification of the EU-27 at NUTS-2 through GDPpc in PPS. Source: Own elaboration using data from Eurostat; ©EuroGeographics Association for the Administrative boundaries; Cartography: Eurostat - GISCO, 07/2009.. For instance, the GDPpc of the county of Cornwall and the Isles of Scilly, a NUTS-2 region integrated into the British region of South West, is less than 75% of the UE-25 average (see Figure 2), while the GDPpc of South West (NUTS-1) amounts to more than 100% (see Figure 3). On the other hand, the GDPpc of the Spanish region of Castile-Leon (a NUTS-2 region) exceeds 75% (see Figure 4), whereas in one of its provinces, Zamora (NUTS-3), the GDPpc is only 66.9% of EU-25 average. Indeed, if (instead of NUTS-2 division) NUTS-3 breakdown were used as a reference, some significant changes would be obtained, primarily in the former EU-15 countries. In population-aggregated terms, the cases of Germany and UK, where some of the major differences would have occurred, figure prominently (Table 2). For instance, if NUTS-3 division were used, Germany would have almost six million more people in Convergence regions and approximately one additional million in «phasing-out» regions; while UK would have 60% more people in Convergence regions and 2,100% more in «phasing-out» regions. Likewise, Belgium and Austria, with no Convergence. INVESTIGACIONES-23.indb 133. 8/10/12 13:19:09.
(8) 134. Pavía, J. M. y Larraz, B.. Figure 4. Regional Classification of the EU-27 at NUTS-3 through GDPpc in PPS. Source: Own elaboration using data from Eurostat; ©EuroGeographics Association for the Administrative boundaries; Cartography: Eurostat - GISCO, 07/2009.. regions under NUTS-2, would have 1,524 and 468 thousand inhabitants, distributed into twelve and four NUTS-3 regions eligible for Convergence. If NUTS-1 had been taken as reference, neither UK, Belgium nor Austria would have been received Convergence and «phasing-out» funds, while Portugal would have practically no population in Convergence regions. Almost all of Portugal’s population would be found in «phasing-out» regions. The cases of Italy and Spain also deserve some attention. With almost 17.5 million of its inhabitants in assisted regions and nearly all of them in Convergence regions, Italy would increase these figures to over 20.5 million people using NUTS-1 and would decrease its figures (in practical terms) under NUTS-3 scenario. This latter situation would also affect Spain. Spain —with around 15 million of people in assisted regions and nearly thirteen of these in Convergence regions— would reach more than 17.5 million people, if either NUTS-1 or NUTS-3 were used. However, Spain would witness a truly distinct distribution between Convergence and «phasing-out» regions. In its best alternative scenario (NUTS-3), Spain would only have 10.5 million inhabitants in Convergence regions.. INVESTIGACIONES-23.indb 134. 8/10/12 13:19:09.
(9) Regional Size, Wealth and EU Regional Policy. 135. From the previous analysis, it follows clearly that had a different spatial breakdown been used, the population in assisted regions would have been visibly different in many countries (Table 2); therefore the distribution of the budget among countries would have also changed. Table 3 offers an approximation of the distribution of the amount of convergence and phasing-out funds that each country would receive under the different EU NUTS divisions. These new allocations of funds has been obtained under the hypothesis that amounts assigned to Convergence and «phasingout» regions would have maintained constant at their current levels. This hypothesis seems quite reasonable for Convergence funds since the total population located in Convergence regions is fairly stable at approximately 145 million under the three NUTS classifications. For the budget devoted to «phasing-out» regions, this assumption could nevertheless be debatable. In NUTS-1 and NUTS-3 scenarios, the change would have entailed a significant increment of the population living in the areas classified as «phasing-out»: a growth of almost 50% under NUTS-1 and around 150% with NUTS-3. This fact undoubtedly suggests that, in these cases, more funds could have been assigned to the transitional support system, especially under NUTS-3. Nonetheless, taking into account the residual character of this part of the budget and the fact that it will disappear in the next period, we have considered it appropriate to follow the same criterion fixed for Convergence funds and to maintain constant the total «phasing-out» budget. In particular, the allocation of funds that would be assigned to each country under each scenario has been obtained, working out independently to allocate Convergence and phasing-out funds, assuming a linear relationship without an intercept between funds and population. A per capita allocation for each country has been computed by dividing the funds actually assigned to the country and the total inhabitants the country has in each kind of eligible regions. To those countries that have no aid under NUTS-2, the average of per capita allocations has been used as their per capita allocation. Then, by multiplying the per capita allocations and the corresponding number of persons in each kind of assisted regions, initial financial amounts were assigned to each country. These initial figures were adjusted proportionally to fulfil the requirement of the Convergence and «phasing-out» budgets constancy. Their sums are the figures reported in Table 3. As expected, relatively significant changes would be observed in countries that feature larger population variations. Had NUTS-3 been used as reference, Austria would have increased its resources by more than 387% and Belgium would have received 239% more funds (more than €2,000 million allocated to its twelve new NUTS-3 Convergence regions and simultaneously decreasing by almost 90% in phasing-out funds). The United Kingdom would increase its Convergence aids by more than 60% and its total resources by over 113%. France and Germany would increase their total funds by almost 65% and 31%, respectively. On the contrary, Malta and Slovenia would experience fund decreases of 66% and 28%, respectively; and, Greece and Italy would each witness their EU regional transfer decreasing by almost 20%. On the other hand, if NUTS-1 were used, UK, Belgium, Austria and Portugal would be most negatively impacted, whereas Italy —followed by the Czech Repu. INVESTIGACIONES-23.indb 135. 8/10/12 13:19:09.
(10) 136. Pavía, J. M. y Larraz, B.. Table 2. Population under Convergence and Phasing-Out Objectives by Country under the Different NUTS Levels (thousands of people, average 2000-2002) Population Country. Convergence. Phasing-Out. NUTS-1. NUTS-2. NUTS-3. NUTS-1. NUTS-2. NUTS-3. Austria (AT). 0. 0. 468. 0. 277. 740. Belgium (BE). 0. 0. 1,524. 0. 1,280. 314. Bulgaria (BG). 7,719. 7,719. 7,719. 0. 0. 0. 0. 0. 0. 0. 0. 0. 10,232. 9,063. 9,063. 0. 0. 0. 0. 0. 0. 0. 0. 0. Cyprus (CY) Czech Republic (CZ) Denmark (DK) Estonia (EE). 1,367. 1,367. 1,367. 0. 0. 0. Finland (FI). 0. 0. 0. 0. 0. 450. France (FR). 1,724. 1,724. 1,847. 0. 0. 4,528. 13,786. 10,422. 16,257. 0. 5,041. 6,061. Greece (GR). 5,955. 4,018. 4,410. 4,997. 6,075. 4,598. Hungary (HU). 7,354. 7,354. 8,441. 0. 0. 0. 0. 0. 0. 0. 0. 0. 20,644. 16,807. 11,994. 0. 602. 6,201. Latvia (LV). 2,356. 2,356. 2,356. 0. 0. 0. Lithuania (LT). 3,483. 3,483. 3,483. 0. 0. 0. 0. 0. 0. 0. 0. 0. 393. 393. 31. 0. 0. 362. 0. 0. 154. 0. 0. 0. 38,245. 38,245. 35,974. 0. 0. 0. 238. 6,992. 6,116. 9,818. 387. 1,983. Romania (RO). 22,219. 22,219. 22,219. 0. 0. 0. Slovakia (SK). 5,398. 4,792. 4,792. 0. 0. 0. Slovenia (SI). 1,992. 1,992. 1,397. 0. 0. 104. Spain (ES). 8,571. 12,812. 10,467. 9,569. 2,333. 7,173. Sweden (SE). 0. 0. 0. 0. 0. 0. United Kingdom (UK). 0. 2,353. 3,762. 0. 368. 8,139. 143,956. 146,393. 144,131. 24,383. 16,363. 40,653. Germany (DE). Ireland (IE) Italy (IT). Luxembourg (LU) Malta (MT) Netherlands (NL) Poland (PL) Portugal (PT). European Union. Source: Own elaboration using data from Eurostat.. INVESTIGACIONES-23.indb 136. 8/10/12 13:19:09.
(11) Regional Size, Wealth and EU Regional Policy. 137. Table 3. Budget Allocated for Convergence and Phasing-Out Objectives by Country under the Different EU NUTS Levels Breakdowns (million EUR period 2007-2013) Country. % of Variationb. Budget Allocationa NUTS-1. NUTS-2. NUTS-3. NUTS-1. NUTS-3. Austria. 0. 177. 863. –100.00. 387.57. Belgium. 0. 638. 2,164. –100.00. 239.18. Bulgaria. 4,622. 4,391. 4,426. 5.26. 0.80. 0. 0. 0. 20,278. 17,064. 17,199. Cyprus Czech Republic Denmark. — 18.83. 0.79. 0. 0. 0. Estonia. 2,370. 2,252. 2,270. Finland. 0. 0. 180. 3,359. 3,191. 5,254. 5.26. 64.65. Germany. 16,519. 16,079. 21,026. 2.74. 30.77. Greece. 18,615. 15,878. 12,709. 17.24. –19.96. Hungary. 14,997. 14,248. 16,484. 5.26. 15.69. France. Ireland. —. —. 5.24 —. — 0.80 —. 0. 0. 0. —. —. 27,423. 21,641. 17,331. 26.72. –19.92. Latvia. 3,148. 2,991. 3,015. 5.25. 0.80. Lithuania. 4,705. 4,470. 4,505. 5.26. 0.78. 0. 0. 0. 585. 556. 189. 0. 0. 211. 46,710. 44,377. 42,073. 5.26. –5.19. Portugal. 5,857. 17,413. 15,777. –66.36. –9.40. Romania. 13,327. 12,661. 12,761. 5.26. 0.79. Slovakia. 8,315. 7,013. 7,069. 18.57. 0.80. Slovenia. 2,830. 2,689. 1,943. 5.24. –27.74. 19,617. 22,637. 19,616. –13.34. –13.35. Sweden. 0. 0. 0. United Kingdom. 0. 2,912. 6,214. European Union. 213,278. 213,278. 213,278. Italy. Luxembourg Malta Netherlands Poland. Spain. — 5.22 —. — –100.00 —. — –66.01 —. — 113.39 —. Source: Own elaboration using data from Eurostat and European Commission (2007b, p. 25). a : Indicative allocation 2007-13 (2007 current prices in millions of euro). b : Variation in percentage compared to the actual (NUTS-2) allocation of funds.. INVESTIGACIONES-23.indb 137. 8/10/12 13:19:09.
(12) 138. Pavía, J. M. y Larraz, B.. blic, Slovakia, and Greece—would benefit most significantly (Table 3). In this scenario, none of the first three countries mentioned above would have Convergence and «phasing-out» regions and Portugal would lose a very significant fraction, two-thirds, of its aid transfers. On the other side, Italy and the Czech Republic, Slovakia, and Greece would experience the largest rates of growth, with Germany total balance remain nearly unchanged after increasing its allocation in convergence regions by nearly 40% and losing its phasing-out resources. To conclude the analysis in relative terms, it is useful to compare the cases of Spain and Hungary with those of the Baltic Republics, Bulgaria and Poland. For Spain, NUTS-2 provides it with the most funding as a whole, as the other two scenarios would cause reductions in its current resources of at least 13%; whereas Hungary would experience approximately a 5% increase in transfers under NUTS-1, and a 16% increase under NUTS-3. The Baltic Republics, Bulgaria and Poland would experience little change. In absolute terms, if NUTS-3 were adopted, the most negatively affected countries would be those that have benefitted greatly from the cohesion policy during the former plans along with Poland (the country that will receive the large amounts under the current plan). Italy, Greece, Spain, Poland and Portugal would receive as a whole less than 14,400 million, with a maximum reduction for Italy (4,310) and a minimum decrease for Portugal, 1,636. On the other side, Germany, UK, Hungary, France, and Belgium would be most significantly favoured, with increases that range from almost 5,000 additional million for Germany to 1,500 million for Belgium. Likewise, if NUTS-1 were employed, Portugal would be by a large margin the country that would suffer most greatly: its total funds would be reduced by over 11,500 million. Spain and UK would also experience significant changes, each with reductions of approximately 3,000 million. Conversely, countries that would benefit from the new share-out would be Italy (5,780 million euro), the Czech Republic (3,214), Greece (2,737), Poland (2,333), and Slovakia (1,302).. 4.. Discussion. Although the European Union is comprised of some the richest areas of the world, significant internal wealth disparities persist among its territories. Consecutive EU enlargement processes have led to constant increases in regional differences, and the entry of 12 new member countries since 2004 has widened these disparities. In order to reduce gaps, EU implements its regional policy mainly through Convergence. The Convergence objective seeks to promote growth for the least-developed EU member states and regions. In EU-27, this objective affects —among 17 countries— 84 regions with a total population of approximately 146 million, whose GDPpc is less than 75 per cent of the EU-25 2000-2002 average, and another 16 regions with 16.4 million inhabitants, where GDPpc is only slightly above the threshold, due to the EU-15 enlargement statistical effects. The above figures and the funds each country receives, however, are quite sensitive to the scale of EU regional breakdown used and to how. INVESTIGACIONES-23.indb 138. 8/10/12 13:19:09.
(13) Regional Size, Wealth and EU Regional Policy. 139. each member state has divided its territories. For example, UK would receive neither Convergence nor «phasing-out» funds, if NUTS-1 was taken as reference, when it would receive more than twice the amount of its current resources under NUTS-3. Likewise, if the NUTS-2 division in vigour during the early 1990s in UK —which would still verify the conditions imposed by the EU regulation introduced in 2003— had been employed in the 2007-2013 plan, UK would feature neither convergence nor «phasing-out» regions. Thus, because the main criterion used to calculate the funds each member state receives is total population in aid regions, there is a real risk that a government might be tempted to restructure its regional breakdown as a strategy to receive more funds. It is therefore necessary to raise the issue in order to rethink current EU-wide regional development policies and to establish more robust criteria to select funding areas. In that sense, looking back today on the first 20 years of EU Cohesion policy, we think that the reforms should evolve in the direction of reinforcing the merits already achieved, involving more socioeconomic variables in the criteria of regional eligibility and allocating resources more appropriately. Using a single indicator as a selection variable makes the spatial breakdown effect more important than under a selection criterion based on an array of indicators. It is quite likely that the spatial variation within any territory will be higher when one sole variable is used rather than when the selection is based on a set of variables (Voas and Williamson, 2001). Likewise, it is vital to determine which plans should receive funding priority in each region accor ding to its particular shortcomings and potentialities (Foray et al., 2009). Identifying the regions in most need, involving local institutions, and imposing common management, control and evaluation standards are some of the goals already attained. They have contributed to the creation of a truly appealing structure of multi-level governance, which evolved from a governance system dominated by national level decisions to a structure where «regions were heralded as central players [...] both as implementers of policy measures and as “bridges” between the EU and the local level» (Regional Innovation Monitor, 2011, p. 10), although with great asymmetries by countries. Thus, the use of NUTS-3 as reference would further achieve: approaching the decision centres to citizens, making it easier to take actions that correlate with their real concerns; reducing the volatility of using a unique variable for eligibility; more closely approaching to the objective of involving regional and local authorities in the design and delivery of structural fund programs; and, increasing the profile and influence of regional and local actors in economic development. Although, it would also result in a loss of the vision of a more complete picture that a larger scale offers, a probably establishment of new institutions, and an increase in the differences among countries in the varying levels of subnational participation in the management and delivery of structural funds because, as it is well-known, the institutional structures of regions and the subnational distribution of competences vary greatly among the different member states, reflecting country size, administrative structures, and political factors (Baumert, 2006, Ch. 2).. INVESTIGACIONES-23.indb 139. 8/10/12 13:19:09.
(14) 140. Pavía, J. M. y Larraz, B.. References Bachtler, J., and McMaster, I. (2008): «EU cohesion policy and the role of the regions: Investigating the influence of structural funds in the new member states», Environment and Planning C: Government and Policy, 26, 398-427. Baumert, T. (2006): Los determinantes de la innovación: un análisis aplicado sobre las regiones de la Unión Europea, PhD Dissertation, Madrid: Universidad Complutense. Boldrin, M., and Canova, F. (2001): «Inequality and convergence in Europe’s regions: Reconsidering European regional policies», Economic Policy, 16, 207-253. European Commission (2005): Communication from the Commission to the European Parliament and the Council on the appropriateness of establishing rules on a Europe-wide basis for more detailed levels in the NUTS classification, Commission of the European Communities, Brussels, 6 October 2005, COM(2005) 473, final. European Commission (2007a): Growing Regions, Growing Europe, Office for Official Publications of the European Communities, Luxemburg: European Commission. European Commission (2007b): Cohesion Policy 2007-2013, Commentaries and Official Texts, Office for Official Publications of the European Communities, Luxemburg: European Commission. European Council (1988): «Council Regulation (EEC) No 2052/88 of 24 June 1988 on the tasks of the structural funds and their effectiveness and on coordination of their activities between themselves and with the operations of the European Investment Bank and the other existing financial instrument», Official Journal of European Communities, L185, 15 July 1988, 9-20. European Council (2003): «Regulation (EC) No 1059/2003 of the European Parliament and of the Council of 26 May 2003 on the establishment of a common classification of territorial units for statistics (NUTS)» Official Journal of the European Union, L154, 21 June 2003, 1-41. European Council (2006a): «Council Regulation (EC) No 1083/2006 of 21 July 2006 laying down general provisions on the European Regional Development Fund, the European Social Fund and the Cohesion Fund», Official Journal of the European Communities, L210, 31 July 2006, 25-78. European Council (2006b): «Consolidated versions of the Treaty on European Union and of the Treaty establishing the European Community», Official Journal of the European Union, C321, 29 December 2006, 1-331. Eurostat (2002): European Regional Statistics Changes in the NUTS Classification 1981-1999, Office for Official Publications of the European Communities, Luxemburg: European Commission. Eurostat (2007): Regions in the European Union. Nomenclature of Territorial Units for Statistics. NUTS 2006/EU-27, Office for Official Publications of the European Communities, Luxemburg: European Commission. Ezcurra, R., and Rapún, M., 2006, «Regional disparities and national development revisited», European Urban and Regional Studies, 13, 355-369. Farole, T.; Rodríguez-Pose, A., and Storper, M. (2011): «Cohesion policy in the European Union: growth, geography, institutions», JCMS: Journal of Common Market Studies, 49, 1089-1111. Foray, D.; David, P. A., and Hall, B. (2009): «Smart specialisation: The concept», Knowledge Economists Policy Brief, 9, June 2009. Hübner, D. (2008): «Regions matter», Inforegio Panorama, 26, 2-5. Larraz, B., and Pavía, J. M. (2010): «Classifying regions for European development funding», European Urban and Regional Studies, 17, 1-7.. INVESTIGACIONES-23.indb 140. 8/10/12 13:19:09.
(15) Regional Size, Wealth and EU Regional Policy. 141. Murias Fernández, P.; Martínez Roget, F., and Novello, S. (2010): «Bienestar económico regional: un enfoque comparativo entre regiones españolas e italianas», Investigaciones Regionales, 18, 5-36. Navarro, M.; Gibaja, J. J.; Bilbao-Osorio, B., and Aguado, R. (2009): «Patterns of innovation in EU-25 regions: A typology and policy recommendations», Environment and Planning C: Government and Policy, 27, 815-840. Petrakos, G.; Rodríguez-Pose, A., and Rovolis, A. (2005): «Growth, integration, and regional disparities in the European Union», Environment and Planning A, 37, 1837-1855. Polzin, P. E. (2001): «Why some states grow faster than others: New growth models for state economic policy», Growth and Change, 32, 413-425. Regional Innovation Monitor (2011): Innovation Patterns and Innovation Policy in European Regions - Trends, Challenges and Perspectives, 2010 Annual Report, Brussels: Technopolis Belgium. Voas, D., and Williamson, P. (2001): «The diversity of diversity: A critique of geodemographic classification», Area, 33, 63-76.. INVESTIGACIONES-23.indb 141. 8/10/12 13:19:09.
(16)
Figure


+2

Documento similar
Additionally, slightly negative relationship between the level of regional inequality and the level of economic development is found out regarding regional inequality within
Keywords: iPSCs; induced pluripotent stem cells; clinics; clinical trial; drug screening; personalized medicine; regenerative medicine.. The Evolution of
In addition, precise distance determinations to Local Group galaxies enable the calibration of cosmological distance determination methods, such as supernovae,
Government policy varies between nations and this guidance sets out the need for balanced decision-making about ways of working, and the ongoing safety considerations
No obstante, como esta enfermedad afecta a cada persona de manera diferente, no todas las opciones de cuidado y tratamiento pueden ser apropiadas para cada individuo.. La forma
Astrometric and photometric star cata- logues derived from the ESA HIPPARCOS Space Astrometry Mission.
The photometry of the 236 238 objects detected in the reference images was grouped into the reference catalog (Table 3) 5 , which contains the object identifier, the right
Finally, Figure 4 presents the relationship between adjusted trade and distance for intra-national flows when we use highly disaggregated geographical units as origin and
