A systematic mapping study of software development with GitHub
20
0
0
Texto completo
(2) V. Cosentino et al.: Systematic Mapping Study of Software Development With GitHub. FIGURE 1. Systematic mapping study process [5].. In this paper, we present a systematic mapping study of all papers reporting findings that rely on the analysis and mining of software repositories in GitHub. After a systematic selection and screening procedure, we ended up with a set of 80 papers that were carefully studied. Our goal was to study how software development practices have changed due to the popularization of social coding platforms like GitHub and how project owners, committers and end-users could optimize their way of collaborating. A secondary goal was to analyze different quality aspects of the empirical methods employed by the research works themselves in order to assess the representativeness and reliability of those findings. As far as we know this is the first work conducting a meta-analysis of papers reporting results based on GitHub data mining. This paper is organized as follows: Section II describes the procedure we followed in this study. Section III presents the research questions, Section IV describes the data acquisition process and Section V reports on the analysis and results obtained. Section VI presents some discussion about our findings. Section VII discusses related work and Section VIII comments on the threats to validity. Finally, Section IX concludes the paper and presents some further work. II. METHODOLOGY. To perform our mapping study we followed a procedure inspired by previous works [5], [6]. The procedure has five phases, shown in Fig. 1, namely: (1) definition of research questions; (2) conduct search, where primary studies are identified by using search strings on scientific databases or browsing manually through relevant venues; (3) screening of papers, where inclusion/exclusion criteria are applied to remove those works not relevant to answer the defined research questions; (4) classification scheme, where dimensions to classify each paper according to each research question are identified; and (5) data extraction and mapping study, where the actual data extraction takes place. We have organized these phases into three main groups (see gray boxes in Fig. 1): (1) research questions, (2) data acquisition, where we describe how we selected and screened papers (i.e., second and third phases); and (3) analysis and results, where we report on the classification employed and the resulting systematic mapping (i.e., the last two phases). This structure allows us to report on both the classification 7174. scheme and the results for each research question in the same section, which we believe improves the reading flow. Next sections describe each one of these phase groups. III. RESEARCH QUESTIONS. The main goal underlying our work is to provide an overview of research efforts focusing on the analysis of all kinds of software development practices relying on / influenced by the use of the GitHub platform as the most representative example of the current generation of software forges. This overview must be accompanied with a characterization of the empirical methods used in those analysis, the tools employed in them and the research community behind those works. Therefore, our mapping study addresses the following research questions: RQ1: What topics/areas have been addressed? Rationale: Our interest is finding out the main areas (and key topics in those areas) that have been targeted while studying how GitHub has influenced software development. RQ2: What empirical methods have been used? Rationale: Our intent here is to analyze and classify the methods commonly applied in research works around GitHub. RQ3: What technologies have been used to extract and build datasets from GitHub? Rationale: The study of GitHub generally implies first the selection and retrieval of a subset of GitHub repositories. Our goal is to catalogue the main technologies used for that purpose. RQ4: What is the research community behind these works like? Rationale: GitHub papers are published in multiple and different venues by a sizable set of researchers. Our goal is to characterize this research sub-community and the publication venues they focus on. This can help to interpret better the results of previous questions, to encourage new collaborations among isolated subgroups and to help identifying potential venues to publish new results in this area. IV. DATA ACQUISITION. This section describes the search process and the selection criteria for our mapping study. VOLUME 5, 2017.
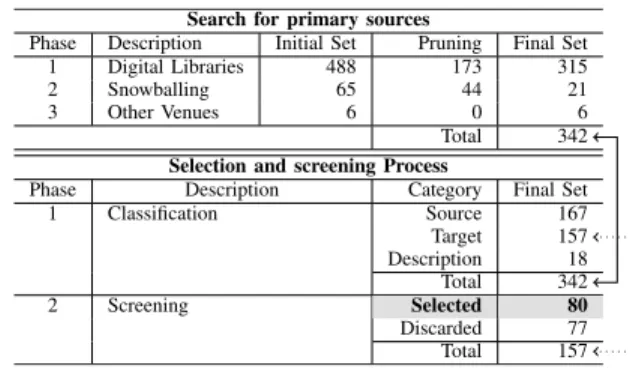
(3) V. Cosentino et al.: Systematic Mapping Study of Software Development With GitHub. A. CONDUCT SEARCH FOR PRIMARY SOURCES. The goal of this step is to build an exhaustive collection of works in the field of study. We defined a three-phased collection process in order to make the set of evaluated works as complete as possible.. 21 new papers were finally added to the collection due to snowballing. At the end of this second phase, our collection contained 336 works. TABLE 3. Selected venues.. TABLE 1. Digital libraries selected and main features provided.. The first phase consisted in selecting a set of digital libraries, defining the corresponding search queries and finally executing those. The selection of the digital libraries was driven by several factors, specifically: (1) number of works indexed, (2) update frequency, and (3) facilities to execute advanced queries and navigate the citation and reference networks of the retrieved papers. We selected 6 digital libraries (see Tab. 1) that presented a good mix of the desired factors. TABLE 2. Executed queries for each digital library.. Once the digital libraries were determined, search queries were defined to retrieve the initial selection of works to be filtered and screened later on. Table 2 shows the queries we defined for each digital library. In general, we searched for all works that contained the word GitHub (or variations of it, i.e., github, git hub) in either the title, abstract, author keywords or index terms. This resulted in a collection of 488 works (removing duplicates). To refine the search, a title/abstract pruning process was applied to discard those works which clearly were not studying GitHub itself (e.g., papers just mentioning GitHub as the platform where they were making publicly available their artifacts or research data) and therefore out of the scope of our study. The pruning process removed 173 papers. Thus, we ended up this first phase with 315 works. The second phase took the previous set and performed a breadth-first search using backward and forward snowball methods by navigating their citations and references. To this aim, citation and reference networks provided by the digital libraries were used (when possible, otherwise we followed a manual approach). Each new work found was then used in turn to identify subsequent new ones. We collected 65 additional papers as a result of this phase, to which we also applied a title/abstract pruning process. As a result, only VOLUME 5, 2017. In the third phase, an edition-by-edition (or issue-by-issue) manual browsing of the main conference proceedings and journals was performed. The goal of this phase was to complete the list of the initial works and also assess the completeness of the selection obtained so far. We selected 24 venues in total (16 conferences and 8 journals, shown in Tab. 3) from January 2009 until July 2016. This phase identified 6 new works. Again, we applied a title/abstract pruning process but no work was discarded so the 6 works were added to our collection. TABLE 4. Number of works considered in the search and selection/screening processes.. At the end of the search process we obtained a total of 342 works, 92.10% coming from the first phase, 6.14% from the second one and 1.76% from the third phase. The upper part of Tab. 4 summarizes the number of works initially collected, pruned and eventually selected in each phase of this process. B. SELECTION CRITERIA AND SCREENING. Next, we applied a two-phased selection process in order to determine which works were considered relevant to answer our research questions. 7175.
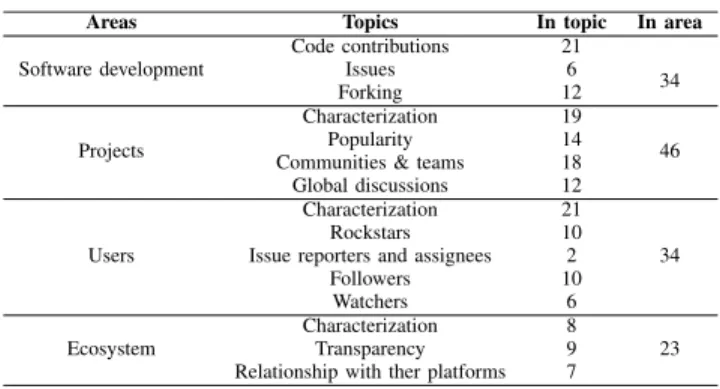
(4) V. Cosentino et al.: Systematic Mapping Study of Software Development With GitHub. First, the collected works were classified into three dimensions according to how they used GitHub. •. •. •. Papers using GitHub simply as a ‘‘project warehouse’’ to draw repositories from were classified as source, as they relied on GitHub just as a source of repositories and did not benefit or study any specific GitHub feature (i.e., the paper would be the same if instead of GitHub projects had been stored in file folders in a server). Papers analyzing how software projects were using GitHub features were classified as target, as the GitHub platform itself was the main object of study. Works studying GitHub as part of a comparative studies on open-source development environments and platforms (GitHub was studied but only in relationship to other platforms and therefore it was not the main object of study) were classified as description.. In total we found 167 source papers, 157 target papers and 18 description papers. In our study we are interested in those works classified as target, as they are the ones that aim to provide insights on how the platform and its characteristics are being used in software development. These target papers were the input of the subsequent screening process. At this point, we discarded the following groups of papers as we considered irrelevant for this particular study: •. •. •. • •. Papers studying the use of GitHub in non-software development projects (e.g., education [7], collaboration on text documents [8], [9], open government practices [10], for replicability of scientific results [11]). Papers analyzing niche technologies (e.g., development and distribution of R packages [12], adoption of database frameworks in Java projects [13]) due to the challenge of generalizing those results to any kind of software project. Papers subsumed by another paper from the same authors presenting more complete results. In those cases we only kept the extended version. Papers not written in English, masters and PhD thesis. Papers that rely on GitHub to evaluate new algorithms or tools (e.g., recommenders [14], [15], predictors [16], [17]). Although the algorithms/tools are related to a GitHub feature, the papers use GitHub like a validation platform.. After running the screening process according to this criteria, we retained 80 and discarded 77 of the papers.3 The bottom part of Tab. 4 shows the number of works classified and screened during these phases. V. ANALYSIS AND RESULTS. In the following we address each research question and end the section performing a cross-analysis among them. 3 The full list of collected and selected/discarded papers is available at https://github.com/SOM-Research/github-selection. 7176. A. RQ1: WHAT TOPICS/AREAS HAVE BEEN ADDRESSED?. In this section we summarize the main findings reported by the selected works, grouped in topics and areas of research interest to get a better overview of what the contributions of those papers are and what we can learn from them. To classify the papers we applied a grounded theory approach to analyze those findings. First, each paper was labeled with an identifier and analyzed to summarize its main findings . We then performed open coding on such findings with the purpose of assigning them to specific topics. Finally, we grouped the topics conceptually similar, resulting into four main areas of research, focused on: (1) development, (2) projects, (3) users and (4) the GitHub ecosystem itself. Topic identification was based on the common terminology employed around the field of software forges, with special attention to specific vocabulary linked to GitHub features and development model. As a web-based hosting service for collaborative development projects using the Git control system, projects and users can be considered the main assets of the platform. Each project keeps track of the submitted issues, pull requests and commits, which are therefore other potential topics of study. Pull requests are the main means to contribute to a project. To create a pull request, the user has first to fork a project, and once her changes have been completed, send the pull request to the original project asking for those changes to be integrated (i.e., ‘‘pulled’’) in the project. GitHub also supports social features like followers and watchers which have been also the topic of study for some research works. TABLE 5. Distribution of works across the areas of interest and topics.. Table 5 summarizes the paper distribution along the 4 areas of research interest and the corresponding topics. Note that some works may report findings for different topics and areas at the same time and therefore the total number is higher than the size of our paper collection set. The software development area contains findings about code contributions, issues and forking. The project area includes findings about the different types of project in GitHub, their popularity, communities and teams in them and the characterization of the discussions that may arise in the community during the development. The third area reports findings about different types of users, such as popular users (i.e., rockstars), issue reporters and assignees, watchers and followers. The last area VOLUME 5, 2017.
(5) V. Cosentino et al.: Systematic Mapping Study of Software Development With GitHub. contains findings about the GitHub ecosystem, such as its characterization, transparency, and the relations with other platforms (e.g., Twitter, StackOverflow). With regard to areas, findings concerning projects (46) overtake those about software development (34), users (34) and platform (23). On the topic side, the ones that have received more attention concern code contributions (21) and general findings about users (21). Next sections report on the findings according to the areas of interests and topics identified. 1) SOFTWARE DEVELOPMENT - CODE CONTRIBUTIONS a: CONTRIBUTIONS ON THE PLATFORM ARE UNEVENLY DISTRIBUTED. Most code contributions are highly skewed towards a small subset of projects [18], [19], exhibiting a power-law distribution. b: FEW DEVELOPERS ARE RESPONSIBLE FOR A LARGE SET OF CODE CONTRIBUTIONS. Avelino et al. report that most projects have a low truck factor4 (i.e., between 1 and 2), meaning that a small group of developers is responsible for a large set of code contributions [20]. A similar finding is reported also by other works, Kalliamvakou et al. [21] claim that more than two thirds of projects have only one committer (the project’s owner). Pinto et al. [22] note that a large group of contributors is responsible for a long tail of small contributions, while Yamashita et al. [23] acknowledge that the proportion of code contributions does not follow the Pareto principle,5 on the contrary, a larger number of contributions is made by few developers. c: MOST CONTRIBUTIONS COME IN THE FORM OF DIRECT CODE MODIFICATIONS. A code contribution can be made either directly (pushed commits) or indirectly (pull requests). The former are exclusively performed by developers granted write permission on the project, while the latter can come from anyone. Most code contributions are performed by direct code modifications [24]. d: PULL REQUESTS’ CHARACTERIZATION. Most pull requests are less than 20 lines long, processed (merged or discarded) in less than 1 day and the discussion spans on average to 3 comments [24]. Furthermore, they are evaluated using manual and automatic testing as well as code reviews [25]. e: IMPORTANCE OF CASUAL CONTRIBUTIONS. A specific type of pull request is defined as ‘‘drive-by’’ commits [26] or casual contributions [22]. According to [24], 4 The truck factor is a measurement of the concentration of information in individual team members. It connotes the number of team members that can be unexpectedly lost from a project before the project collapses due to lack of knowledgeable or competent personnel. 5 The Pareto principle or the so-called ‘‘80-20 rule’’ states that 80% of the contributions are performed by roughly 20% of the contributors VOLUME 5, 2017. casual contributions account for 7% of the pull-requests made to GitHub projects in 2012, and a more recent study [22] reports that casual contributions are rather common in GitHub (48.98%), and even if a significant proportion of them are minor fixes (e.g., typos and grammar issues), other ones are far from being trivial (e.g., fixing bugs and adding new features). f: TECHNICAL FACTORS TO ACCEPT PULL REQUESTS. Some works have identified technical factors that influence on the acceptance (or rejection) of an indirect code contribution. Pull requests fully addressing the issue they are trying to solve, self contained and well documented [25] as well as including test cases [27], [28] and efficiently implemented [29] are more likely to be accepted, since they come with enough means to ease their comprehension and to assess their quality. In addition, pull requests targeting relevant project areas or recently modified code [24], [30], fixing known project bugs, updating only the documentation [31] or easily verifiable [32] have also higher probability to get accepted, since they have higher priority or are simpler to check. g: TECHNICAL FACTORS TO REJECT PULL REQUESTS. On the contrary, pull requests containing unconventional code (i.e., code not adhering to the project style) [24], [33], suggesting a large change [34], introducing a new feature, or conflicting with other existing functionality [32] are less likely to go through. h: SOCIAL FACTORS TO ACCEPT PULL REQUESTS. Social factors also influence the acceptance of pull requests [27], [28], [34], [35]. Contributions from submitters with prior connections to core members, having stronger social connection (e.g., number of followers) or holding a higher status in the project are more likely to be accepted [27], [28], [35]. In particular, Soares et al. report that contributions made by members of the main team increase in 35% the probability of merge and when a developer has already submitted a pull request before, his or her contribution has 9% more chance of being merged [34]. i: SOCIAL FACTORS TO REJECT PULL REQUESTS. A pull request from an external collaborator have 13% less chance of being accepted, and if it is the first contribution to the project, the chance of merge is decreased in 32% [34]. Also, contributions sent to popular, well-established (i.e., mature) projects or with a high amount of discussion are less likely to be accepted [27], [33]. j: GEOGRAPHICAL FACTORS TO ACCEPT PULL REQUESTS. When submitters and integrators are from the same geographical location there is 19% more chances that the pull requests will get accepted [36]. This is due to the fact that in general integrators (i) perceive that it easy to work with submitters 7177.
(6) V. Cosentino et al.: Systematic Mapping Study of Software Development With GitHub. from the same geographical location and (ii) encourage submitters from their geographical location to participate [36]. k: PULL REQUEST EVALUATION TIME. The latency of processing pull requests has been discussed in different works. Complex and large pull requests, arising long discussions, undergoing code review processes, touching key parts of the system or having low priority are associated with longer evaluation latencies [24], [30], [37]. Also pull requests from unknown developers undergo a more thorough assessment, while contributions from trusted developers are merged right away [26]. Note that the increase in the time needed to analyze a pull request reduces the chances of its acceptance [34]. Moreover, Yu et al. report also that a minor impact on the evaluation time is due to pull requests submitted outside ‘‘business hours’’ and on Friday and missing links to the issue reports [37]. On the other hand, pull requests submitted by core team members, contributors with more followers, more social connections within the project, and higher previous pull request success rates are associated with shorter evaluation latencies. Also the use of @-mention (to ping other developers) and code reviews help reducing the evaluation time. In particular, two works report that even if @-mention is not widely used in pull requests, pull requests using @-mention tags tend to be processed quicker [37], [38]. 2) SOFTWARE DEVELOPMENT - ISSUES a: ISSUES TRACKER ARE SCARCELY USED. Even if issue trackers are only explicitly disabled in 3.8% of the projects, 66% of the projects do not actually use them [39]. b: FEW PROJECTS ATTRACT MOST OF THE ISSUES. Issues are unevenly distributed on the projects that actively use the GitHub issue tracker. In particular, the distribution of open issues follows a power-law distribution [40]. Issues are generally sent to popular projects, with large code bases and communities [39]. c: DISTRIBUTION OF ISSUES IN A PROJECT. The number of opened issues is on average higher right after the project creation, while it tends to decrease few months later. However, the number of opened issues is stable or exhibits slightly negative trend over time. Conversely, pending issues are constantly growing [41]. d: SMALL NUMBER OF LABELS ARE USED TO TAG ISSUES. GitHub offers a label mechanism to ease the categorization of issues, however less than 30% of issues are tagged [39], [42]. The vast majority of projects that use labels, only use 1 or 2 different ones (45.53% and 25.42% respectively) [42]. The most common ones are bug, feature and documentation [39], [42]. Bug and enhancement are often used together [42]. 7178. e: ISSUE LIFETIME. Issue lifetimes are generally stable in a project [41]. In particular, the response time to address issues is generally fast. However, the older an issue is, the smaller is the chance that it will be addressed [43]. It is important to note that the size of the community behind a project does not seem to reduce the time to handle issues [39], [41]. Finally, the number of projects/developers followed by team members has a positive effect on fixing long-term bugs, not on ‘rapid response’ to user issues [43]. f: THE USE OF LABELS AND @-MENTIONS IS EFFECTIVE IN SOLVING ISSUES. The use of labels [42] and @-mentions [44] has a positive impact on the issue evolution by enlarging the visibility of issues and facilitating the developers’ collaboration, and eventually leading to an increase in the number of issues solved. However, labeled and @-mentioned issues are likely to need more time to deal with than other issues [42], [44]. 3) SOFTWARE DEVELOPMENT - FORKING a: FORKING IS UNEVENLY DISTRIBUTED. Most of the projects in GitHub are never forked [18], [21], [29], [45]. In particular, the distribution of forks follows a power-law distribution [40], [46], meaning that there are lots of projects with few forks and few projects forked a very large number of times [18]. b: FORKING AS GOOD INDICATOR OF PROJECT LIVELINESS. The number of forks of a project is positively correlated with the number of open issues, watchers [40] and stars [47], as well as with number of commits and branches [43], thus reflecting that active projects are often more popular. However, it is important to note the number of forks does not correlate with the number of pull requests accepted [48]. c: FORKS ARE MOSTLY USED TO FIX BUGS. There exist 3 kinds of forks in GitHub according to Rastogi and Nagappan. In particular, Contributing forks are those forks aimed to end up as pull requests to the forked project to integrate changes, independently developed forks are forks that do not send pull requests to the forked project but have internal commits probably deviating from the mother project; and inactive forks do neither send nor receive pull requests nor have internal commits [49]. The last two categories are the common ones, since most forks do not retrieve new updates from original projects [50]. Instead, the contributing forks can be further classified. In particular, forks are mostly used to fix bugs and add new features [46], [50], and less frequently to add documentation [46]. d: FORKING IS BENEFICIAL. Forking is considered positive for several reasons such as to preserve abandoned programs, to improve the quality of a project (e.g., adding testing and debugging), give developers VOLUME 5, 2017.
(7) V. Cosentino et al.: Systematic Mapping Study of Software Development With GitHub. control over the code base (e.g., experiments and customization of existing projects) [50] as well as submitting pull requests and making contributions to the original repositories [46]. Moreover, even if forking could also have some drawbacks, such as confusion (e.g., many instances of the same project), fragmentation (e.g., development efforts over from multiple project versions, bug-fixes not propagated) and compatibility between the forked and original projects [50], it seems this is not often the case as reported by Jiang et al. [46] (i.e., forking does not split developers into different competing and incompatible versions of repositories). e: FORKABILITY. The chances to get a project forked depends on different factors. Project where developers provide additional publicly contact information (emails and personal web site’s urls) [51], that are clearly active or with popular project’s owners [46] are more probable to be forked. Prior social connections between the project owner and the forker, an increase in developer community size for medium-size projects [49] and projects written in the forker preferred programming language can increase the chances of forking [46]. 4) PROJECTS - CHARACTERIZATION a: MOST PROJECTS ARE PERSONAL. Most projects are personal and little more than code dumps such as example code, experimentation, backups or exercises not intended for customer consumption [21], [29], [45], [52]. Thus, they exhibit very low activity (e.g., commits) and attract low interest [21], [45] (e.g., watchers and downloads [53]). b: MOST PROJECTS CHOOSE NOT TO BENEFIT FROM GitHub FEATURES. Most projects ignore GitHub collaboration capabilities [45], [54]. In particular, the pull request mechanism is rarely employed [21], [29] (according to Gousios et al. [24], 14% of projects used it) as well as the use of the issue tracker, fork and issue label mechanisms [40], [42]. Sometimes, these projects rely on external tools to manage the collaboration [21]. c: COMMERCIAL PROJECTS ON GitHub. GitHub is not only for open source software. Commercial projects also use GitHub and the functionalities provided by the platform. In particular, they adopt a workflow that builds on branching and pull requests to drive independent work. Pull requests are also used to isolate individual development and perform code review before merging as well as to act as coordination mechanism. Coordination is also achieved using GitHub’s transparency and visibility, while conflict resolution is often based on self-organization when assigning tasks [55]. d: PROJECT DOMAINS. GitHub projects can be classified according to the type of software they aim to develop. Popular ones are Application software that offers software functionalities to end-users, like VOLUME 5, 2017. browsers and text editors; system software, which provides services and infrastructures to other systems, like operating systems, middleware, servers, and databases; software tools, which provides support to software development tasks, like IDEs, package managers, and compilers; documentation that hosts tutorials and source code examples, and web and non-web libraries and frameworks. The top three domains are system software, web and non-web libraries, followed by software tools [47]. e: PROJECT LANGUAGES. JavaScript, Ruby, Python, Objective-C and Java are the top used languages in terms of number of projects in GitHub [56], [57]. Furthermore, the top 5 projects in terms of the number of contributors are Linux kernel related, and two of which are owned by Google [58]. f: USER BASE AND DOCUMENTATION KEEP THE PROJECT ALIVE. Projects that are actively maintained are more likely to be alive in the future than projects that only show occasional commits [59], as well as a good interaction with the user base [59], [60]. The presence of documentation correlates as well with future project survival (in particular the projects that include contributing.md are 25% to 45% more likely to be alive) [59]. g: ATTRACTING AND RETAINING CONTRIBUTORS. The ability to attract and retain contributors can influence the projects survival. Simple contribution processes [61], presence of documentation [62], project complexity and popularity [40] are generally associated with the ability to attract contributors. Conversely, projects used professionally [61], the adoption of more distributed and transparent (non-centralized) practices as pull requests are generally associated to projects with higher contributor retention [60], [63]. Projects are better at retaining contributors than at bringing on new ones [61]. 5) PROJECTS - POPULARITY a: FEW PROJECTS ARE POPULAR. Only few projects are popular, in particular the distribution of stars and downloads [43], [53] (key metrics for popularity) follows a power-law distribution. b: BENEFIT OF PROJECT POPULARITY. Popularity is useful to attract new developers [40], [51], [61], since the project is perceived as a high quality and worthwhile. c: PROJECT ACTIVITY AND PROJECT POPULARITY. For GitHub projects, good indicators of popularity are the number of forks, stars, followers and watchers [19], [29], [46]. The number forks positively and strongly correlates with the number of stars and watchers [40], [47], as well as with the number of commits and branches [43], 7179.
(8) V. Cosentino et al.: Systematic Mapping Study of Software Development With GitHub. furthermore the number of stars grows exponentially with the number of contributors [43]. d: DOCUMENTATION AS A FACTOR FOR PROJECT POPULARITY. There exists a clear relationship between the popularity and the documentation effort [62], [64], [65]. In particular, popular projects exhibit higher and more consistent documentation activities and efforts [64], 95% popular projects have nonempty READMEs (and larger than unpopular counterparts) [65], setting up useful documents can be the key of attracting coding contributors [62]. Moreover, popular projects often specify the programming language used [43], rely on testing mechanisms [65], and have a wiki [53]. e: FAME OF PROJECTS DRIVEN BY ORGANIZATIONS. Projects owned by organizations tend to be more popular than the ones owned by individuals [47]. f: TRENDS IN PROGRAMMING LANGUAGES AND DOMAIN AS FACTORS FOR PROJECT POPULARITY. The adoption of a given programming language and the application domain may also impact the project popularity [47], [60]. The most popular projects are the ones adopting Ruby, JavaScript, Java or Python [40]. However, JavaScript is responsible for more than one third of them [47], and together with Ruby, accounts for most of the projects in GitHub [66]. g: PROJECT POPULARITY VS. USER POPULARITY. According to Jarczyk et al. [43], projects whose developers follow many others are in general more popular. Conversely, this does not happen for projects whose developers are followed by many others (i.e., having popular developers in the project). Calvo-Villagran and Kukreti confirm this finding by reporting that the involvement of one or more popular users on a project does not influence on the project’s popularity [66]. 6) PROJECTS - COMMUNITIES & TEAMS a: SMALL DEVELOPMENT TEAMS. Most of the projects have small development teams [53]. Kalliamvakou et al. [21] claim that 72% of projects have only have a single contributor, Lima et al. [18] report that 74.22% of projects have two, while Avelino et al. report that a small group of developers is responsible for a large set of code contributions [20]. Similarly, the work in [52] states that the vast majority of projects in GitHub have fewer than 10 contributors, and the work in [23] affirms that 88%-98% of projects have fewer than 16. b: TYPES OF TEAM. Vasilescu et al. report that 4 different kinds of communities exist in GitHub, called fluid, commercial, academic and stable respectively. Fluid communities are composed of voluntary developers that ‘‘come and go as their interest waxes and wanes’’. Commercial communities are made of professionals, thus changes in team composition are mostly 7180. due to the company’s dynamics. Academic communities are made by people working in academia, thus such communities are less dynamics then the previous ones. Finally, stable communities do not exhibit at all changes in their composition, since they are mostly personal or small-team projects [67]. c: TEAMS AND DIVERSITY. There exist a positive impact on the collaboration experience and productivity in diverse (gender, tenure, nationality) teams, despite some possible drawbacks such as improper contributions by newcomers and difficulties in communication due to different user origins [67], [68]. Location diversity is not a rare occurrence in GitHub [68], but is generally observed in teams with more than 40 users, while small teams tend to have developers concentrated in the same location [18], [40]. Tenure diversity is made possible by the lowered barrier to participation GitHub offers [68]. It may increase attrition between team members, however this negative effect appears to be mitigated when more experienced people are present) [68]. Finally, regarding gender diversity, only 1% of projects in GitHub are all-female projects [68], [69]. d: COMMUNITY COMPOSITION. The definition of who is part of the project community varies across projects. Many works have proposed classifications of the users involved to a project. Vasilescu et al. reports that ‘‘everyone who does something in the project’’ (e.g., pushes code, submits pull requests, reports issues) is considered part of the community [67], while Yamashita et al. identify two kinds of users, core and non-core developers (where the former are granted with write permission on the project while the latter are not) [23]. Other works [70]–[73] provide more detailed structures by relaying on the user experience, coding activity, popularity and actions on the platform (e.g., watching, forking, commenting, etc.). e: STABILITY OF CORE DEVELOPERS. The proportion of core developers remains stable as the project gets larger [23], [72]. f: FEW USERS BECOME CORE DEVELOPERS. . Commonly, long-term contributors are turned into core developers, so that they can help developing big projects. However, this kind of collaboration is quite rare in GitHub [18]. In addition, it may not be possible when the contributions are done to popular projects [33], [74] or to projects that rely on paid developers [43], [62]. 7) PROJECTS - GLOBAL DISCUSSIONS a: MOST DISCUSSIONS REVOLVE AROUND CODE-CENTER ISSUES. Discussions are engaged by core and non-core developers in order to evaluate both the problem identified and the solution proposed [28]. Discussion topics are mostly around the code, due to the code-centric view of the collaboration in GitHub. VOLUME 5, 2017.
(9) V. Cosentino et al.: Systematic Mapping Study of Software Development With GitHub. b: LONG DISCUSSIONS HAVE A NEGATIVE EFFECT. Long discussions generally entail a negative effect on the final decision about the contribution [27], [28], [32], [33], [37]. However, they show that project’s developers are willing to engage with users to clarify issues [75]. c: MOOD IN DISCUSSIONS. Mood in discussions is generally neutral due to their technical nature [76]. However, negative emotions can be identified in discussions on Monday, in projects developed in Java [76] and in security-related discussions [77]. Finally, country location diversity has a positive effect on discussions [67], [76]. d: BARRIERS AND ENABLERS IN DISCUSSIONS. Paid developers can be a barrier to attract users for discussion [62], while generally discussions using label and @-mention mechanisms tend to involve more people [28], [38], [42]. 8) USERS - CHARACTERIZATION a: A MAJORITY OF USERS COME FROM THE UNITED STATES. Several works [18], [31], [56], [74], [78] report that most of the users in GitHub come from North America, Europe and Asia. In particular, United States accounts for the largest share of the registered user accounts [78]. b: GitHub IS MAINLY DRIVEN BY MALES AND YOUNG DEVELOPERS. Most of users in GitHub are males, while females account only for a small percentage of GitHub [56], [68]. In addition, most of the users are between 23-32, and only a tiny percentage is older than 60 [56]. A similar finding is reported by Vasilescu et al. where the median and mean of the users’ age in their survey is 29 and 30 respectively [68]. Users in GitHub have more than 6 years of development experience [68], [79]. c: HOBBYISTS AS MAIN CITIZENS. The large majority of users are hobbyists who make occasional contributions, while a tiny percentage are dedicated developers who produce a stream of contributions over long term [29] with peaks during the working hours in Europe and North America [80]. d: USERS AND PRIVATE PROJECTS. Approximately half of GitHub’s registered users work in private projects, thus their activities on the platform are not publicly visible [21]. e: INDICATORS TO ASSESS THE EXPERTISE, INTEREST AND IMPORTANCE OF USERS. The features provided by the platform offer hints to identify users’ expertise, interests and their importance in the community, thus supporting more accurate impressions of contributors [19], [81]. In particular, the user expertise is often judged by the breadth and depth of the projects the VOLUME 5, 2017. user owned, and the coding languages she uses; while hints to her interests are often signaled by the feed of her actions across projects [29], [32], [82]. Furthermore, Badashian and Stroulia report that the number of times the repositories of a user have been forkedİ is an indicator of the value of the content produced by the user [57]. This information is heavily used in hiring processes. f: COMMITMENT. Sustained contributions and volume of activity of a user are considered as a signal of commitment to the project [19], [29], [32], [82]. The commitment of the users in a project may highly differ each other. For instance, Bissyande et al. report that 42% of issue reporters generally do not contribute to the code base of the target project, while Onoue et al. [83] claim that some developers are balanced in writing code, commenting, and handling issues, while others prefer to focus more on coding or commenting activities. g: PRODUCTIVITY. User productivity depends on factors such as the number of projects the user is involved and her commitment to the project. In particular, a user that focuses on many projects may decrease the quality of his contributions to the single projects (e.g., increase the number of bugs in the code) [43], [84]. Furthermore, distractions and interruptions from communication channels negatively impact developer productivity as well as geographic, cultural, and economic factors can pose barriers to participation through social channels [56]. Conversely, prior social connections [35], proper onboarding support and an efficient and effective communication of testing culture [26] can increase the productivity of new contributors, that will face less pull request rejections. 9) USERS - ROCKSTARS a: WHO IS A ROCKSTAR?. A rockstar, or popular user, is characterized by having a large number of followers, which are interested in how she codes, what projects she is following or working on [19], [29], [57]. The number of followers a user has is interpreted as a signal of popularity/status in the community [19], [29]. Rockstars are loosely interconnected among them and tend to have connections with unpopular users [18], [85]. In addition, rockstars exert their influence in more than one programming languages [57]. b: HOW TO BECOME A ROCKSTAR?. Users become popular as they write more code and monitor more projects. However, while low popularity levels can be attained with a little effort, achieving higher levels requires much more effort [86]. Popularity is not gained through development alone, in fact Lima et al. [18] report that the relation between the number of followers of a user and her contributions is not strong, meaning that a higher level of activity does not directly translate into a larger number 7181.
(10) V. Cosentino et al.: Systematic Mapping Study of Software Development With GitHub. of followers. Thus, there are other factors that improve the user popularity such as participating in different projects and discussions [86]. c: IMPACT ON THE PROJECT. Rockstars play an important role on the project dissemination and attractiveness. In particular, when a rockstar increases her activity on a project, it attracts more followers to participate (e.g. opening/commenting issues) on the same project [82], [87], [88]. However, it is worth noting that the involvement of one or more popular users will not influence on the project’s popularity [57], [66]. 10) USERS - ISSUE REPORTERS AND ASSIGNEES a: ACTIVITY. A vast majority of issue reporters are not active on code contributions, do not participate in any project and do not have followers [89], in addition they often have an empty profile [32]. On the other hand, a considerable number of assignees is very active, and in comparison with reporters, they are more popular, exhibit higher code activity and have been on GitHub for more years [89]. 11) USERS - FOLLOWERS a: FOLLOWING IS NOT MUTUAL. The following relationships in GitHub are characterized by low reciprocity and follow a power-law distribution, meaning that given two users, they do not follow each others back in general, and only few users have a high number of followers while the majority does not [18], [53], [58], [82], [90]. b: WHY FOLLOWING OTHER USERS?. The mechanism of following allows users to receive notifications about what others are working on and who they are connecting with. Following is an action that is used with different intents. It is used as an awareness mechanism, to discover new projects and trends, for learning, socializing and collaborating as well as for implicit coordination [46], [88], [91] and when looking for a job [40]. c: FOLLOWERS ARE NOT SPECIAL. Users who follow many others are not much more active than those who do not [18]. In the same direction, Alloho and Lee [40] claim that there exists a weak correlation between the number of users that follow many others and the number of project participations. d: THE SMALL WORLD OF FOLLOWERS. The following networks in GitHub fit the theory of the ‘‘six degrees of separation’’ in the ‘‘small world’’ phenomenon, meaning that any two people are on average separated by six intermediate connections [85].. generally used to assess the quality, popularity and worthwhile of a project [19], [29]. In fact, the number of watchers positively correlates with the number of issues and forks [39], [40]. Watching is also used as implicit coordination mechanism [91]. Watchers represent a valuable resource for a project and can influence its health since they represent a pool for recruiting the project’s future contributors [92]. 13) ECOSYSTEM - CHARACTERIZATION a: TYPICAL ECOSYSTEMS IN GitHub. A software ecosystem is defined as a collection of software projects which are developed and co-evolve together (due to technical dependencies and shared developer communities) in the same environment [93]. Most ecosystems in GitHub revolve around one central project [94], whose purpose is to support software development, such as frameworks and libraries [47], [66], [94] on which the other projects in the ecosystem rely on. b: POPULAR ECOSYSTEMS ARE USUALLY INTERCONNECTED. Most ecosystems are interconnected, while small, unpopular ones remain isolated and tend to contain projects owned by the same GitHub user or organization [90], [94]. c: MUTUAL EVOLUTION IN LINKED ECOSYSTEMS. Ecosystems in GitHub can be modeled with a mutualistic behavior [95], meaning that the evolution of the population of developers and projects evolve over time following biological models used for describing host-parasite interactions. d: JAVASCRIPT, JAVA AND PYTHON DOMINATE THE ECOSYSTEMS. In GitHub, there are two clear dominant clusters of programming languages. One cluster is composed by the web programmingİ languages (Java Script, Ruby, PHP, CSS), and a second one revolves around system oriented programming languages (C, C++, Python) [58]. JavaScript, Java and Python are the top 3 languages in GitHub [56]–[58]. In particular, until 2011 Ruby was the dominant programming language on GitHub. Until 2012, Java Script, Ruby and Python were the top 3 programming languages. In 2013 and 2014, Java took the second place, after JavaScript [58]. 14) ECOSYSTEM - TRANSPARENCY a: TRANSPARENCY AND USERS. GitHub’s transparency helps in identifying user skills as well as enabling learning from the actions of others, facilitating the coordination between users in a given ecosystem [19], [26], [29], [55], [81], and lowering the barriers for joining specific projects [26], [52], [63], [96]. b: TRANSPARENCY AND PROJECTS. 12) USERS - WATCHERS. Why Watching Projects? Watching is a social feature on GitHub that allows users to receive notifications on new discussions and events for a given project. Watching is 7182. The transparency provided by GitHub can help in making sense of the project (or ecosystem) evolution over time [29]. In particular, the amount of commits, branches, forks as well as open and closed pull requests and issues are meant to VOLUME 5, 2017.
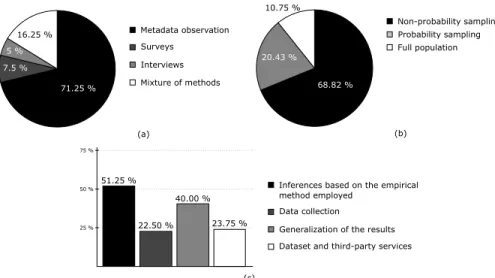
(11) V. Cosentino et al.: Systematic Mapping Study of Software Development With GitHub. reflect the project activity and size and how the project is managed [19], [43]. For instance, lots of open and ignored pull requests signal that external contributions are often not taken into account, since each open pull request indicates an offer of code that is being ignored rather than accepted, rejected or commented upon [19], [29].. •. •. 15) ECOSYSTEM - RELATIONSHIP WITH OTHER PLATFORMS a: GitHub AND MORE. Activities around a software development project are not exclusively performed in GitHub [21], but they leverage on other platforms and channels with superior capabilities in terms of social functions, making user connections easier [91]. This reveals the existence of an ecosystem on the Internet for software developers which includes many platforms, such as GitHub, Twitter and StackOverflow, among others [91]. In particular, Storey et al. report that developers in GitHub use of average 11.7 communication channels such as face-to-face interactions, Q&A sites, private chats (Skype, Google chat, etc.), mailining lists, etc. [56]. b: GitHub AND TWITTER. Twitter is used by developers to stay aware of industry changes, for learning, and for building relationships, thus it helps developers to keep up with the fast-paced development landscape [91], [97]. However, Twitter (together with other web sites and search engines) is also used to identify GitHub projects to fork [46]. c: GitHub AND StackOverflow. StackOverflow is often used as a communication channel for project dissemination. In addition, there exists a relation between the users’ activities across the two platforms [86], [98]. However, while Vasilescu et al. report that active GitHub contributors provide more answers (and ask fewer questions) on StackOverflow, and active StackOverflow answerers make more commits on GitHub [98], Badashian et al. admit that interdependencies between the users’ activities across the two platforms exists, but the relationship is weak, thus the activity in one platform cannot predict the activity in the other one [86]. B. RQ2: WHICH EMPIRICAL METHODS HAVE BEEN USED?. In this section we characterize the methodological aspects of the empirical process followed by the selected papers when inferring their results and take a critical look at them to evaluate how confident we can be about those results and how generalizable they might be. We classified the selected papers according to: •. Type of Methods Employed for the Analysis. This dimension can take four values, namely: (1) Metadata observation, when the work relies on the study of Github metadata; (2) surveys; (3) interviews; or (4) a mixture of methods. Other kinds of empirical methods are not added as dimensions since no instance of them were found.. VOLUME 5, 2017. Sampling techniques used, which classifies the sampling techniques used to build the datasets out of GitHub (i.e., subsets of projects and users input of the analysis phase for the papers). This dimension can take three values, namely: (1) non-probability sampling, (2) probability sampling; or (3) no sampling. Self-awareness, which analyzes whether a paper reports on its own limitations (i.e., threats to validity).. Next we report on the classification of the selected papers according to these dimensions. 1) TYPE OF METHODS EMPLOYED. Figure 2a shows the results of the study of empirical methods employed. As can be seen, the great majority of the works (71.25%) rely on the direct observation and mining of GitHub metadata. The use of surveys and interviews was detected in 12.5% of the works, while the remaining 16.25% combine pairs of the previous methods (e.g., metadata observation and interviews). It is important to note that only 22.5% of the selected works applied longitudinal studies,6 an issue that seems to be common in Open Source studies [21], [99]. 2) SAMPLING TECHNIQUES USED. Figure 2b shows that most of the works (68.82%) use nonprobability sampling, while around a third (20.43%) rely on probability sampling. Interestingly enough, stratified random sampling,7 which takes into account the diversity of projects and users [100], is used just in 11.25% of the works. 10.75% of the analyzed works do not use sampling techniques at all. This range of sampling strategies can bias the generalization of the findings where representativeness is important. For instance, most of the non-probability sampling papers handpick successful projects (in terms of popularity, code contributions, etc.) and therefore cannot be used to represent the average GitHub project. This can be justified in some cases (where, for instance, we want to study specific groups of projects, e.g., only highly popular ones) but not as general rule. 3) SELF-AWARENESS. By analyzing the limitations self-reported in the selected papers, we can assess their degree of self-awareness regarding potential threats to validity. Interestingly enough, 33.75% of them did not comment on any threat. For the rest, we identified four categories of publicly acknowledged limitations: (1) limitations on the empirical method employed, (2) on the data collection process, (3) on the generalization of the results and (4) on the dataset and use of third-party services. Figure 2c shows the results. Note that works may report limitations covering several categories. 6 A longitudinal study is a correlational research study that concerns repeated observations of the same variables over long periods of time 7 Stratified random sampling involves the division of population into smaller groups (strata), that share same characteristics before the sampling takes place.. 7183.
(12) V. Cosentino et al.: Systematic Mapping Study of Software Development With GitHub. FIGURE 2. (a) Empirical methods, (b) sampling techniques employed and (c) classification of the limitations reported.. Around half of the works (51.25% of the works reporting limitations) reported threats due to the empirical method employed, which included potential errors and bias introduced by the authors, techniques and tools used. With respect to the data collection (22.50%), it is interesting to note that around half of them explicitly commented on problems with the GitHub API (e.g., limited quota of requests or events not properly returned). The issues regarding the generalization of the results (40.00%) was mainly due to the non-probability sampling techniques chosen. Instead, the generalization of the results to Open Source in general is not regarded as a threat and assumed to be true given the current dominance of GitHub as Open Source code hosting platform. Finally, we detected some works (23.75%) which reported problems with datasets and third-party services mirroring GitHub, mostly related to their size and data freshness. C. RQ3: WHICH TECHNOLOGIES HAVE BEEN USED TO EXTRACT AND BUILD DATASETS FROM GitHub?. Papers studying GitHub must first collect the data they need to analyze, which can either be created from scratch or by reusing existing datasets. We classified the selected papers according to: • Data collection process, which reports on the tool/s used to retrieve the data. Currently there are six possible values for this dimension according to the tool used: (1) GHTorrent [80], (2) GitHub Archive, (3) GitHub API, (4) Others (e.g., BOA [101]), (5) manual approach and (6) a mixture of them. • Dataset size and availability, which reports on the number of users and/or projects of the dataset used in the study, and indicates whether the dataset is provided together with the publication. This may help to evaluate the replicability of the work. 1) DATA COLLECTION PROCESS. Figure 3a depicts the frequency of each data source, showing that the main ones are GHTorrent and the GitHub API. 7184. This figure illustrates a clear trade-off when deciding the data source: curated data vs. fresh data. Third party solutions offer a more curated dataset that facilitates the analysis while the GitHub API guarantees an up-to-date information. Moreover, the GitHub API request limit acts as a barrier to get data from GitHub. This affects, both, curated datasets (that take their data raw also via the GitHub API) and individual researchers accessing directly the API. 2) DATASETS SIZE. In total, 36.56% of the works reported the dataset size in terms of projects, while 36.56% of them used the number of users. 26.88% of the works provided the two dimensions. Figures 3 summarizes the number and size of the datasets according to the number of projects (see Fig. 3b), number of users (see Fig. 3c) and both (see Fig. 3d). Regarding the dataset availability, there are 43.75% (35 papers) of the works providing either a link to download the datasets used or use datasets freely available on the Web. The remaining 56.25%, although mostly explaining how the datasets were collected and treated, do not provide any link to the dataset nor to an automatic process to regenerate it. D. RQ4: WHAT ARE THE RESEARCH COMMUNITIES AND THE PUBLICATION FORA USED?. We believe it is also interesting as part of a systematic mapping study to characterize the research community behind the field, both in terms of the people and the venues where the works are being published. According to this, we analyzed the two following dimensions: • Researchers, which we propose to analyze by building the co-authorship graph of the selected papers. In this kind of graphs, authors are represented as nodes while co-authorship is represented as an edge between the involved author nodes. Furthermore, the weight of a VOLUME 5, 2017.
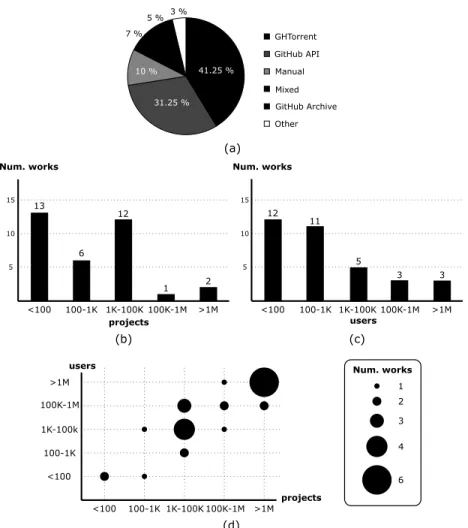
(13) V. Cosentino et al.: Systematic Mapping Study of Software Development With GitHub. FIGURE 3. (a) Tools used to collect data from GitHub. Number of works reporting the size of their datasets according to (b) the number of projects, (c) number of users and (d) both.. •. node represents the number of papers included in the set of selected papers for the corresponding author while the weight of an edge indicates the number of times the involved author nodes have coauthored a paper. By using co-authorship graphs, we can apply well-known graph metrics to analyze the set of selected papers from a community dimension perspective. Publication fora, which requires a straightforward analysis as we only have to use the venue where each selected paper was published.. 1) RESEARCHERS. Figure 4 shows the co-authorship graph for the set of authors of the selected papers. The graph includes 179 nodes (i.e., unique authors) and 316 edges (i.e., co-authorship relations). We analyzed the number of connected components in the graph, which helps to identify sets of authors that are mutually reachable through chains of co-authorships. In total, there are 39 connected components and, as can be seen, there are 9 major sub-graphs including more than 5 author nodes. One of them (see bottom part of the graph) is the largest sub-graph including 41 author nodes (almost 22.91% of the total number of authors). We consider each of these VOLUME 5, 2017. connected components as sub-communities of collaboration. This last connected component also contributes to a global graph diameter of 7 (largest distance between two author nodes). On the other hand, the average path length in the graph is 2.94. We also calculated the betweenness centrality value for each node, which measures the number of shortest paths between any two nodes that pass through a particular node and allows identifying prominent authors in the community that act as bridges between group of authors. The darker a node is in Fig. 4, the higher the betweenness centrality it has (i.e., the more shortest paths pass through). Finally, we also measured the graph density, which is the relative fraction of edges in the graph, that is, the ratio between the actual number of edges and the maximum number of possible edges in the graph. When applied to co-authorship graphs, this metric can help us to measure the collaboration by studying how connected are the authors. In our graph, the graph density is 0.02, which is a very low value due to the existence of numerous connected components. This open the door to further collaborations between authors in the different subcomponents to enrich the research results in the area. 7185.
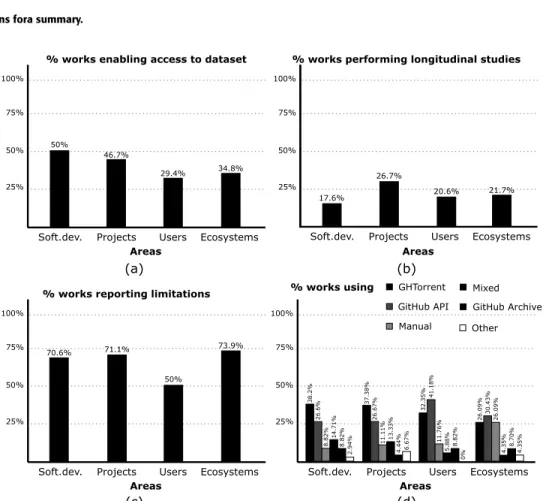
(14) V. Cosentino et al.: Systematic Mapping Study of Software Development With GitHub. FIGURE 4. Co-authorship graph for the selected papers. Nodes represent authors and edges represent co-authorships. The bigger the node, the more papers such author has. The thicker the edge, the more papers the involved authors have coauthored. The darker the node, the higher the betweenness centrality.. TABLE 6. Distribution of works along the years.. 2) PUBLICATION FORA. Table 6 shows the distribution along the years of the number of papers both collected and finally selected, as well as the publication type for the latter group. They span from 2009 to (July) 2016, and, as can be seen, the number of papers has been definitely increasing. From the selected works, 72.50% are conference papers, 11.25% are technical reports, while journal and workshop papers account for 11.25% and 5.00%, respectively. Figure 5 depicts the number of primary sources for each publication forum. E. CROSS ANALYSIS. In this section we perform an initial cross analysis among research questions (e.g., areas vs. limitations, areas vs. datasets, etc.) to identify possible relationships among them, e.g., are papers studying ecosystems more prone 7186. to use a certain collection process or a specific sampling technique? We first studied the dimensions of study for each research question and then performed the analysis in a pairwise basis. We identified 10 dimensions in total: (1) areas and (2) topics regarding RQ1; (3) empirical methods employed, (4) sampling techniques used, (5) limitations, (6) replicability, (7) diversity and (8) longitudinal studies regarding RQ2; and (9) data collection process and (10) datasets size regarding RQ3. We studied each pair of dimensions8 and report on some of the findings in what follows. The most illustrative findings involve the use of the areas dimension. Figure 6 shows some results obtained when cross-analyzing this RQ1 dimension with the others. 8 The results of each combination are available at https://github.com/SOMResearch/github-selection VOLUME 5, 2017.
(15) V. Cosentino et al.: Systematic Mapping Study of Software Development With GitHub. FIGURE 5. Publications fora summary.. FIGURE 6. Cross analysis. Results for the areas and (a) replicability, (b) longitudinal studies, (c) limitations and (d) data collection process dimensions.. Figure 6a shows the results for the areas and replicability dimensions where the horizontal axis shows the main areas and the vertical axis the number of works that promoted replicability by providing a link to the dataset used. As can be seen, the number of works for the users area is very low in contrast with the rest, which may be due to the fact that building and publishing datasets for code artefacts (required for the software development, projects and ecosystems areas) is usually easier than collecting data concerning users and communities (where additional sources like forums or issue trackers may be required). The study of areas with longitudinal studies dimensions (see Fig. 6b) reveals that only the projects area shows a high VOLUME 5, 2017. value with respect to others, as project history information is usually available; while the study of areas with limitations dimensions (see Fig. 6c) shows that most of the works classified in the users area usually do not self-report limitations of the study. Finally, when studying the areas and data collection process dimensions (see Fig. 6d), we observed that while studies on software development and project areas favor the use of GHTorrent, studies on users tend to rely more on the GitHub API and works on ecosystems depend more on manual collection processes. Based on our experience, a plausible explanation is that GitHub API offers richer data concerning user interactions (required for user studies) and that the 7187.
(16) V. Cosentino et al.: Systematic Mapping Study of Software Development With GitHub. complexity of analyzing ecosystems forces researchers to always have a direct participation in the data collection process.. that the number of works sharing their datasets is increasing over time.. VI. DISCUSSION. We believe the limited acknowledgment of their threats to validity (around 34% do not report any) puts the reader in the very difficult situation of having to decide by herself the confidence in the reported results the work deserves. Works reporting partial results or findings on very concrete datasets are perfectly fine but only as long as this is clearly stated. However, we detected an upward trend in reporting threats to validity in recent years.. E. LOW LEVEL OF SELF-AWARENESS. In this section we highlight and discuss some of the findings from our study. This section extends our early analysis [102], relying on a more recent and different selection of papers. Note that these findings stand even if we look at specific subsets of papers, with the few exceptions mentioned before in the cross-analysis section. A. LACK OF SPECIFIC DEVELOPMENT AREAS AND INTERDISCIPLINARY STUDIES. Our analysis of areas/topics reveals a lack of works studying GitHub with a more interdisciplinary perspective, e.g., from a political point of view (e.g., study of governance models in OSS), complex systems (e.g., network analysis) or social sciences (e.g., quality of discussions in issue trackers). We also miss works targeting early phases of the development cycle (e.g.s studying requirements and design aspects). Obviously, this kind of studies are more challenging since there is typically less data available in GitHub or needs more processing. B. OVERUSE OF QUANTITATIVE ANALYSIS. Right now, a vast majority of studies rely only on the analysis of GitHub metadata. We hope to see in the future a better combination of such studies (typically large regarding the spectrum of analyzed projects but shallow in the analysis of each individual project) with other studies targeting the same research question but performing a deeper analysis (e.g., including also interviews to understand the reasons behind those results) for a smaller subset of projects. We detected some evidences of this shift in the number of works applying longitudinal studies, where we found a positive trend, thus improving the situation detected in OSS by other works [21], [99]. C. POOR SAMPLING TECHNIQUES. We believe that the GitHub research community could benefit from a set of benchmarks (with predefined sets of GitHub projects chosen and grouped according to different characteristics) and/or from having trustworthy algorithms responsible for generating diverse and representative samples [100] according to a provided set of criteria to study. These samples could, in turn, be stored and made available for further replicability studies. D. SMALL DATASETS SIZE. Most papers use datasets of small-medium size, which are an important threat to the validity of results when trying to generalize them. Also, more than half of the analyzed paper did not provide a link to the dataset they used nor an automatic process to regenerate it, which may also hamper the replicability of the studies. However, it is important to note 7188. F. NEED OF REPLICATION AND COMPARATIVE STUDIES. Clearly urgent since almost none exist at the moment. Replicability is hampered by some of issues above and the difficulties of performing (and publishing) replicability studies in software engineering [103]. Comparative studies need to first set on a fixed terminology. Some papers may seem inconsistent when reporting on a given metric but a closer look may reveal that the discrepancy is due to their different interpretation. For instance, this is common when talking about success, popularity or activity in a project (e.g., one may consider a project successful as equivalent to popular, and by popular mean to be starred a lot, while the other may interpret successful as a project with a high commit frequency). Replicability is also threaten in studies involving user interviews, as the material produced as a result of such interviews is normally not provided. G. API RESTRICTIONS LIMITS THE DATA COLLECTION PROCESS. GitHub self-imposed limitations on the use of its API hinders the data collection process required to perform wide studies. A workaround can be the use of OAuth access tokens from different users to collect the information needed. An OAuth access token9 is a form to interact with the API via automated scripts. It can be generated by a user to allow someone else to make requests on his behalf without revealing his password. Still, researchers may need a large number of tokens for some studies. To deal with this issue, we propose that GitHub either lifts the API request limit for research projects (pre-approving them first if needed) or offers an easy way for individual users to donate their tokens to research works they want to support. H. PRIVACY CONCERNS. Data collection can also bring up privacy issues. Through our study, we discovered that GitHub and third-party services, built on top of it, are sometimes used to contact users (using the email they provide in their GitHub profile) to find potential participants for surveys and interviews [26], [30], [55], [67], [68], [88], [97]. This potential misuse of user email addresses can raise discontent and complaints from 9 https://developer.github.com/v3/oauth/ VOLUME 5, 2017.
(17) V. Cosentino et al.: Systematic Mapping Study of Software Development With GitHub. the GitHub users.10 Even when it is not clear whether such complaints are reasonable, the controversy alone may hamper further research works and therefore must be dealt with care. As with the tokens before, we would encourage GitHub to also have an option in the user profile page to let users say whether they allow their public data to be mined as part of research works and under what conditions. TABLE 7. Existing related work and dimensions considered.. techniques or data collection processes applied and leave out other aspects as the size of the or diversity of the projects. Moreover, our study is larger and more up-to-date which is highly relevant in this field given the huge growth in popularity of social coding platforms like GitHub. Crowston et al. [99] cover several of our research dimensions but the analysis was done before the release of GitHub (i.e., mostly on SourceForge and previous platforms). Moreover, most of the dimensions of our RQ2 are missing or lack enough details (e.g., on the sampling techniques used). The other works [106], [107] are much more limited in terms of the scope of the analysis they perform and provide limited quantitative data on those dimensions. VIII. THREATS TO VALIDITY. VII. RELATED WORK. Only few works have focused on the study of how software development practices evolved and may be improved thanks to social coding platforms like GitHub. Table 7 shows a summary of the relevant related work and how they cover the main dimensions considered per research question. As can be seen, none of the previous studies covers the full range of dimensions identified in our work and, in most cases, even if a study does cover one of the dimensions, it does not do it with the level of detail and precision (e.g., by providing the exact set of papers in that dimension or giving the precise number of papers therein) as we do in this survey. Amannn et al. [104] address as well our RQ1 but partially, as they present main areas in terms of goals and topics by text-mining article titles instead of considering in full the paper content. They also list limitations that may appear when mining software repositories but they do not provide statistics about the number of papers reporting or affected by those limitations and their frequency. Although they comment on sampling techniques, data collection process and dataset sizes, the discussion is shallow and they do not classify and analyze the different methods used. For instance, regarding the data collection process, they comment on megarepositories (e.g., GitHub, GoogleCode, etc.) and manual processes, but they do not provide statistics about the technologies used (i.e., API, GHTorrent, etc.). Kalliamvakou et al. [21] describe the main challenges to be faced when mining software repositories and proposes solutions to alleviate them. Instead they do not classify nor organize existing papers in terms of such dimensions. Their goal is more to help new researchers conduct well-designed software mining studies than to provide a state-of-the-art of the current research in the field. Stol and Babar [105] systematically reviewed 63 empirical studies and covered some of our dimensions as well. Still, they are missing some relevant details on the type of 10 For instance: https://github.com/ghtorrent/ghtorrent.org/issues/32 VOLUME 5, 2017. The main threats to the validity of this study concern the search process and the selection criteria. In particular, we relied on a set of digital libraries and their query and citation support. Some works might have been ignored due to not being properly indexed in those libraries. To mitigate this issue, we also performed a snowball analysis and an issueby-issue browsing of top-level conferences and journals in the area to look for additional papers. We may also have ignored or filter out some relevant works that did not fit in our selection criteria. However, given the large number of retained works after applying the selection process, we believe that the points of discussions we report in Sect. VI would still be valid. Focusing the analysis on GitHub could also be regarded as a limitation of this work, though we do not claim the results generalize to other source forges. Still, given the absolute dominance of GitHub as data source for software mining research works (as can be seen by perusing the latest editions of conferences like MSR - Int. Conf. on Mining Software Repositories), we believe our results are representative of this research field. Another threat to validity we would like to highlight is our subjectivity in screening, classifying and understanding the original authors’ point of view of the studied papers. A wrong perception or misunderstanding on our side of a given paper may have resulted in a misclassification of the paper. To minimize the chances of this to happen, we applied a coding scheme as follows. Data acquisition and analysis & results processes were performed by one coder, who was the first author of this paper. To ensure the quality of both process, a second coder, who was the second author of this paper, validated each phase by randomly selecting a sample of size 25% of the input of the phase (e.g., a sample of 86 papers for the classification phase in the selection process) and performing the phase himself. The intercoder agreement reached for all phases was higher than 93%. We also calculated the Cohen’s Kappa value to calculate the intercode reliability. This index is considered more robust than percent agreement because it takes into account the agreement occurring by chance. The kappa value for all the phases was higher than 0.8, which is normally considered as near complete agreement. 7189.
Figure
![FIGURE 1. Systematic mapping study process [5].](https://thumb-us.123doks.com/thumbv2/123dok_es/7322753.355785/2.864.67.809.110.265/figure-systematic-mapping-study-process.webp)
+5

Documento similar
