Reversed phase high performance liquid chromatography applied to the determination of soybean proteins in commercial heat processed meat products
6
0
0
Texto completo
(2) 216. M.C. Garcı́a et al. / Analytica Chimica Acta 559 (2006) 215–220. Chromatographic techniques have also been tried with this purpose. In some cases, soybean proteins were detected from certain characteristic peptides of soybean proteins in trypsin hydrolysates [10–12]. In other cases, total hydrolysis and study of the amino acid pattern obtained by high-performance liquid chromatography (HPLC) was employed [13–16]. Some few attempts were also found in literature in which soybean proteins were directly determined using HPLC. Nevertheless, in all cases raw meats were used and in no case the direct determination of soybean proteins in commercial heat-processed meat products was tried [17,18]. Recently, our research team has developed different chromatographic methods using perfusion columns that have enabled the determination of soybean proteins in commercial heatprocessed meat products prepared with pork, turkey, chicken, and/or beef meats [19–21]. The soybean protein contents determined in these products have been compared with those obtained by the AOAC Official Method observing similar results. Nevertheless, despite the advantages associated to the use of perfusion chromatography in terms of separation time, perfusion chromatography is not always an alternative to nonperfusion chromatography. In fact, the structure of pores of a perfusive column and a non-perfusive one is totally different and, thus, the selectivity, sensitivity and other characteristics (e.g. existence of matrix interferences) of a method. Since conventional HPLC has never been applied to the quantitation of soybean proteins in commercial heat-processed meat products, the aim of this work was to investigate the potential of reversedphase HPLC for the determination of soybean proteins in these products. 2. Experimental 2.1. Chemicals and samples HPLC grade acetonitrile, isopropanol, and tetrahydrofurane (THF) (Scharlau, Barcelona, Spain) as well as trifluoroacetic acid (TFA) (Sigma, St. Louis, MO) have been used for the preparation of mobile phases. HPLC grade water obtained from a Milli-Q system (Millipore, Bedford, MA) has also been employed. Tris(hydroxymethyl)aminomethane (Tris), 2mercaptoethanol (MER), and urea from Merck (Darmstadt, Germany), ditiothreitol (DTT) from ICN (Aurora, OH), sodium dodecyl sulphate (SDS) from Fluka (Barcelona, Spain), and sodium hydrogen carbonate from Panreac (Barcelona, Spain) were employed for the optimization of the sample preparation. Acetone (Merck) was employed for fat extraction. Soybean protein isolate (SPI), obtained from ICN, was used as standard of soybean proteins. The protein content of SPI, determined by Kjeldahl analysis, was 93.0% (calculated by multiplying the nitrogen content in percentage by 6.25) and its dry matter content was determined by drying at 130 ◦ C to constant weight. One commercial heat-processed meat product not containing soybean proteins and four different heat-processed meat products (meat products 1–4) containing soybean proteins were purchased in local markets in Madrid (Spain). Heat-processed. meat products 1–4 presented a similar composition and were representative of the most common heat-processed meat products commercially available. The composition consisted of turkey and pork meats, potato starch, salt, water, and soybean proteins from soybean protein isolate. Meat products 3 and 4 also contained olives and in meat products 2–4 fat was also added. Meat products were defatted before their analysis by the following procedure: 10 g of meat product were ground in an automatic miller, homogenised with 50 mL of acetone in an Ultraturrax mixer, and centrifuged (3362g, 30 min); the supernatant was removed and the pellet was extracted again with another 50 mL of acetone and centrifuged during 1 h (3620g); finally, the pellet obtained from this second fat extraction was dried overnight at 60 ◦ C to remove the remaining acetone. Meat extracts were prepared by weighing 2.3 g of that defatted meat product, suspending in 50 mL of the appropriate solution (0.05 M carbonate buffer (pH 9.60)), shaking for 30 min in a water bath at 60 ◦ C, and centrifuging (3362g, 30 min, 40 ◦ C). The supernatant was injected into the chromatographic system. The protocol used for the preparation of the SPI consisted of weighing and dissolving the standard in the appropriate solution (0.05 M carbonate buffer (pH 9.60)), sonicating for 3 min, and centrifuging (1450g, 5 min) to collect the supernatant that was injected into the chromatographic system. 2.2. High-performance liquid chromatography A Hewlett-Packard 1100 Series liquid chromatograph (Hewlett-Packard, Pittsburgh, PA) equipped with a diode array detector was used. The separation was accomplished with a PLRP-S column (150 mm × 4.6 mm i.d.) from Polymer Laboratories LTD (Church Strutton, UK), packed with polystyrene divinylbenzene beads (300 Å, 8 m particle size). The RPHPLC separation was performed at a flow rate of 1 mL/min using a linear binary gradient water–TFA–organic modifier, an injection volume of 20 L, and UV detection at 254 nm. The gradient, column temperature, and mobile phase composition were optimised. The organic modifiers used were filtered through a 0.45-m nylon filter before use. 2.3. Calibration Calibration was performed by the external standard and by the standard additions calibration methods. Calibration by the external standard method was carried out by injecting SPI solutions over the range 2–12 mg/mL. Integration of the peak selected for the determination of soybean proteins in meat products was achieved by setting the baseline from valley to valley. The area (average of two consecutive injections) of that peak was plotted against the corresponding SPI concentration (corrected for the purity and moisture) to obtain the calibration curve. The content of soybean proteins in the meat products was determined by interpolation of the area of this peak in the meat chromatograms in the calibration curve. Calibration by the standard additions method was performed by injecting meat extracts (47 mg/mL) spiked with known and increasing amounts of SPI (0–3.75 mg/mL)..
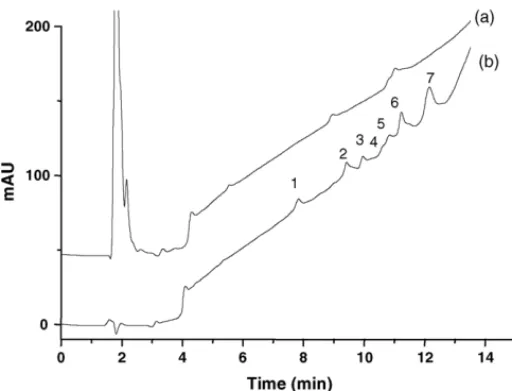
(3) M.C. Garcı́a et al. / Analytica Chimica Acta 559 (2006) 215–220. 217. 2.4. Data treatment The linearity of the calibration curves was obtained by leastsquares regression analysis and the linear model was validated by means of the analysis of residuals and the analysis of variance (ANOVA) (α = 5%). 3. Results and discussion 3.1. Chromatographic separation The determination of soybean proteins in heat-processed meat products has been performed by our research team using perfusion reversed-phase HPLC [19–21]. In the present work, we tried to explore the potential of conventional reversedphase HPLC for the determination of soybean proteins in heatprocessed meat products. RP-HPLC has also been used by our research team for the determination of soybean proteins in commercial soybean products such as soybean infant formulas and soybean milks [22,23]. Thus, the initial experimental conditions chosen for the development of a method enabling the determination of soybean proteins in heat-processed meat products by RP-HPLC were the previously employed for the separation of soybean proteins in soybean products: a linear binary gradient acetonitrile–water–0.1% (v/v) TFA, a temperature of 45 ◦ C, and a flow rate of 1 mL/min [22]. Using these conditions, a heat-processed meat product not containing soybean proteins and a heat-processed meat product with soybean proteins were analysed. Prior to their injection, these meat products were defatted with acetone and the proteins were extracted in water. Nevertheless, the analysis of these samples under those chromatographic conditions resulted unsuccessful since some components of the meat extracts were strongly retained on the stationary phase and were not easily eluted from the column. In order to overcome this problem, other organic modifiers with higher elution strengths were tried: isopropanol and tetrahydrofuran (THF). When isopropanol was used, strong adsorption of meat components on the stationary phase surface was also observed being very difficult their elution. THF had previously been used by our research team for the elution of much retained components in the analysis of soybean proteins in cured meat products using perfusion chromatography [24]. The use of THF as organic modifier (with a higher elution strength than acetonitrile and isopropanol) together with a lower concentration of TFA (0.05%, v/v), in order to reduce the interactions of meat proteins with the stationary phase, resulted in the complete elution of meat components from the column being possible the analysis of meat extracts without any further wash of the column between runs. Thus, using mobile phases consisting of THF–water–0.05% (v/v) TFA the elution gradient was optimised and the effect of the variation of the temperature on the separation was studied. For the optimisation of the elution gradient, 12 linear binary gradients with different gradient slopes (% of mobile phase B/min) and different gradient times were tried. From these experiments, a linear binary gradient from 1 to 42% B in 12 min and from 42 to 100% B in 1 min followed by a reversed gradient from 100 to 1% B in 1 min to. Fig. 1. Chromatograms corresponding to an extract of a heat-processed meat product not containing soybean proteins (20.75 mg/mL) (a) and to a solution of soybean protein isolate (4.08 mg/mL) (b). Experimental conditions: column, PLRP-S (150 mm × 4.6 mm i.d.); temperature, 45 ◦ C; flow rate, 1 mL/min; gradient: 1–42% B in 12 min and 42–100% in 1 min; mobile phases: A, 0.05% (v/v) TFA in water; B, 0.05% TFA (v/v) in THF; injection volume, 20 L; detection, 254 nm.. return to the initial conditions and an equilibration time of 1 min was chosen. Using this gradient, temperature was varied from 25 to 50 ◦ C. Retention times decreased and efficiency enhanced when increasing the temperature. From these results, the highest temperature that the column could stand without compromising its lifetime was selected, 45 ◦ C. The chromatograms obtained with the optimised conditions and corresponding to a solution of SPI and to an aqueous extract of the heat-processed meat product not containing soybean proteins are shown in Fig. 1. Soybean proteins were separated in seven peaks and the heat-processed meat product not containing soybean proteins yielded one big band at the beginning of the chromatogram and two small peaks at approximately 9 and 11 min. The optimised method was also applied to the analysis of soybean proteins in a heat-processed meat product containing soybean proteins. The general aspect of the chromatogram obtained was very similar to that observed for the meat product without soybean proteins. Only a zoom revealed the existence of a tiny peak at 12.30 min that could be attributed to peak 7 of SPI. In order to improve the sensitivity of this peak, the procedure for the preparation of meat extracts was optimised. 3.2. Optimisation of the sample preparation Most of the methods used for the preparation of meat samples for their injection in a separation system consisted of defatting the meat product in acetone and extracting soybean proteins with solutions buffered at basic pHs. Our research team, in a previous work, tried different solvents (hexane, acetone, petroleum ether, and ethanol) for the fat extraction in meat products observing the best results when acetone was employed [19]. Therefore, the optimisation of the sample preparation in this work was mainly.
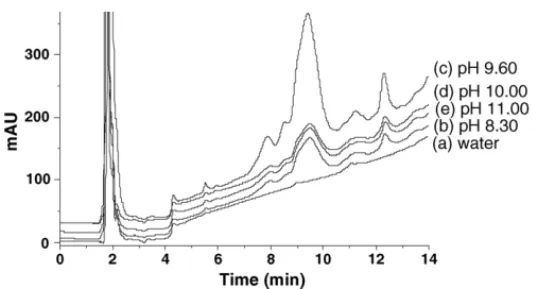
(4) 218. M.C. Garcı́a et al. / Analytica Chimica Acta 559 (2006) 215–220. Fig. 2. Chromatograms corresponding to the heat-processed meat product 1 when using different buffered solutions for the extraction of proteins: (a) water, (b) 0.05 M Tris–HCl buffer at pH 8.30, (c) 0.05 M carbonate buffer at 9.60, (d) 0.05 M carbonate buffer at pH 10.00, and (e) 0.05 M carbonate buffer at 11.00. Other conditions as in Fig. 1.. focused on the extraction of soybean proteins from the meat products, which had been the step with more significant differences among the methods found in the literature. For that purpose, the heat-processed meat product 1 was deffated with acetone, as described in Section 2, and soybean proteins were extracted using different media: water, 0.05 M Tris–HCl buffer (pH 8.30), 0.05 M carbonate buffer at different pHs (from 9.60 to 11.00), and diverse denaturing and reducing agents (MER, DTT, SDS, and urea). Fig. 2 shows the chromatograms corresponding to the extracts of the heat-processed meat product 1 obtained with the different media. The injection of the obtained extracts into the chromatographic system resulted in chromatograms with a peak at the same retention time (∼12.30 min) that the peak detected when the extraction was performed in water. This peak could correspond with peak 7 of SPI. The size of this peak was not the same in all solutions tried and ranged from the lowest value obtained with water to the highest with carbonate buffer at pH 9.60. At this pH, the effect of the addition of different denaturing and reducing agents was studied. In all cases, the area obtained was lower than that obtained without the addition of these agents. Furthermore, when adding SDS to the carbonate buffer at pH 9.60, another peak at 13.30 min was observed instead of the peak at 12.30 min. Consequently, a 0.05 M carbonate buffer at pH 9.60 was chosen as optimum extracting solvent. The chromatograms obtained when using this buffer for the extraction of soybean proteins from the heat-processed meat product 1 and the SPI are shown in Fig. 3. Moreover, the spectra and first and second derivatives of this peak in the SPI were compared with those of the same peak in the meat product observing that they were identical (Fig. 4).. Fig. 3. Chromatograms obtained from the heat-processed meat product 1 (47.40 mg/mL) and the soybean protein isolate (4.08 mg/mL) extracted with 0.05 M carbonate buffer (pH 9.60). Other conditions as in Fig. 1.. cept values in all calibration plots did not significantly differ from zero (t-test, P < 0.05) and the reproducibility (expressed as R.S.D. (%)) in the calibration slopes was 4.60% (calculated from six calibration plots obtained in a period of two months). The lowest concentration of soybean proteins detected by this method was 0.38 mg/mL (calculated as the concentration corresponding to a signal equal to the intercept plus three times. 3.3. Analytical characteristics of the method The study of the analytical characteristics of the method was performed by the evaluation of different parameters: detection and quantitation limits, presence of matrix interferences, precision, and accuracy. Table 1 groups the results obtained. Good linear correlation (r2 > 0.99) was observed between the signal and the concentration of soybean proteins in the working concentration range (2.00–12.00 mg/mL). Moreover, the inter-. Fig. 4. UV spectra and first and second derivatives of the peak appearing at 12.30 min in the heat-processed meat product 1 and in the soybean protein isolate..
(5) M.C. Garcı́a et al. / Analytica Chimica Acta 559 (2006) 215–220 Table 1 Characteristics of the developed RP-HPLC method for the determination of soybean proteins in heat-processed meat products Detection limit Quantitation limit Existence of matrix interferencesb Slope by the external standard method Slope by the standard additions method Repeatability (R.S.D., %) (n = 10)c Intermediate precision (R.S.D., %) (n = 7)d. 0.38 mg/mL (0.19% (w/w))a 1.26 mg/mL (0.63% (w/w))a. Internal reproducibility (R.S.D., %) (n = 5)e. 30.23 ± 1.39 (n = 6) 31.33 ± 0.34 (n = 4) 0.55 7.05 (SPI solution of 1.86 mg/mL), 1.67 (SPI solution of 11.27 mg/mL) 0.28. Recoveryf (%) 3.05 mg/mL soybean proteins 6.65 mg/mL soybean proteins 9.20 mg/mL soybean proteins 12.00 mg/mL soybean proteins. 99 102 102 101. Absolute recoveryg (%) Processed meat spiked with 5.90 mg SPI Processed meat spiked with 8.75 mg SPI Processed meat spiked with 11.80 mg SPI Processed meat spiked with 13.50 mg SPI. 96 100 102 95. 219. The precision of the method was determined by the evaluation of repeatability, intermediate precision, and internal reproducibility. The repeatability, expressed as R.S.D. (%) in peak area, was better than 0.6%. Intermediate precision was determined by injecting two standard solutions of SPI whose protein concentrations corresponded to the highest and the lowest concentrations of the working concentration range (maximum error). The R.S.D. values observed were close to 7.0% at low concentration levels and lower than 1.7% at high concentration levels. Reproducibility in the same day was better than 0.3%. The precision in terms of retention time was always excellent with very low R.S.D. values. The recovery of soybean proteins when different meat extracts were spiked with different amounts of SPI was also determined observing values very close to 100%. Moreover, the accuracy of the method was also evaluated when directly spiking the meat products observing recoveries as good as the previous ones. 3.4. Quantitative analysis of soybean proteins in commercial heat-processed meat products. a. Limits of detection and quantitation referred to soybean proteins were determined relative to 10 g of initial meat product. b The comparison of slopes was performed by using a t-test and the comparison of variances by using a F-test. c Repeatability in peak area when injecting 10 consecutive times a solution of 7.53 mg/mL of soybean protein isolate. d Intermediate precision in peak area obtained in the analysis of two SPI solutions corresponding to the lowest and the highest concentrations of the calibration plot (maximum error) in four different days. e Reproducibility in peak area obtained in the analysis of five individually prepared extracts of the heat-processed meat product 1 (46.3 ± 1.08 mg/mL). f Recovery of soybean proteins when different amounts of SPI were added to the extract obtained from the heat-processed meat product 1. Every determination was performed by duplicate. g Recovery of soybean proteins when different amounts of the SPI were initially added to the heat-processed meat product 1. Every determination was performed by duplicate.. the standard error of the calibration plot), which means that the method can detect an addition of 0.19% (w/w) of soybean proteins (related to 10 g of initial meat product). The lowest concentration of soybean proteins determined by this method was 1.26 mg/mL (calculated as the concentration corresponding to a signal equal to the intercept plus ten times the standard error of the calibration plot), which means that it was possible to quantitate an addition of soybean proteins of 0.63% (w/w) (related to 10 g of initial meat product). Both detection and quantitation limits were a bit higher than those obtained for similar meat products using perfusion chromatography [20]. The evaluation of the presence of matrix interferences was performed by comparing the slopes of the calibration lines obtained by the external standard calibration method with the slopes obtained when applying the standard additions calibration method. The use of t- and F-tests (P < 0.05) to make this comparison revealed that the proposed method did not suffer from matrix interferences. This fact constituted one of the main advantages of the present method since the analysis of similar samples by perfusion chromatography resulted in matrix interferences, thus, being necessary the use of standard additions [20].. The developed method was applied to the quantitation of soybean proteins in four different heat-processed meat products. For every meat product, at least, three individual determinations were performed and every replicate was injected twice into the chromatographic system. The concentration of soybean proteins determined in every sample by the external standard calibration method is shown in Table 2. The concentration of soybean proteins ranged from 0.90% for the heat-processed meat product 4 to 1.54% for the heat-processed meat product 1 and the R.S.D. obtained in all cases was always lower than 5%. Furthermore, the concentration of soybean proteins in the heat-processed meat product 1 was also determined by using the standard additions calibration method and the value obtained was 1.60%, which was very close to the value determined by the external standard method of calibration (1.54%). The soybean protein contents observed for these samples were compared with those obtained for products with the same composition by using perfusion chromatography [20]. Soybean protein contents obtained by the perfusion method (soybean protein contents ranged from 0.60% to 1.31% when 18 different meat products were analysed) were very similar to those obtained by the proposed method and were. Table 2 Soybean protein content determined in different commercial heat-processed meat products by RP-HPLCa Heat-processed meat product. Soybean protein content (mg/100 mg of sample). R.S.D. (%). 1 2 3 4. 1.54 1.27 1.48 0.90. 0.28 4.39 2.50 2.53. a. Every result is the average value obtained from three individual determinations except for the heat-processed meat product 1 in whose case, five individual determinations were performed. All results are expressed as is basis..
(6) 220. M.C. Garcı́a et al. / Analytica Chimica Acta 559 (2006) 215–220. always lower than the maximum allowance by Spanish regulations, 3% soybean proteins in the meat product as is basis. 4. Conclusions Detection and quantitation of soybean proteins in heatprocessed meat products has been possible by reversed-phase HPLC. The method used a linear binary gradient for the separation of soybean proteins from meat components. Due to the fact that meat components were very strongly retained on the stationary phase, a mobile phase containing an organic modifier with high elution strength was needed. The extraction of soybean proteins from meat products was best performed by using a carbonate buffer at pH 9.60. The chromatograms obtained from heat-processed meat products were very similar and all showed a peak at the same retention time (∼12.30 min) close to one of the peaks appearing in the soybean protein isolate (used as standard of soybean proteins) chromatogram. Using this peak, the method enabled the detection and quantitation of up to 0.19% (w/w) and 0.63% (w/w), respectively, of soybean proteins. No interferences from the matrix of the sample were detected for the meat products analysed. Results obtained in the evaluation of the precision and recovery of the method were satisfactory. The quantitative analysis of four different heat-processed meat products commercially available revealed that the concentration of soybean proteins in these products was always below the maximum allowance by Spanish regulations, 3% soybean proteins in the meat product as is basis. Acknowledgments The authors thank the Comunidad Autonóma de Madrid (Spain) for project 07G/0025/2003. Dr. C. Garcı́a-Ruiz also thanks the Ministry of Science and Technology (Spain) for her contract from the Ramón y Cajal program (RYC-2003-001). References [1] S.C.M. Yusof, A.S. Babji, Int. J. Food Sci. Nutr. 47 (1996) 323. [2] J.T. Keeton, Meat Sci. 36 (1994) 261.. [3] P.J. Shand, Production and Processing of Healthy Meat, Poultry and Fish Products, Chapman & Hall, London, 1997, pp. 191– 209. [4] G. del Campo, B. Gallego, I. Berregi, A. Casado, Food Chem. 36 (1998) 187. [5] S.A. Abdel-Aziz, S.A. Esmail, L. Hussein, F. Janssen, Food Chem. 60 (1997) 389. [6] Soy Protein Council, Soy Protein Products. Characteristics, Nutritional Aspects and Utilization, Washington, DC, 1987. [7] J. Belloque, M.C. Garcı́a, M. Torre, M.L. Marina, CRC Crit. Rev. Food Sci. Nutr. 42 (2002) 507. [8] AOAC Official Method 998.10. Soy protein in raw and heat-processed meat products, Enzyme-Linked Immunosorbent Assay. In Official Methods of Analysis, 16th ed., Rev. 1996, 1997. 1998; AOAC International, Gaithersburg, MD. [9] S.J. Koppelman, C.M.M. Lakemond, R. Vlooswijk, S.L. Hefle, Detection of soy proteins in processed foods: literature overview and new experimental work, J. AOAC Int. 87 (2004) 1398. [10] F.J. Bailey, J. Sci. Food. Agric. 27 (1976) 827. [11] J.W. Llewellyn, A.C. Dean, R. Sawyer, F.J. Bailey, C.H.S. Hitchcock, J. Food. Technol. 13 (1978) 249. [12] I.B. Agater, K.J. Briant, J.W. Llewellyn, R. Sawyer, F.J. Bailey, C.H.S. Hitchcock, J. Sci. Food Agric. 37 (1986) 317. [13] B. Lindqvist, J. Östgren, I. Lindberg, Z. Lebensm. Unters. Forsch 159 (1975) 15. [14] W. Linsberg, J. Öhman, S. Wold, Anal. Chim. Acta 171 (1985) 1. [15] C.G. Zarkadas, C.N. Karatzas, S. Khanizadeh, J. Agric. Food Chem. 41 (1993) 642. [16] M. Zhi-Ling, W. Yan-Ping, W. Chun-Xu, M. Fen-Zhi, Am. Lab. 29 (1997) 27. [17] N. Parris, P.J. Gillespie, HPLC separation of soy and beef protein isolates. In: J.P., Chemy, R.A., Barford (Eds.), Methods for Protein Analysis, Champaign: Am. Oil Chem. Soc., 1988, pp. 142– 155. [18] S.H. Ashoor, P.G. Stiles, J. Chromatogr. 393 (1987) 321. [19] F. Castro-Rubio, M.C. Garcı́a, R. Rodrı́guez, M.L. Marina, J. Agric. Food Chem. 53 (2005) 220. [20] F. Castro, M.L. Marina, J. Rodrı́guez, M.C. Garcı́a, Food Addit. Contam. 22 (2005) 1209. [21] F. Castro-Rubio, M.C. Garcı́a, R. Rodrı́guez, J. Rodrı́guez, M.L. Marina, Food Chem., in press. [22] M.C. Garcı́a, M. Torre, F. Laborda, M.L. Marina, J. Chromatogr. A 758 (1997) 75. [23] M.C. Garcı́a, M.L. Marina, M. Torre, J. Liq. Chrom. Rel. Technol. 23 (2000) 3165. [24] M. Criado, F. Castro-Rubio, C. Garcı́a-Ruiz, M.C. Garcı́a, M.L. Marina, J. Sep. Sci. 28 (2005) 987..
(7)
Figure
Documento similar
Heat map of the Pearson correlation coefficient established among observed in vitro effects and the concentration of different phytochemicals in coffee and cocoa by-products (A)
TipC and the chorea-acanthocytosis protein VPS13A regulate autophagy in Dictyostelium and human HeLa cells.. Sandra Muñoz-Braceras a , Rosa Calvo a & Ricardo
With respect to the product of area and the global heat transfer coefficient air cooler is shown how the product of area and the global heat transfer coefficient increases
In addition, precise distance determinations to Local Group galaxies enable the calibration of cosmological distance determination methods, such as supernovae,
High-performance liquid chromatography- ultraviolet detection method for the simultaneous determination of typical biogenic amines and precursor amino acids. applications in
Government policy varies between nations and this guidance sets out the need for balanced decision-making about ways of working, and the ongoing safety considerations
Using all the values obtained and performing the iterative process explained in the methods section, it is possible to know the heat losses of the supply water to the outside and
Pea and soy protein isolates are the legume proteins mostly used in RTE products because of their low processing cost, functionality, and availability, especially in meat analogues
