1
Evaluation of the dynamics of microalgae population structure and
1process performance during piggery wastewater treatment in
algal-2bacterial photobioreactors
3Dimas García1,2, Esther Posadas1, Saúl Blanco3, Gabriel Acién4, Pedro García-Encina1, 4
Silvia Bolado1, Raúl Muñoz1* 5
1
Department of Chemical Engineering and Environmental Technology, Valladolid 6
University, Dr. Mergelina, s/n, 47011, Valladolid, Spain 7
2
Centro para la Investigación de los Recursos Acuáticos de Nicaragua, CIRA/UNAN-8
Managua, Apdo. Postal 4598 9
3
The Institute of the Environment, La Serna 58 - 24007 León, Spain 10
4
Department of Chemical Engineering, University of Almeria, Cañada San Urbano, s/n, 11
04120 Almeria, Spain 12
*corresponding author: [email protected] 13
14
ABSTRACT
15
The dynamics of microalgae population during piggery wastewater (PWW) treatment in 16
four open photobioreactors operated at 27 days of hydraulic retention time, and 17
inoculated with Chlorella sp. (R1), Acutodesmus obliquus (R2), Oscillatoria sp. (R3) 18
and in the absence of inoculum (R4), were evaluated for 6 months. In addition, the 19
algal-bacterial biomass concentration, removal of organic matter, nutrients and heavy 20
metals were also assessed. The results revealed a high diversity and rapid variations in 21
the structure of microalgae populations, Chlorella sp. being dominant in R4 throughout 22
most of the operational period. Steady state average biomass concentration ranged from 23
2445-2610 mg/L in R1-R3 to 3265 mg/L in R4. No significant differences were 24
recorded in the removal efficiencies (REs) of total organic carbon (86-87%), inorganic 25
*Manuscript
2
carbon (62-71%), total nitrogen (82-85%) and total phosphorous (90-92%). Finally, Zn-26
REs accounted for 26% in R3, 37% in R2, and 49% in R1 and R4. 27
28
Keywords: Algal-bacterial processes; biomass production; heavy metal removal; 29
microalgae dynamics; piggery wastewater treatment. 30
31
1. Introduction 32
The current global energy and climate change crisis has triggered the quest for 33
alternative green energy sources with a low carbon dioxide (CO2) footprint
(González-34
Fernández et al., 2012a). In this context, microalgae have emerged as a promising 35
renewable energy platform due to their ability to transform sunlight directly into gas 36
biofuels (i.e H2) or an organic biomass feedstock that can be further bioconverted into
37
multiple liquid and gas biofuels (Richmond, 2004). Thus, microalgal biomass can be 38
anaerobically digested yielding biogas (CH4 + CO2) and a nutrient rich digestate
39
(Ehimen et al., 2011; González-Fernández et al., 2012b). In addition, while the lipid 40
fraction of microalgae can be transesterified into biodiesel (Vimalarasan et al., 2011), 41
the carbohydrate fraction can be fermented into bioethanol (Naik et al., 2010) or 42
biohydrogen (Chandrasekhar et al., 2015). Microalgae exhibit multiple advantages over 43
conventional energy crops such as high areal productivities (50-100 tn/ha·y), cultivation 44
in non-arable land (preventing competition with food) and high lipid or carbohydrate 45
fractions depending on the cultivation conditions. Likewise, microalgae can be 46
cultivated in fresh, marine or wastewaters (Cheah et al., 2016). 47
48
In this context, nutrient-rich wastewaters represent a valuable feedstock to reduce the 49
3
cultivation, which will ultimately increase the cost-competitiveness of microalgae-based 51
biofuels (Acién et al., 2016). Algal-bacterial symbiosis can combine a low-cost mass 52
production of biomass with the treatment of wastewater to levels required for discharge 53
into natural water bodies. Indeed, both domestic, industrial and livestock wastewaters 54
have successfully supported microalgae cultivation (Muñoz et al., 2003; Muñoz and 55
Guieysse, 2006). During microalgae-based wastewater treatment, both the organic 56
carbon, nitrogen and phosphorous present in the residual effluent are assimilated into 57
algal-bacterial biomass. Heavy metals and pathogens are also efficiently removed 58
during microalgae growth as a result of adsorption and pH-mediated mechanisms. 59
Despite microalgae cultivation in wastewater entails significant economic and 60
environmental advantages over axenic mass production of microalgae in mineral salt 61
media, controversy still exists in literature about the possibility of maintaining 62
monoalgal cultures with a constant biomass composition during microalgae-based 63
wastewater treatment. This is central to the development of microalgae-based 64
biorefineries for biofuel production, whose viability depends on the supply of a biomass 65
with a consistent year-round composition and characteristics. Hence, while most studies 66
conducted under laboratory or outdoors conditions focused on the removal of key 67
pollutants present in wastewater, little attention has been paid to the monitoring of the 68
dynamics of microalgae population. 69
70
Pig production is a key economic sector in many countries in Europe, accounting for 71
148.7 million pigs heads and 44.3% of the total European livestock (EU, 2015; 72
MAGRAMA, 2015) in 2015. European pig farming generates 217- 434 million m3/y (4-73
8 L/day/pig) of piggery wastewater containing high concentrations of organic matter 74
4
load present in EU piggery wastewaters in 2015 amounted to 8.923.000 tn chemical 76
oxygen demand (COD)/y, 890.000 tn nitrogen (N)/yand 223.000 tn phosphorous (P)/y 77
(EU, 2016). In addition, piggery wastewater can contain high concentrations of heavy 78
metals such as Zinc and Copper, typically used as growth promoters in swine nutrition 79
(Abe et al., 2012; De la Torre et al., 2000). 80
81
The experimental work herein conducted evaluated the dynamics of microalgae 82
population during piggery wastewater treatment in four opencontinuous 83
photobioreactors inoculated with two green microalgae species, a cyanophyta, and 84
without inoculum. In addition, the influence of the microalgae inoculum on the steady 85
state organic matter, nutrient and heavy metal removal was assessed. 86
87
2. Materials and methods
88
2.1. Microalgae
89
Chlorella minutissima Fott and Nováková was obtained from an indoor high rate algal 90
pond (HRAP) treating centrate at the Dept. of Chemical Engineering and Environmental 91
Technology from Valladolid University (Spain). Acutodesmusobliquus and Oscillatoria 92
sp were kindly provided by the Department of Chemical Engineering from Almeria 93
University (Spain). 94
95
2.2.Piggery wastewater
96
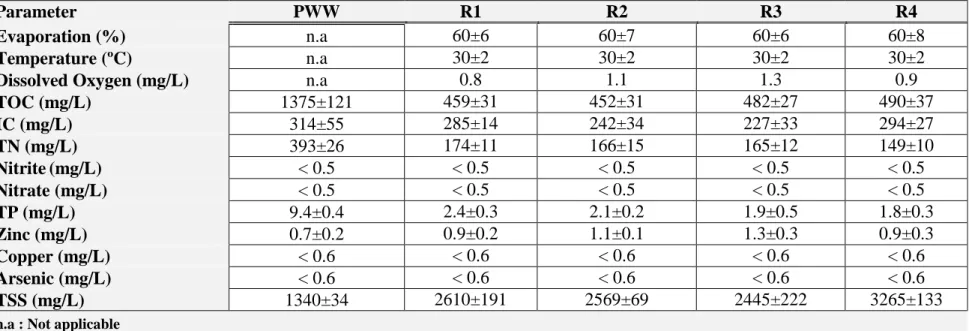
Fresh centrifuged piggery wastewater (PWW) was collected at a nearby farm at 97
Cantalejo (Spain) and stored at 4°C. The average composition of the piggery wastewater 98
5
total organic carbon (TOC), 314±55 mg/L of inorganic carbon (IC), 393±26 mg/L of 100
total nitrogen (TN), 9.4±0.4 mg/L of total phosphorus (TP) and 0.7±0.2 mg/L of zinc 101
(Zn). Nitrate (NO3-), nitrite (NO2-), copper (Cu) and arsenic (As) concentrations
102
remained below detection limit (Table 1). 103
104
<Table 1> 105
106
2.3. Experimental set-up
107
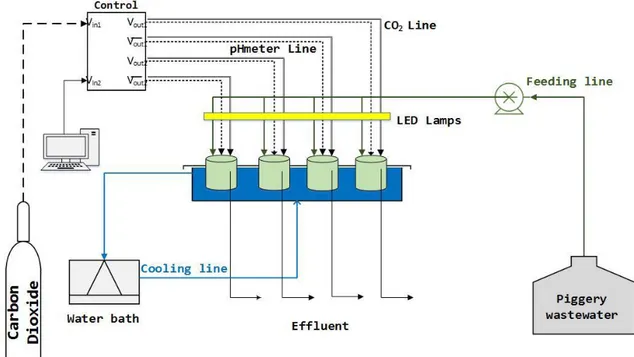
The experimental set-up consisted of four 15.8 cm deep 3 L open photobioreactors 108
illuminated at 2800 µmol/m2·s for 12 hours a day (08h00 to 20h00) by LED lamps 109
arranged in a horizontal configuration 20 cm above the photobioreactor surface 110
(Figure1). The photobioreactors were immersed in a water bath to prevent the high 111
temperatures imposed by the LEDs irradiation. Immersion water pumps were used to 112
mix the algal-bacterial cultivation broth in the reactors. The photobioreactors were fed 113
with piggery wastewater diluted at 15% using an auto control 205U7CA multi-channel 114
cassette pump (Watson-Marlow, UK). The pH in the cultivation broth was 115
automatically maintained at 8.0 via CO2 addition (CARBUROS METALICOS-
116
Barcelona, Spain) using a Crison multimeter M44 control unit (Crison Instruments, 117
Spain). 118
119
˂ Figure 1˃ 120
121
2.4. Experimental design
6
Photobioreactors 1, 2 and 3 (namely R1, R2 and R3, respectively) were inoculated with 123
Chlorella minutissima Fott and Nováková, Acutodesmusobliquus and Oscillatoria sp., 124
respectively,at an initial TSS concentration of 220 mg/L (corresponding to initial cell 125
concentrations of 1.750, 0.295 and 0.332·109 cells/L, respectively). Photobioreactor 4 126
(R4) was not inoculated and served as control. The photobioreactors, which were 127
initially filled with tap water, were operated at a hydraulic retention time (HRT) of ≈ 27 128
days (estimated based on the influent PWW) for 176 days. Photobioreactors effluents 129
overflowed separately as a function of the evaporation rates. Liquid samples of 30 mL 130
were weekly drawn from the influent PWW and effluent of R1, R2, R3 and R4 to 131
determine the concentrations of TOC, IC, TN, NO2-,NO3-, TP and TSS. Effluent
132
samples were filtered through 1 µm glass fiber filters prior analysis. Likewise, the 133
microalgae population structure in R1, R2, R3 and R4 was weekly assessed from 134
biomass samples preserved with lugol acid at 5% and formaldehyde at 10%, and stored 135
at 4 ºC prior to analysis (only 8 samples from each photobioreactor were analyzed). The 136
dissolved oxygen and temperature of the cultivation broths were measured twice per 137
day, while the influent and effluent flowrates were daily recorded in all 138
photobioreactors to monitor water evaporation losses. Finally, the C, N and P content of 139
the algal bacterial biomass was measured under steady state at the end of the 140
experiment. 141
142
The C, N and P removal efficiencies (RE) were calculated according to Eq. (1): 143
(1)
144
where Cfeed and Ceff represent the dissolved concentrations of TOC, IC, TN, TP and Zn
145
7
the PWW and effluent flow rates. The process was considered under steady state when 147
the TSS concentrations in the photobioreactors remained stable for at least four 148
consecutive samplings (~ 1 month). The results were here provided as the average ± 149
standard deviation from duplicate measurements along one month of steady state (days 150
150-176). 151
152
2.5 Analytical procedures
153
A Crison M44 multimeter and a Crison PH 28meter were used for the on-line 154
measurement of the pH. Dissolved oxygen (DO) and temperature (T) were recorded 155
using an OXI 330i oximeter (WTW, Germany). A LI-250A light meter (LI-COR 156
Biosciences, Germany) was used to measure the light intensity as photosynthetically 157
active radiation (PAR). TOC, IC and TN concentrations were determined using a TOC-158
V CSH analyzer equipped with a TNM-1 module (Shimadzu, Japan). Nitrate and nitrite 159
were analyzed by high performance liquid chromatography-ion conductivity (HPLC-IC) 160
in a Waters 515 HPLC pump coupled with a Waters 432 ionic conductivity detector and 161
equipped with an IC-Pak Anion HC (150 mm × 4.6 mm) column. TSS and TP 162
concentrations were determined according to Standard Methods (APHA, 2005). The 163
analysis of the C, N and P content in the algal-bacterial biomass was carried out using a 164
LECO CHNS-932 elemental analyzer with pre-dried and grinded algal-bacterial 165
biomass. The concentration of Zn, Cu and As was determined using a 725-ICP Optical 166
Emission Spectrophotometer (Agilent, USA) at 213.62. The identification and 167
quantification of microalgae were conducted by microscopic examination (OLYMPUS 168
IX70, USA) according to Phytoplankton Manual (Sournia, 1978). 169
8
3.
Results and Discussion
171
3.1. Dynamics of microalgae population
172
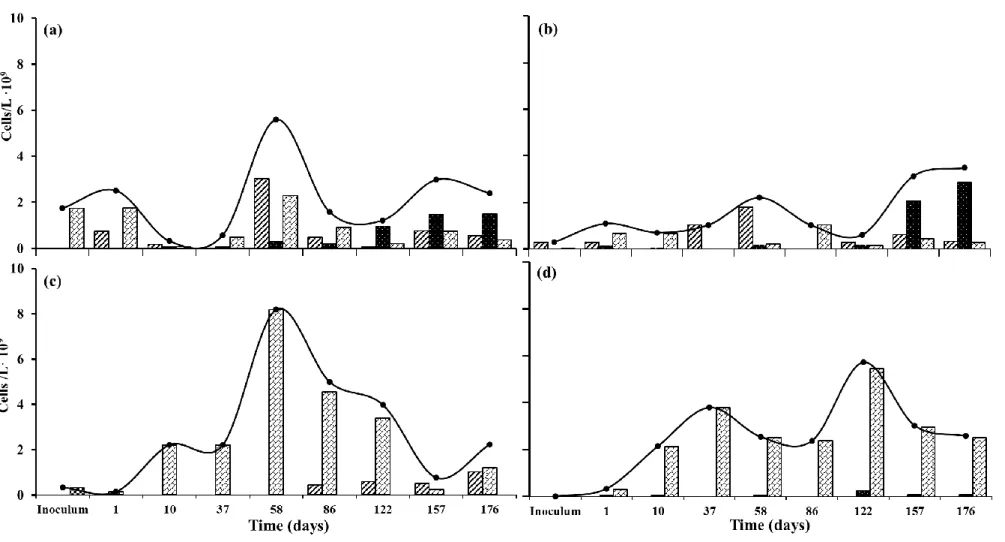
Chlorella sp., the inoculated microalgae species in R1, was detected throughout most of 173
the experimental period in this photobioreactor and dominant at days 37 and 86 (at 174
concentrations of 0.5·109 and 0.9·109 cells/L, respectively). Acutodesmus obliquus was 175
also identified in R1 and became the dominant species by day 58. Finally, Aphanothece 176
sp. was detected for the first time by day 58 and was dominant from day 122 to the end 177
of the operation of R1 (Figure 2a). Similarly, the inoculated microalga species in R2 178
(Acutodesmus obliquus) was identified along the entire photobioreactor operation, with 179
a significant dominance by days 37, 58 and 122 at cell concentrations of 1.3·109, 180
1.8·109 and 0.3·109 cells/L, respectively. Chlorella sp. was identified in R2 from the 181
first operational days and remained at similar cell concentrations throughout the entire 182
experiment (from 0.3·109 to 0.7·109 cells/L). Finally, Aphanothece sp. became 183
dominant in R2 by the end of operation, with final cell concentrations of 2.9·109 cells/L 184
(Figure 2b). Oscillataria sp. was replaced by Chlorella sp. and Acutodesmus obliquus in 185
R3 from the first operational days(after the inoculation a change in color from green to 186
red was noticed), Chlorella sp. being the dominant species throughout the entire 187
operation with a maximum concentration of 8.2·109 cells/L by day 58 (Figure 2c). The 188
higher pollution-tolerance of Chlorella sp. to PWW, combined with the high 189
temperature and irradiations prevailing in this study, could have caused this rapid 190
replacement of Oscillatoria sp (Talbot et al., 1991). Despite R4 was not inoculated, 191
Chlorella sp. and Aphanothece sp. were present in the photobioreactor from the first 192
9
gradual increase in number of cells of Aphanothece sp. in R1, R2 and R4 suggest the 194
influence of the characteristics of the PWW on microalgae population (Figure 2). 195
196
The higher dominance of Chlorella sp. in the four photobioreactors confirmed the high 197
tolerance of this green microalgae to the pollutants and concentrations typically present 198
in PWW (Kim et al., 2016; Kuo et al., 2015; Yuan et al., 2013). Indeed, the high 199
abundance of Acutodesmus obliquus and Chlorella sp. (both belonging to the 200
Chlorophyta phylum) along the experimental period in R1, R2 and R3 matched the 201
microalgae pollution-tolerance classification reported by Palmer et al. (1969), who 202
ranked Scenedesmus and Chlorella 4th and 5th, respectively. It can be hypothesized that 203
organic pollution exhibited a higher influence on microalgae population structure than 204
other environmental parameters such as water hardness, light intensity, pH, DO or 205
temperature (Palmer, 1969). On the other hand, Aphanothece sp., which was not 206
previously classified as a pollution tolerant microalga, was mainly identified at the end 207
of experiment in R1 and R2 (Palmer, 1969). However, Aphanothece microscopica 208
nägeli and Aphanothece Clathrata successfully supported the removal of organic matter 209
and nitrogen from parboiled rice wastewater (REs of 83.4 and 72.7% for COD and N-210
TKN, respectively) in a 4.5 L tubular photobioreactor operated batchwise for 24 hours 211
(Queiroz et al., 2007). Likewise, Bastos et al. (2014) reported COD and N-TKN REs of 212
97 and 78%, respectively, in a 4L batch tubular reactor treating parboiled rice 213
wastewater for 24 hours. 214
215
The lack of monoalgal cultures in the four photobioreactors throughout the 216
experimental period and the rapid variations in microalgae population structure here 217
10
during the treatment of PWW in open systems (Posadas et al., 2015). In this context, a 219
lower microalgae diversity was observed at higher biomass concentrations, which was 220
in agreement with Park et al. (2011). In addition, the current morphological microalgae 221
characterization revealed that the inoculation of a photobioreactor during PWW 222
treatment with a specific microalga does not guarantee its long-term dominance (Serejo 223
et al., 2015). Finally, it should be stressed that the different microalgae cells 224
concentration in the inoculum of the photobioreactors (1.750, 0.295 and 0.332·109 225
cells/L for R1, R2 and R3, respectively) only affected the time required to reach steady 226
state and the initial treatment performance, but it did not modify the conclusions here 227
obtained since the performance of the systems was analyzed at constant under steady 228
state. 229
230
˂ Figure 2˃ 231
232
3.2. Biomass concentration and productivity
233
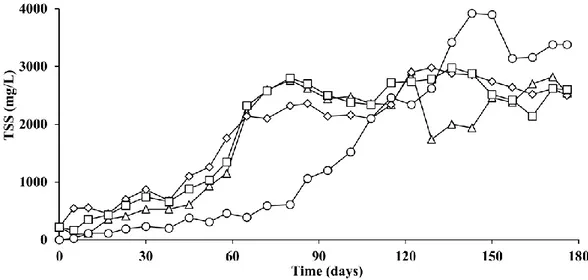
Biomass concentration in R1, R2 and R3 increased from 220 mg TSS/L to 530, 680, 234
and 660 mg TSS/L, respectively, during the first 38 days. A moderate increase from 0 to 235
200 mg TSS/L was also recorded in R4 (Figure 3). A significant biomass concentration 236
increase occurred in R1, R2 and R3 from the day 38 to 93, when TSS concentrations of 237
2440, 2140 and 2500 mg TSS/L, respectively, were measured. However, a lower 238
biomass growth rate was observed during this period in R4, where concentrations up to 239
1200 mg TSS/L were recorded (Figure 3). Biomass concentration in R2 and R3 240
remained constant from day 93 onwards at average concentrations of 2569±69 and 241
2445±222 mg TSS/L, respectively. Biomass concentration in R1 fluctuated from day 93 242
11
concentrations reached in R2 and R3 (Figure 3). On the other hand, biomass 244
concentration exponentially increased in R4 from day 93, to reach average value of 245
3265±133 mg TSS/L by the end of the experiment. Surprisingly, the highest algal-246
bacterial biomass concentration under steady state was achieved in the non-inoculated 247
photobioreactor despite its longer lag phase. Likewise, the highest TOC, IC, TN, TP and 248
Zn REs (below discussed) were obtained in R4, which highlighted the higher robustness 249
of native microalgae species acclimated to the environmental and operational conditions 250
prevailing during PWW treatment (Figures 2 and 3, Table 1) (Olguín et al., 2013). In 251
addition, the results clearly showed a similar biomass growth pattern in the 252
photobioreactors inoculated with a specific photosynthetic microorganisms in 253
comparison with the control unit R4. 254
255
The high biomass concentrations here recorded were supported by the high carbon and 256
nutrients concentrations in the diluted PWW and by the high water evaporation rates in 257
the systems, which accounted for 60 % of the influent PWW in all photobioreactors as 258
noticed by Guieysse et al. (2013) (Table 1). Hence, biomass productivities under steady 259
state averaged 6.2±0.5, 6.1±0.2, 5.8±0.6 and 7.8±0.3 g/m2·d in R1, R2, R3 and R4, 260
respectively. These productivities were comparable to those obtained during the 261
treatment of secondary domestic wastewater treatment in pilot raceways at high HRT in 262
Almeria (Spain), and were likely limited by the long HRT needed to ensure satisfactory 263
organic matter and nutrients removals (Posadas et al., 2015). 264
265
Finally, the comparison between the evolution of the total number of microalgae cells in 266
the cultures and the TSS concentrations (Figures 2 and 3) showed no direct correlation 267
12
the high biodegradable organic matter load. In this regard, an accurate empirical 269
determination of the individual bacteria and microalgae populations would bring 270
valuable insights about the mechanisms underlying organic matter and nutrient removal 271
during PWW treatment. 272
273
˂ Figure 3˃ 274
275
3.3 Carbon and nutrient removal
276
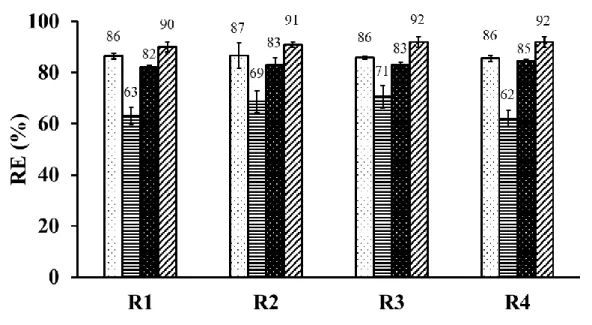
A comparable bioremediation performance in terms of TOC, IC, TN and TP removal 277
was recorded regardless of the microalgae inoculated in the photobioreactor (Figure 4 278
and Table 1). In this context, the dominant microalgae species prevailing in the 279
photobioreactor did not influence process performance. In this particular study, the high 280
light irradiances and the optimum temperature for microbial activity supported an 281
effective PWW treatment. Thus, despite the low DO concentrations in the cultivation 282
broth (≤1.3 mg/L), TOC-REs accounted for 86±1, 87±5, 86±1 and 86±1 % in R1, R2, 283
R3 and R4, respectively, which resulted in average TOC concentrations in the effluent 284
at the end of the operational period of 459±31, 452±31, 482±27 and 490±37 mg/L, 285
respectively (Figure 4 andTable 1). Please note that the high water evaporation rates 286
typically encountered in open photobioreactors resulted in moderately high effluent 287
TOC concentration despite the high removal efficiencies achieved. The results herein 288
obtained confirmed the consistent removal of organic matter from PWW by algal-289
bacterial processes and were in agreement with the study conducted by De Godos et al. 290
(2009), who reported COD removal efficiencies of 76±11% in a 464 L high rate algal 291
ponds (HRAP) during the treatment of 20 and 10 folds diluted PWW. Similarly, IC-REs 292
13
and R4, respectively, which resulted in IC concentrations in the cultivation broth of the 294
photobioreactors of 285±14, 242±34, 227±33 and 294±27 mg/L, respectively (Figure 4 295
and Table 1). These high IC-REs were promoted by the intensive photosynthetic 296
activity during the illuminated period over the 176 days of operation. However, carbon 297
removal by stripping (prior mineralization of the organic carbon to CO2) was the main
298
mechanism accounting for carbon fate, since only 37, 38, 36 and 48 % of the total 299
carbon removed was recovered in the harvested biomass in R1, R2, R3 and R4, 300
respectively, under steady state conditions.This estimation was based on the carbon 301
content of the biomass under steady state (as described below) and did not account for 302
the CO2 input for pH control.
303
304
TN-REs of 82±1, 83±3, 83±1 and 85±1 % were recorded under steady state in R1, R2, 305
R3 and R4, respectively, which resulted in TN concentrations in the photobioreactor 306
effluent of 174±11, 166±15, 165±12 and 149±10 mg/L, respectively (Figure 4 and 307
Table 1). These high TN effluent concentrations in spite of the effective nitrogen 308
removal efficiencies were due to the high evaporation rates in the photobioreactors. The 309
TN-REs here recorded were similar to those reported by De Godos et al. (2009), who 310
measured average total kjeldahl nitrogen (TKN) removals of 86±6% during PWW 311
treatment in an open HRAP, and higher than the TN-REs of 63% obtained during the 312
treatment of PWW under laboratory conditions in a 500 ml conical flasks incubated on 313
a rotatory shaker at 27 ºC and 150 rpm under continuous illumination (Abou-Shanab et 314
al., 2013). Likewise, Posadas et al., (2017) operated an outdoors HRAP supporting TN-315
REs of 80-86% during the treatment of centrate. Nitrogen removal by stripping was the 316
main mechanism in our study, since only 26, 26, 23 and 31 % of the total nitrogen 317
14 319
On the other hand, steady state TP-REs of 90±2 , 91±1, 92±2 and 92±2 % were 320
recorded in R1, R2, R3 and R4, respectively, which supported effluent TP 321
concentrations of 2.4±0.3, 2.1±0.2, 1.9±0.5 and 1.8±0.3 mg/L, respectively (Figure 4, 322
Table1). The TP-REs as (P-PO43-) herein obtained were similar to those reported by
323
Posadas et al., (2017) during the treatment of centrate in an outdoors HRAP (84 - 92%). 324
Likewise, the TP-REs reported were in agreement with Franchino et al. (2016), who 325
recorded phosphate REs > 90% during the treatment of 5 and 10 times diluted digestate 326
in 250 ml flasks. Phosphorous assimilation into algal-bacterial biomass was the main 327
removal mechanism in the photobioreactors based on the moderate pH values prevailing 328
in the photobioreactors during the entire experiment (pH=8), which did not support a 329
significant phosphate precipitation (García et al., 2017). Thus, a phosphorus mass 330
balance revealed that93, 93, 96 and 100 % of the total phosphorus removed was 331
recovered in the harvested biomass for R1, R2, R3 and R4, respectively. 332
Overall, it is worth noting that a similar macroscopic bioremediation performance was 333
recorded in the photobioreactors in spite of the different microalgae population 334
structures under steady state (and during most of the experiment period), which suggest 335
that bacteria played a dominant role during the treatment of high strength wastewaters 336
such as piggery effluents. 337
338
˂ Figure 4˃ 339
340
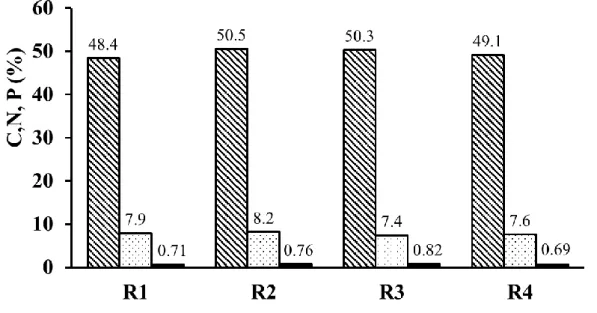
Finally, comparable carbon, nitrogen and phosphorus contents were measured in the 341
harvested biomass under steady state regardless of the initial inoculum, with average 342
15
elemental biomass compositions were similar to those reported by Posadas et al. (2013) 344
during domestic wastewater treatment in a 15 L algal-bacterial biofilm photobioreactor 345
(42±2, 7±1 and 1.3±0.3 % for C, N and P, respectively), despite the different C/N/P 346
ratio in both wastewaters (C/N/P of 100/15.6/0.6 in PWW and 100/18/5 in domestic 347
wastewater). Likewise, these results were in agreement with those obtained by 348
Cabanelas et al. (2013), who reported a C, N and P content in the harvested biomass of 349
≈ 44, 7.5 and 0.5 %, respectively, in a photobioreactor inoculated with Chlorella 350
vulgaris and supplemented with CO2 during the treatment of effluent from primary
351
settler. In this context, the results herein obtained confirmed the similar algal-bacterial 352
biomass composition regardless of the microalgae species present in the cultivation 353
broth or operational conditions. 354
355
˂ Figure 5˃ 356
357
3.4. Heavy metals removal efficiency
358
The overall steady state Zn-REs in R1, R2, R3 and R4 accounted for 49±6, 37±6, 26±5 359
and 49±5 %, respectively, which resulted in average effluent Zn concentrations of 360
0.9±0.2, 1.1±0.1, 1.3±0.3 and 0.9±0.3 mg/L, respectively, at the end of the operational 361
period (Table 1). These values were similar (Zn-REs of 37%) to those reported by Abe 362
et al. (2008) during PWW treatment in wetlands. The fact that the highest Zn-REs 363
occurred in the photobioreactors with the highest biomass concentrations (R1 and R4) 364
and the lowest Zn-RE in R3 (at the lowest biomass concentration) suggested that Zn 365
removal was mediated by biosorption onto the algal-bacterial biomass present in the 366
photobioreactor (Table 1) (Kaplan et al., 1987; Muñoz et al., 2006). This showed the 367
16
al., 2006). Higher Zn-REs by biosoportion would be expected at higher pHs according 369
to Muñoz et al. (2006), who observed an increase in Zn accumulation into the algal-370
bacterial biomass from 5.0 to 11.7 mg Zn/g biomass when pHs was raised from 7 to 9, 371
respectively. The determination of copper and arsenic removal efficiencies was not 372
possible based on the low concentrations of these metals in the PWW (below the 373
detection limit of the instrument = 0.6 mg/L). 374
375
4. Conclusions
376
This research revealed the difficulty to maintain monoalgal cultures during PWW 377
treatment in open-photobioreactors operated under similar environmental and 378
operational conditions. The high abundance of Chlorella sp. in most photobioreactors 379
confirmed the high tolerance of this microalga to the pollutants. The acclimation of 380
native species to the characteristics of the PWW resulted in highest biomass 381
concentrations. An efficient PWW treatment occurred regardless of the microalgae 382
species inoculated, which confirmed the robustness of algal-bacterial processes devoted 383
to carbon and nutrient removals from livestock wastewaters. Finally, the heavy metals 384
can be removed by biosorption into the algal-bacterial biomass produced during PWW 385
bioremediation. 386
387
5. Acknowledgments
388
This research was supported by INIA, the European FEDER program (RTA2013-389
00056-C03-02), the Regional Government of Castilla y León (Project VA024U14 and 390
17
ERASMUS MUNDUS EURICA and Universidad Nacional Autónoma de Nicaragua 392
(UNAN-Managua) are also gratefully acknowledged. 393
394
References
3951. Abe, K., Waki, M., Suzuki, K., Kasuya, M., Suzuki, R., Itahashi, S., Banzai, K., 396
2012. Estimation of Zn and Cu unit output loads from animal husbandry facilities. 397
Water Sci. Technol. 66, 653–658. doi:10.2166/wst.2012.224 398
2. Abou-Shanab, R.A.I., Ji, M.-K., Kim, H.-C., Paeng, K.-J., Jeon, B.-H., 2013. 399
Microalgal species growing on piggery wastewater as a valuable candidate for nutrient 400
removal and biodiesel production. J. Environ. Manage. 115, 257–264. 401
doi:10.1016/j.jenvman.2012.11.022 402
3. Acién, F.G., Gómez-Serrano, C., Morales-Amaral, M.M., Fernández-Sevilla, 403
J.M., Molina-Grima, E., 2016. Wastewater treatment using microalgae: how realistic a 404
contribution might it be to significant urban wastewater treatment? Appl. Microbiol. 405
Biotechnol. 100, 9013–9022. doi:10.1007/s00253-016-7835-7 406
4. APHA, 2005. Standards Methods for the Examination of Water and Wastewater, 407
21 st. ed. American Public Health Association, American Water Works Association, 408
Water Enviroment Federation, Washington,D.C. 409
5. Bastos, R.G., Bonini, M. a., Zepka, L.Q., Jacob-Lopes, E., Queiroz, M.I., 2014. 410
Treatment of rice parboiling wastewater by cyanobacterium Aphanothece microscopica 411
Nägeli with potential for biomass products. Desalin. Water Treat. 3994, 1–7. 412
doi:10.1080/19443994.2014.937758 413
6. Cabanelas, I.T.D., Ruiz, J., Arbib, Z., Chinalia, F.A., Garrido-Pérez, C., Rogalla, 414
F., Nascimento, I.A., Perales, J.A., 2013. Comparing the use of different domestic 415
18
Technol. 131, 429–436. doi:10.1016/j.biortech.2012.12.152 417
7. Chandrasekhar, K., Lee, Y.-J., Lee, D.-W., 2015. Biohydrogen Production: 418
Strategies to Improve Process Efficiency through Microbial Routes. Int. J. Mol. Sci. Int. 419
J. Mol. Sci 16, 8266–8293. doi:10.3390/ijms16048266 420
8. Cheah, W.Y., Ling, T.C., Show, P.L., Juan, J.C., Chang, J.S., Lee, D.J., 2016. 421
Cultivation in wastewaters for energy: A microalgae platform. Appl. Energy 179, 609– 422
625. doi:10.1016/j.apenergy.2016.07.015 423
9. De Godos, I., Blanco, S., García-Encina, P.A., Becares, E., Muñoz, R., 2009. 424
Long-term operation of high rate algal ponds for the bioremediation of piggery 425
wastewaters at high loading rates. Bioresour. Technol. 100, 4332–4339. 426
doi:10.1016/j.biortech.2009.04.016 427
10. De la Torre, A.I., Jiménez, J.A., Carballo, M., Fernandez, C., Roset, J., Muoz, 428
M.J., 2000. Ecotoxicological evaluation of pig slurry. Chemosphere 41, 1629–1635. 429
doi:10.1016/S0045-6535(00)00038-2 430
11. Ehimen, E.A., Sun, Z.F., Carrington, C.G., Birch, E.J., Eaton-Rye, J.J., 2011. 431
Anaerobic digestion of microalgae residues resulting from the biodiesel production 432
process. Appl. Energy 88, 3454–3463. doi:10.1016/j.apenergy.2010.10.020 433
12. EU, 2016. https://ec.europa.eu/info/legal-notice_en [WWW Document]. URL 434
http://appsso.eurostat.ec.europa.eu/nui/show.do?dataset=apro_mt_lspig&lang=en 435
(accessed 11.7.16). 436
13. EU, 2015. http://ec.europa.eu [WWW Document]. URL 437
http://ec.europa.eu/eurostat/statistics-explained/index.php/Agricultural_production_-438
_animals (accessed 1.10.17). 439
14. Franchino, M., Tigini, V., Varese, G.C., Mussat Sartor, R., Bona, F., 2016. 440
19
digestate. Sci. Total Environ. 569, 40–45. doi:10.1016/j.scitotenv.2016.06.100 442
15. García, D., Alcántara, C., Blanco, S., Pérez, R., Bolado, S., Muñoz, R., 2017. 443
Enhanced carbon, nitrogen and phosphorus removal from domestic wastewater in a 444
novel anoxic-aerobic photobioreactor coupled with biogas upgrading. Chem. Eng. J. 445
313, 424–434. doi:10.1016/j.cej.2016.12.054 446
16. González-Fernández, C., Sialve, B., Bernet, N., Steyer, J.., 2012a. Impact of 447
microalgae characteristic on their conversion to biofuel. Part I: Focus on cultivation and 448
biofuel production. Biofuels, Bioprod. Biorefining 105–113. doi:10.1002/bbb 449
17. González-Fernández, C., Sialve, B., Bernet, N., Steyer, J.., 2012b. Impact of 450
microalgae characteristics on their conversion to biofuel. Part II: Focus on biomethane 451
production. Biofuels, Bioprod. Biorefining 205–2018. doi:10.1002/bbb 452
18. Guieysse, B., Béchet, Q., Shilton, A., 2013. Variability and uncertainty in water 453
demand and water footprint assessments of fresh algae cultivation based on case studies 454
from five climatic regions. Bioresour. Technol. 128, 317–323. 455
doi:10.1016/j.biortech.2012.10.096 456
19. Kaplan, D., Cristiaen, D., Shoshana, A., 1987. Chelating Properties of 457
Extracellular Polysaccharides from Chlorella spp. Appl. Environ. Microbiol. 53, 2953– 458
2956. 459
20. Kim, H.-C., Choi, W.J., Chae, A.N., Park, J., Kim, H.J., Song, K.G., 2016. 460
Treating high-strength saline piggery wastewater using the heterotrophic cultivation of 461
Acutodesmus obliquus. Biochem. Eng. J. 110, 51–58. doi:10.1016/j.bej.2016.02.011 462
21. Kuo, C.M., Chen, T.Y., Lin, T.H., Kao, C.Y., Lai, J.T., Chang, J.S., Lin, C.S., 463
2015. Cultivation of Chlorella sp. GD using piggery wastewater for biomass and lipid 464
production. Bioresour. Technol. 194, 326–333. doi:10.1016/j.biortech.2015.07.026 465
20
Document]. URL http://www.magrama.gob.es/es/ganaderia/temas/produccion-y-467
mercados-ganaderos/sectores-ganaderos/porcino/ (accessed 10.18.16). 468
23. Muñoz, R., Alvarez, M.T., Muñoz, A., Terrazas, E., Guieysse, B., Mattiasson, 469
B., 2006. Sequential removal of heavy metals ions and organic pollutants using an 470
algal-bacterial consortium. Chemosphere 63, 903–11. 471
doi:10.1016/j.chemosphere.2005.09.062 472
24. Muñoz, R., Guieysse, B., 2006. Algal-bacterial processes for the treatment of 473
hazardous contaminants: A review. Water Res. 40, 2799–2815. 474
doi:10.1016/j.watres.2006.06.011 475
25. Muñoz, R., Köllner, C., Guieysse, B., Mattiasson, B., 2003. Salicylate 476
biodegradation by various algal-bacterial consortia under photosynthetic oxygenation. 477
Biotechnol. Lett. 25, 1905–1911. doi:10.1023/B:BILE.0000003980.96235.fd 478
26. Naik, S.N., Goud, V. V., Rout, P.K., Dalai, A.K., 2010. Production of first and 479
second generation biofuels: A comprehensive review. Renew. Sustain. Energy Rev. 14, 480
578–597. doi:10.1016/j.rser.2009.10.003 481
27. Olguín, E.J., Mendoza, A., González-Portela, R.E., Novelo, E., 2013. Population 482
dynamics in mixed cultures of Neochloris oleoabundans and native microalgae from 483
water of a polluted river and isolation of a diatom consortium for the production of lipid 484
rich biomass. N. Biotechnol. 30, 705–715. doi:10.1016/j.nbt.2013.03.003 485
28. Palmer, C.M., 1969. A composite rating of algae tolerating organic pollution. J. 486
Phycol. 5, 78–82. doi:10.1111/j.1529-8817.1969.tb02581.x 487
29. Park, J.B.K., Craggs, R.J., Shilton, A.N., 2011. Recycling algae to improve 488
species control and harvest efficiency from a high rate algal pond. Water Res. 45, 6637– 489
6649. doi:10.1016/j.watres.2011.09.042 490
21
R., 2013. Carbon and nutrient removal from centrates and domestic wastewater using 492
algal-bacterial biofilm bioreactors. Bioresour. Technol. 139, 50–58. 493
doi:10.1016/j.biortech.2013.04.008 494
31. Posadas, E., Marín, D., Blanco, S., Lebrero, R., Muñoz, R., 2017. Simultaneous 495
biogas upgrading and centrate treatment in an outdoors pilot scale high rate algal pond. 496
Bioresour. Technol. doi:10.1016/j.biortech.2017.01.071 497
32. Posadas, E., Morales, M.D.M., Gomez, C., Acién, F.G., Muñoz, R., 2015. 498
Influence of pH and CO2 source on the performance of microalgae-based secondary 499
domestic wastewater treatment in outdoors pilot raceways. Chem. Eng. J. 265, 239–248. 500
doi:10.1016/j.cej.2014.12.059 501
33. Posadas, E., Serejo, M.L., Blanco, S., Pérez, R., García-Encina, P.A., Muñoz, R., 502
2015. Minimization of biomethane oxygen concentration during biogas upgrading in 503
algal-bacterial photobioreactors. Algal Res. 12, 221–229. 504
doi:10.1016/j.algal.2015.09.002 505
34. Queiroz, M.I., Lopes, E.J., Zepka, L.Q., Bastos, R.G., Goldbeck, R., 2007. The 506
kinetics of the removal of nitrogen and organic matter from parboiled rice effluent by 507
cyanobacteria in a stirred batch reactor. Bioresour. Technol. 98, 2163–2169. 508
doi:10.1016/j.biortech.2006.08.034 509
35. Richmond, A., 2004. Handbook of microalgal culture: biotechnology and 510
applied phycology/edited by Amos Richmond. doi:10.1002/9780470995280 511
36. Serejo, M.L., Posadas, E., Boncz, M.A., Blanco, S., García-Encina, P., Muñoz, 512
R., 2015. Influence of Biogas Flow Rate on Biomass Composition During the 513
Optimization of Biogas Upgrading in Microalgal-Bacterial Processes. Environ. Sci. 514
Technol. 3228–3236. doi:10.1021/es5056116 515
22
38. Talbot, P., Thébault, J.., Dauta, A., De la Noüe, J., 1991. A comparative study 517
and mathematical modeling of temperature, light and growth of three microalgae 518
potentially useful for wastewater treatment. Water Res. 25, 465–472. doi:10.1016/0043-519
1354(91)90083-3 520
39. Vimalarasan, A., Pratheeba, N., Ashokkumar, B., Sivakumar, N., Varalakshmi, 521
P., 2011. Production of biodiesel from cyanobacteria (Oscillatoria annae) by alkali and 522
enzyme mediated transesterification. J. Sci. Ind. Res. (India). 70, 959–967. 523
40. Yuan, Z., Wang, Z., Takala, J., Hiltunen, E., Qin, L., Xu, Z., Qin, X., Zhu, L., 524
2013. Scale-up potential of cultivating chlorella zofingiensis in piggery wastewater for 525
biodiesel production. Bioresour. Technol. 137, 318–325. 526
doi:10.1016/j.biortech.2013.03.144 527
23
Figure captions
529
Figure 1. Schematic diagram of the algal-bacterial photobioreactor set-up using carbon 530
dioxide supplementation for pH control. 531
Figure 2. Time course of microalgae population structure in (a) R1, (b) R2, (c) R3 and 532
(d) R4. Acutodesmus obliquus ( ), Aphanothece sp. ( ), Chlorella sp. ( ), Oscillatoria 533
sp. ( ) and total number of microalgae cells (■). 534
Figure 3.Time course of TSS concentration in R1 (∆), R2 (◊), R3 (□) and R4 (○).
535
Figure 4. Average removal efficiencies of TOC ( ), IC ( ), TN ( ) and TP ( ) 536
under steady state. Vertical bars represent the standard deviation from replicate 537
measurements during steady state operation. 538
Figure 5. C ( ), N ( ), and P ( ) content in the biomass present in the 539
Figure 1. Schematic diagram of the algal-bacterial photobioreactor set-up using carbon
dioxide supplementation for pH control.
Figure
Figure 2. Time course of microalgae population structure in (a) R1, (b) R2, (c) R3 and (d) R4. Acutodesmus obliquus ( ), Aphanothece sp. ( ), Chlorella sp. ( ), Oscillatoria sp. ( ) and total number of microalgae cells (●).
Figure
Figure 3.Time course ofTSS concentration inR1 (∆), R2(◊), R3(□)andR4 (○).
Figure
Figure 4. Average removal efficiencies of TOC ( ), IC ( ), TN ( ) and TP ( )
under steady state. Vertical bars represent the standard deviation from replicate
measurements during steady state operation.
Figure
Figure 5. C ( ), N ( ) and P ( ) content in the biomass present in the
photobioreactors under steady state.
Figure
Table 1.. Physical/chemical characterization of the diluted swine manure and cultivation broth in the photobioreactors at steady state.
Parameter PWW R1 R2 R3 R4
Evaporation (%) n.a 60±6 60±7 60±6 60±8
Temperature (ºC) n.a 30±2 30±2 30±2 30±2
Dissolved Oxygen (mg/L) n.a 0.8 1.1 1.3 0.9
TOC (mg/L) 1375±121 459±31 452±31 482±27 490±37
IC (mg/L) 314±55 285±14 242±34 227±33 294±27
TN (mg/L) 393±26 174±11 166±15 165±12 149±10
Nitrite(mg/L) < 0.5 < 0.5 < 0.5 < 0.5 < 0.5
Nitrate (mg/L) < 0.5 < 0.5 < 0.5 < 0.5 < 0.5
TP (mg/L) 9.4±0.4 2.4±0.3 2.1±0.2 1.9±0.5 1.8±0.3
Zinc (mg/L) 0.7±0.2 0.9±0.2 1.1±0.1 1.3±0.3 0.9±0.3
Copper (mg/L) < 0.6 < 0.6 < 0.6 < 0.6 < 0.6
Arsenic (mg/L) < 0.6 < 0.6 < 0.6 < 0.6 < 0.6
TSS (mg/L) 1340±34 2610±191 2569±69 2445±222 3265±133
n.a : Not applicable
Electronic Annex