Validity of underlying cause of death statistics
in Hermosillo, Mexico
Mary H Freire de Carvalho, MPH, PhD,(1) Gerardo Álvarez-Hernández, MD, MPH, PhD,(2) Catalina Denman, PhD,(3) Siobán D Harlow, PhD.(1)
Freire de Carvalho MH, Álvarez-Hernández G, Denman C, Harlow SD. Validity of underlying cause of death statistics in Hermosillo, Mexico. Salud Publica Mex 2011;53:312-319.
Abstract
Objective. This paper assesses the quality of the underlying
cause of death (COD) statistics in Hermosillo, Mexico in a random sample of 300 in-hospital adult deaths. Material
and Methods. A “gold standard” COD, determined by a
systematic review of hospital medical charts, was compared to the COD reported by the vital registry system. Results. Overall agreement between the reviewer and original COD at the ICD-10 chapter block was 69.2%, with a weighted kappa of 0.62. Agreement varied greatly by ICD-10 chapter. Mutual misclassification among common co-morbidities, such as diabetes mellitus and circulatory disease, minimized the net change in the mortality fraction assigned to each ICD-10 chapter after physician review. Conclusions. The ICD-10 chapter level underlying COD codes can be used to estimate disease burden in the population. Caution is recommended for use of vital registry statistics in Hermosillo for individual level or disease-specific analyses.
Key words: Cause of death; data analysis; mortality registries; Mexico
Freire de Carvalho MH, Álvarez-Hernández G, Denman C, Harlow SD.
Validez de las estadísticas de causa básica de muerte en Hermosillo, México. Salud Publica Mex 2011;53:312-319.
Resumen
Objetivo. Examinar la validez de la causa básica de muerte
(CBM) de certificados de defunción de un sistema digital de vigilancia epidemiológica en Hermosillo, México. Material
y métodos. Se comparó la CBM originalmente codificada
en una muestra aleatoria de 300 certificados de defunción de muertes adultas ocurridas en al año 2005, con la CBM determinada por una revisión de expedientes médicos.
Re-sultados. Se identificó una concordancia global de 69.2%
entre la CBM original y la determinada por la revisión, con un coeficiente de kappa de 0.62. La concordancia varió, con errores de codificación en padecimientos como diabetes mellitus, enfermedades circulatorias y respiratorias y neo-plasias. El efecto de esos errores fue compensado por una mutua asignación equivocada en el proceso de codificación de la CBM empleado por el sistema. Conclusiones. Las es-tadísticas generadas por el sistema examinado pueden usarse con cautela para estimar la carga poblacional de mortalidad en Hermosillo, México.
Palabras clave: causa básica de muerte; análisis de datos; registros de mortalidad; México
(1) School of Public Health, University of Michigan. Ann Arbor, Michigan, USA.
(2) Departamento de Medicina y Ciencias de la Salud, Universidad de Sonora. Hermosillo, Sonora, México. (3) Centro de Estudios en Salud y Sociedad, El Colegio de Sonora. Hermosillo, Sonora, México.
Received on: August 2010 • Accepted on: May 2011
B
irth and death certificates provide essential data for health research and policy, as well as for program implementation and evaluation.1-3 In developing andtransition economy countries, vital registry data is often the only data available for tracking population health over time and for making evidence-based policy deci-sions to effectively address community health needs. Mexico has a well-established vital registry system dating back to 1950, with underlying cause of death available since 1955. When compared to the 192 coun-tries with regiscoun-tries globally, Mexico’s national vital registry system is of high quality, with 96% coverage of deaths and just 5% of deaths coded as ill-defined causes.1 In 2000, the Secretary of Health of the state of
Sonora began to digitalize its death certificate informa-tion, creating a valuable source of epidemiologic data for research and policy.
While studies of the quality of underlying cause of death statements have been conducted in various set-tings,4-15 information on the quality of adult death
certi-fication is limited in developing and transition economy countries.3 Studies from Latin America have focused on
the reliability of specific underlying causes of death or have been based on limited information across all disease categories.4,12-18 While annual assessments of the
qual-ity of vital registry data are published in Mexico at the national level,19 quality data at the state level is scant and
does not address the reliability of underlying cause of death statements. In 2003, Alvarez et al. investigated the quality of underlying cause of death data coded in the vital registry for a sample of infant deaths.20 That study
indicated a need to improve coding to ensure accurate interpretation of infant mortality patterns.
This paper assesses the quality of underlying cause of death statistics in Hermosillo, Mexico in a sample of adult deaths. This analysis directly addresses goals established for the betterment of the Mexican Health System’s National Health Information System (Sistema Nacional de Información en Salud; SINAIS), including: 1) improving the quality of health information and 2) strengthening the Mexican Center for the Classification of Disease.21
Material and Methods
This cross-sectional study assesses the reliability of in-hospital adult (age ≥15) mortality statistics from the Epidemiological and Death Statistics System (Sistema Epidemiológico y Estadístico de Defunciones; SEED) for 2005 in Hermosillo, the capital of Sonora (population 662 924). The SEED uses the international system for the classification of diseases and related health prob-lems (ICD-10) as recommended by the World Health
Organization. At the time this study was completed, the cause of death code was determined manually. The study was approved by the University of Michigan Institutional Review Board, the Ethics Committee of El Colegio de Sonora, the hospitals where medical record abstraction took place and the Secretary of Health of the state of Sonora.
In 2005, a total of 2 586 deaths occurred in adults 15 years of age and older residing in Hermosillo. Death certificate information was provided in a de-identified database from the SEED system, which included infor-mation on the underlying cause of death (ICD-10 code), age at death, sex (male/female), neighborhood of resi-dence, certifying personnel (attending physician/other physician), medical insurance enrollment (yes/no), type of hospital facility (for insured/for uninsured) and time of death based on usual hospital employment shifts (07:00-14:30 hrs./14:31-21:30 hrs./21:31-06:59 hrs.).
A sample of 300 in-hospital, non-accidental deaths in 2005 was selected at random from the SEED database. The study was limited to the two largest hospitals in Hermosillo, which in 2005 accounted for approximately 90% of total deaths in Hermosillo; one provides care for uninsured patients and one provides care for those with social security.22 Of the 300 deaths sampled, 111 (37%)
occurred in the hospital for the uninsured and 189 (63%) in the social security hospital.
Two physicians from the Secretary of Health, blinded to original underlying cause of death (COD) coding, used a standard form to review and abstract information on cause of death from the medical records. They underwent training to identify causes of death and to complete death certificates using the Center for Disease Control training manual.23 A standard chart abstraction form included:
1) a section for systematically reviewing test results and physician notes in medical charts and 2) a section identi-cal to the cause of death section of the WHO-approved death certificate used by the hospitals in Mexico.
This study was designed to mimic the process by which the vital registry underlying cause of death is assigned in Sonora, using fully trained and experienced physicians and a single nosologist trained in ICD-10 coding rules. The outcome of this process is the most accurate underlying COD that can be abstracted from hospital data, thus we use the reviewer underlying COD as the gold standard.
Data Analysis
The original underlying COD was compared to the reviewer underlying COD at the ICD-10 chapter level by calculating sensitivity, specificity, positive predictive values and negative predictive values. Cohen’s kappa was calculated to determine the level of agreement be-tween the reviewer and the original COD, beyond that expected by chance. Agreement was analyzed at the level of ICD-10 chapters and of 2-digit ICD-10 codes. A Kappa value greater than 0.75 was considered excellent agreement beyond chance; values from 0.61 to 0.74 were considered to reflect substantial agreement; from 0.41 to
0.60 moderate, and; values below 0.40 poor agreement. False-positive and false-negative percentages higher than 10% and 40%, respectively, were considered unac-ceptably high. To evaluate the effect of errors in the cod-ing of underlycod-ing CODs for mortality statistics, changes in cause-specific mortality fractions were estimated and a misclassification matrix was created.
Logistic regression was used to assess the associa-tion between the accuracy of the underlying COD and hypothesized predictor variables: time of death, whether the death certificate was filled out by the treating physi-cian, the hospital where death occurred, and age and sex of the deceased.24 Underlying CODs were categorized
into four broad categories: neoplasms, disease of the circulatory system, communicable diseases and other. All analyses were done in SAS 9.1.
Results
Table I shows the demographic characteristics of the full study population (n=300), the analysis population (n=250) and the missing data population (n=50). The
Table I
DemographiccharacteristicsofthestuDysampleofaDultDeaths ofresiDentsof hermosillo, mexicoin 2005
Full sample Analysis sample Missing sample Deaths Percent of total Deaths Percent of total Deaths Percent of total
Overall 300 100.00 250 83.00 50 17.00
Sex
Male 187 62.30 152 60.80 35 70.00
Female 113 37.70 98 39.20 15 30.00
Age
Mean 66 – 66 – 62 –
Range 19-97 – 19-97 – 32-91 –
<65 124 41.30 97 38.80 27 54.00*
65+ 176 58.70 153 61.20 23 46.00
Hospital
Hospital for insured 189 63.00 183 73.20 6 12.00*
Hospital for uninsured 111 37.00 67 26.80 44 88.00
Underlying COD
Communicable 15 5.00 14 5.60 1 2.00
Circulatory 86 28.70 69 27.60 17 34.00
Neoplasm 62 20.70 51 20.40 11 22.00
Other 137 45.70 116 46.40 21 42.00
Time of Death
7:00-14:30 99 33.00 73 29.20 16 32.00
14:31-21:30 94 31.30 75 30.00 18 36.00
21:31-6:59 107 35.70 102 40.80 16 32.00
Certifier
Treating physician 271 90.30 222 88.80 49 98.00*
Other 29 9.70 28 11.20 1 2.00
mean age of the analytical sample was 66.2 years, 26.8% were from the hospital for the uninsured and 88.8% were certified by the treating physician. The three leading causes of death, as originally coded, were diseases of the circulatory system (27.6%), neoplasms (20.4%) and diabetes mellitus (10.8%). Deaths with incomplete or missing charts were more likely to have occurred at the hospital for the uninsured, to have been under the age of 65 and certified by the treating physician (p <0.05).
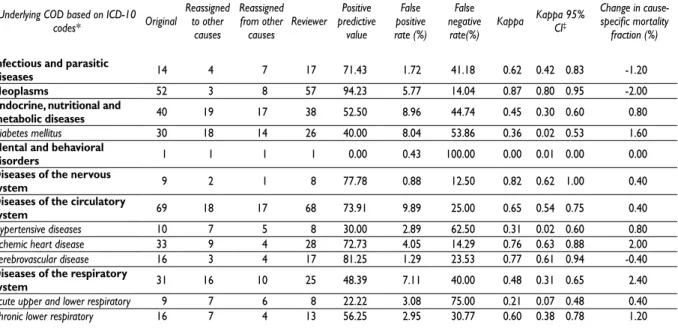
When comparing at the broad level of ICD-10 chap-ter blocks, the reviewer’s underlying COD matched the underlying COD reported by the vital registry in 173 cases (69.2%) (Table II). The overall weighted kappa statistic was 0.62 (95% confidence interval (CI) 0.52, 0.71). At the 2-digit ICD-10 classification, only 126 cases (50.40%) were in agreement (results not shown). At the chapter level, agreement was excellent for neoplasms (kappa=0.87; 95% CI 0.80, 0.95), diseases of the nervous system (kappa= 0.82; 95% CI 0.62, 1.00), ischemic heart disease (kappa= 0.76; 95% CI 0.63, 0.88), cerebrovascular disease (kappa= 0.77; 95% CI 0.61, 0.94) and diseases of the digestive system (kappa= 0.77; 95% CI 0.62, 0.91). Agreement was moderate for infectious and parasitic diseases (kappa= 0.62; 95% CI 0.42, 0.83) and diseases of
the genitourinary system (kappa= 0.4; 95% CI 0.08, 0.74). Agreement was poor for diabetes mellitus (kappa= 0.36; 95% CI 0.02, 0.53), hypertensive diseases (kappa= 0.31; 95% CI 0.02, 0.60) and acute upper and lower respiratory disease (kappa= 0.21; 95% CI 0.07, 0.48).
The false-positive rate was highest for diseases of the circulatory system (9.9%) and the false-negative rate was highest for hypertensive diseases (62.50%). The positive predictive value was highest for neoplasms (94.23%) and lowest for hypertensive disease (30.00%). Sensitivity was the highest for neoplasms (85.1%), diseases of the nervous system (87.5%) and cerebrovas-cular diseases (85.2%) and lowest for diabetes mellitus (44.0%), hypertensive diseases (42.9%) and acute respi-ratory disease (25.0%). The lowest specificity observed was for diabetes mellitus (92.4%) and diseases of the circulatory system (89.6%).
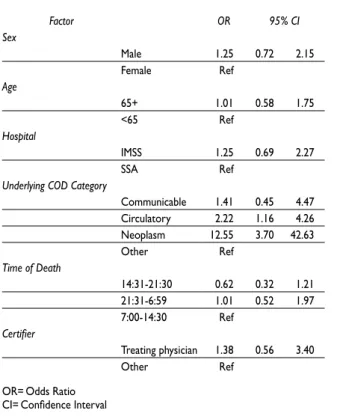
Underlying COD category was the only statistically significant predictor of agreement between the original and reviewer classification (Table III). Compared to all other disease categories, neoplasms were over 12 times more likely (OR 12.5, 95% CI 3.7, 42.6) and circulatory disease were more than twice as likely (OR 2.2, 95% CI 1.2, 4.2) to be in agreement.
Table II
agreementbetweenoriginalanDreviewerunDerlyingcauseofDeath (coD) forselecteDcauses inasampleofDeathsfromresiDentsof hermosillo, mexicofrom 2005
Underlying COD based on ICD-10 codes* Original
Reassigned to other
causes
Reassigned from other
causes Reviewer Positive predictive
value
False positive rate (%)
False negative
rate(%) Kappa Kappa 95% CI‡
Change in cause-specific mortality
fraction (%)
Infectious and parasitic
diseases 14 4 7 17 71.43 1.72 41.18 0.62 0.42 0.83 -1.20
Neoplasms 52 3 8 57 94.23 5.77 14.04 0.87 0.80 0.95 -2.00
Endocrine, nutritional and
metabolic diseases 40 19 17 38 52.50 8.96 44.74 0.45 0.30 0.60 0.80
Diabetes mellitus 30 18 14 26 40.00 8.04 53.86 0.36 0.02 0.53 1.60
Mental and behavioral
disorders 1 1 1 1 0.00 0.43 100.00 0.00 0.01 0.00 0.00
Diseases of the nervous
system 9 2 1 8 77.78 0.88 12.50 0.82 0.62 1.00 0.40
Diseases of the circulatory
system 69 18 17 68 73.91 9.89 25.00 0.65 0.54 0.75 0.40
Hypertensive diseases 10 7 5 8 30.00 2.89 62.50 0.31 0.02 0.60 0.80
Ischemic heart disease 33 9 4 28 72.73 4.05 14.29 0.76 0.63 0.88 2.00
Cerebrovascular disease 16 3 4 17 81.25 1.29 23.53 0.77 0.61 0.94 -0.40 Diseases of the respiratory
system 31 16 10 25 48.39 7.11 40.00 0.48 0.31 0.65 2.40
Acute upper and lower respiratory 9 7 6 8 22.22 3.08 75.00 0.21 0.07 0.48 0.40
Chronic lower respiratory 16 7 4 13 56.25 2.95 30.77 0.60 0.38 0.78 1.20
* World Health Organization’s International Classification of Diseases, 10th Revision [ICD-10] ‡ Confidence Interval
Table IV provides a cross-tabulation showing the misclassification of selected diseases. Of the diseases with low sensitivity, underlying COD discrepancies between the original and reviewer coding tended to involve common co-morbidities. Diabetes mellitus was commonly misclassified on the death certificate as diseases of the circulatory system, infectious diseases or diseases of the genitourinary system. Hypertensive disease was most commonly misclassified as diabetes mellitus or respiratory diseases. Respiratory diseases were misclassified as diabetes mellitus, neoplasms and disease of the circulatory system.
Change in the cause-specific mortality fraction for a given disease category in the study population was minimal (Table II). While agreement was poor for a number of disease categories, the mutual misclassifica-tion of disease among these categories minimized the effect of poor agreement on the estimated distribution of disease at the population level. The largest changes occurred in diseases of the respiratory system (- 2.4%), neoplasms (+2%) and ischemic heart disease (-1.6%).
Factor OR 95% CI
Sex
Male 1.25 0.72 2.15
Female Ref
Age
65+ 1.01 0.58 1.75
<65 Ref
Hospital
IMSS 1.25 0.69 2.27
SSA Ref
Underlying COD Category
Communicable 1.41 0.45 4.47
Circulatory 2.22 1.16 4.26
Neoplasm 12.55 3.70 42.63
Other Ref
Time of Death
14:31-21:30 0.62 0.32 1.21
21:31-6:59 1.01 0.52 1.97
7:00-14:30 Ref
Certifier
Treating physician 1.38 0.56 3.40
Other Ref
OR=Odds Ratio CI=Confidence Interval
Table III
oDDsratiosforagreementbetweenoriginal anDreviewerunDerlyingcauseofDeath (coD)
in hermosillo, mexicofrom 2005
Discussion
Vital registry systems are crucial sources of data on population disease burden.3;25,26 This study is the only
identified evaluation of the quality of cause of death coding of adult mortality in the Sonoran vital registra-tion system. The study used a systematic review of hospital medical charts to determine a “gold standard” for underlying COD and compared this COD to the data reported by the vital registry system.27 The electronic
vital registry database, released annually, is the primary data source for assessing mortality in the northern Mexican border region.
Overall agreement between the reviewer and origi-nal COD at the ICD-10 chapter block level was 69.2%, with a weighted kappa of 0.62. This study focused on chapter level agreement because the majority of Mexico’s national statistics are published and health policy priori-ties are set at this level. Agreement at the 2-digit classifi-cation level dropped to 50%, a proportion similar to that reported for infant deaths in Hermosillo.20 In contrast,
a study of adults in Brazil found a higher rate of overall agreement (83%; kappa=0.76) at the 3-digit ICD-10 level. However, 30% of the original statements of death were based on autopsy results, which likely increased the accuracy of the original COD.17 Although autopsy is
the gold standard for determiningthe underlying cause of death,28,29 it is not a common practice in Mexico.24
Although previous studies report higher percentage agreements than those found in the Sonora data by the present study, trends by cause of death are similar, with high rates of agreement for neoplasms and lower levels of agreement for hypertension related deaths.30
Currently, the medical record is the best source of data for cause of death studies in Hermosillo. In the present study, 83% of hospital medical charts had sufficient data to identify a confirmed or probable underlying cause of death. Agreement between the underlying COD reported by the vital registry system and the underlying COD determined by trained physi-cian reviewers varied widely across ICD-10 chapters. Excellent agreement and sensitivity was found for neo-plasms, diseases of the nervous system, cerebrovascular disease and ischemic heart disease. Poor agreement was found for diabetes mellitus, hypertensive disease and acute upper and lower respiratory disease. A re-cent study in China also reported high sensitivities for cancers and low sensitivity for diabetes mellitus and hypertensive diseases.7 In contrast to our findings, two
large community cohort studies found overestimation of coronary heart disease,3,4 while a study in Taiwan and
317
1
A
r
t
íc
u
lo
o
r
ig
in
A
l
Original underlying COD based on ICD-10 codes*
Underlying COD based on ICD-10 codes*
Certain infectious and parasitic diseases
Neoplasms and diseases of the blood and
blood-forming organs
Diabetes mellitus
Diseases of the nervous system
Hypertensive diseases
Cerebro-vascular disease
Ischemic heart disease
Diseases of the respira-tory system
Diseases of the digestive system
Diseases of the genitouri-nary system
All other diseases
Total deaths by
original
Certain infectious and parasitic diseases 10 2 1 1 1 2 17 Neoplasms and diseases of the blood and blood-forming
organs 49 1 3 2 1 0 56
Diabetes mellitus 1 1 12 1 3 3 2 2 1 26 Diseases of the nervous system 7 1 0 8 Hypertensive diseases 1 3 1 3 0 8 Cerebrovascular disease 1 13 1 1 2 18 Ischemic heart disease 2 24 1 1 28 Diseases of the respiratory system 1 1 2 2 2 1 15 1 0 25 Diseases of the digestive system 1 1 19 2 23 Diseases of the genitourinary system 2 3 0 5 All other diseases 1 1 7 1 2 1 2 7 1 0 13 36 Total deaths by reviewer 14 52 30 9 10 16 33 31 24 10 21 250 * World Health Organization’s International Classification of Diseases, 10th Revision [ICD-10]
States observed a low rate of agreement for cerebral infarction.30,31
Nonetheless, the net change in mortality frac-tion after physician review was minimal across all chapters, as mutual misclassification occurred among common co-morbidities. This “compensatory effect of errors” has been documented in some studies,30,32 but
contrasts with earlier studies that consistently reported over-estimation for specific categories of disease, such as coronary heart disease.5,10 Misclassification between
common co-morbidities, such as diabetes mellitus and circulatory disease was common.
COD analyses can have profound effects on policy makers’ understanding of the cause-specific mortality burden in a population, and may result in misguiding public health interventions. Nonetheless, identifying the principal cause of death among one or more competing causes or co-morbidities has been identified as a barrier to accurate death certification.33,34 Mackenbach et al.
report that competing causes were most often present for respiratory disease and cardiovascular disease, two categories with low agreement in our study.35 Much of
this misclassification, with particular reference to dia-betes mellitus, has been attributed to coder preference for particular ICD rules.30,36 Investigations of specific
categories of disease that have common co-morbidities or competing causes of death should consider a multiple cause of death analysis, which uses both the underlying and contributing causes of death as recorded on the death certificate.37 Using multiple causes of death to
identify “stroke-related” deaths increased population stroke mortality estimates by 100%.38
A common fallacy in cause of death studies is the lack of reproducibility of the research methods, includ-ing the failure to use a standard form for medical chart reviews.27 In order to increase potential reproducibility,
this study mimicked the process by which the official COD is assigned by the Sonoran vital registry. By uti-lizing a systematic approach to review medical charts, including a standardized abstraction form, our study demonstrated good overall agreement for underlying COD (88%) between independent physician reviewers, higher than that reported in previous studies.38,39
A total of 17% of medical charts could not be located. Missing medical records may limit the gener-alizability of the study, as the younger and uninsured patients were more likely to have missing charts and be excluded from the study. Specialization of the hospital has previously been shown to be a determinant of death certification quality.35 Uninsured and younger patients
may be less likely to have sought care previously, are
more likely to present with acute, late-phase illness and may have minimal information in their medical chart. This study did not consider out-of-hospital deaths. Studies of out-of-hospital deaths due to coro-nary heart disease have shown that the accuracy of death certification for said deaths is lower than that of in-hospital deaths.40 Future research should include
assessment of out-of-hospital deaths and consider methodologies such as physician or family interviews to improve the quality of the cause of death coding for these deaths.
While this study assessed cause of death coding at the local level in the Sonoran registry, mortality statis-tics are subject to final coding before publication at the national level. Since national statistics are most widely used, future studies might incorporate the final cause of death as determined at the national level in order to increase external validity of comparisons.
This study did not differentiate between errors in the original certification and in the cause of death coding. An important follow-up study would include a re-coding of the original death certificates to identify errors due to death certification versus nosologist coding.
While the vital records system in Hermosillo provides complete adult mortality data, some inac-curacies in the coding of the underlying cause of death statements exist that may negatively affect reporting of mortality statistics. Suggested improvements to the system include increasing physician training (in 2001, 25.5% of Sonoran physicians reported formal training in death certification),41 querying of ill-defined causes
of death, installing an automated classification program and strengthening the research capacity in the region to effectively use, analyze and distribute data from the vital registry system.
Regular analysis and dissemination of data from vital registries, on both quality and prevalence, is crucial for increasing physician and policy makers’ awareness of the importance of the vital registry system and its role in improving health systems.2 Mortality statistics
Acknowledgements
The authors would like to acknowledge the cooperation of the Secretary of Public Health of the state of Sonora in the completion of this study.
Declaration of conflict of interests: The authors declare that they have no conflict of interests.
References
1. Mathers CD, Ma Fat D, Inoue M, Chalapati R, Lopez AD. Counting the dead and what they died from: an assessment of the global status of cause of death data. Bull World Health Organ 2005;83:171-7.
2. Lozano R. Burden of disease assessment and health system reform: Results of a study in Mexico. J Int Dev 1995;7:555-63.
3. Coady SA, Sorlie PD, Cooper LS, Folsom AR, Rosamond WD, Conwill DE. Validation of death certificate diagnosis for coronary heart disease:the Atherosclerosis Risk in Communities (ARIC) Study. J Clin Epidemiol 2001;54:40-50.
4. Lloyd-Jones DM, Martin DO, Larson MG, Levy D. Accuracy of Death Certificates for Coding Coronary Heart Disease as the Cause of Death. Annals of Int Med 1998;129:1020-6.
5. Thomason MJ, Biddulph JP, Cull CA, Holman RR. Reporting of diabetes on death certificates using data from the UK Prospective Diabetes Study. Diabetes Med 2005;22:1031-6.
6. Stalioraityte E, Pangonyte D, Kazlauskaite D. Reliability of cause-specific mortality rate statistics: case of Lithuania. Public Health 2005;119:799-807. 7. Rao C, Yang G, Hu J, Ma J, Xia W, Lopez AD. Validation of cause-of-death statistics in urban China. Int J Epidemiol 2007;36:642-51.
8. Morton L, Omar R, Carroll S, Beirne M, Halliday D, Taylor KM. Incomplete and inaccurate death certification--the impact on research. J Public Health Med 2000;22:133-7.
9. D’Amico M, Agozzino E, Biagino A, Simonetti A, Marinelli P. Ill-Defined and multiple causes on death certificates - A study of misclassification in mortality statistics. Eur J Epidemiol 1999;15:141-8.
10. Mackenbach JP, Kunst AE, Lautenbach H, Oei YB, Bijlsma F. Competing causes of death: A death certificate study. J Clin Epidemiol 1997;50:1069. 11. Lahti RA, Penttila A. Cause-of-death query in validation of death certification by expert panel; effects on mortality statistics in Finland, 1995. Forensic Sci Int 2003;131:113-24.
12. Franca E, de Abreu DX, Rao C, Lopez AD. Evaluation of cause-of-death statistics for Brazil, 2002-2004. Intl J Epidemiol 2008;37:891-901. 13. Department of Health and Human Services: Centers for Disease Control and Prevention’s National Center for Health Statistics. Physicians’ handbook on the medical certification of death. Report No. 2003-1108. Hyattsville, Maryland: DHHS, CDCP, 2003.
14. Landis JR, Koch GG. The measurement of observer agreement for categorical data. Biometrics 1977;33.
15. Johansson LA, Westerling R, Rosenberg HM. Methodology of studies evaluating death certificate accuracy were flawed. J Clin Epidemiol 2006;59:125.
16. Schnitman A. Análise da fidedignidade da declaração da causa básica de morte por câncer em Salvador, Brazil. Rev Saude Publica 1990;24:490-6. 17. Fonseca LAM, Laurenti R. Qualidade da certificação médica da causa de morte em São Paulo, Brasil. Rev Saude Publica 1974;8:21-9. 18. Laurenti R, Jorge MH, Gotlieb SLD. Mortalidade segundo causas: considerações sobre a fidedignidade dos dados. Pan Am J Public Health 2008;23:349-56.
19. Dirección General de Información y Evaluación del Desempeño. Secretaría de Salud.México. Estadísticas de mortalidad en México: muertes registradas en el año 2003. Salud Publica Mex 2005;47:171-87.
20. Alvarez G, Harlow SD, Denman C, Hofmeister MJ. Quality of cause-of-death statements and its impact on infant mortality statistics in Hermosillo, Mexico. Rev Panam Salud Publica 2009;25:120-7. 21. Secretaria de Salud. Programa de Acción: Sistema Nacional de Información en Salud 2001-2006. Mexico DF: Coordinación General de Planeación Estratégica, Dirección General de Información y Evaluación del Desempeño, 2002.
22. Secretaria de Salud. Proyecciones de Población sin Seguridad Social, Según Municipio CML, Jurisdicción y Edad Quinquenal, Sonora, 2006. Mexico: Dirección General de Información en Salud, 2006. 23. Lu TH, Lee MC, Chou MC. Accuracy of cause-of-death coding in Taiwan: types of miscoding and effects on mortality statistics. Int J Epidemiol 2000;29:336-43.
24. Instituto Nacional de Estadística y Geografía. Principles resultados del xii censo general de poblacion y vivienda. Aguascalientes, Mexico: INEGI, 2000. 25. Mathers CD, Ma Fat D, Inoue M, Chalapati R, Lopez AD. Counting the dead and what they died from: an assessment of the global status of cause of death data. Bull World Health Organ 2005;83:171-7.
26. Lozano R. Burden of disease assessment and health system reform: Results of a study in Mexico. J Int Dev 1995;7:555-63.
27. James G, Patton RE, Heslin AS. Accuracy of cause-of-death statements on death certificates. Public Health Report 1955;70:39-51.
28. Myers KA, Farquhar DRE. Improving the accuracy of death certification. Can Med Assoc J 1998;158:1317-23.
29. Cirera Suárez L, Martínez López C, Contreras Gil J, Navarro Sánchez C. Aprendizaje y satisfacción de los talleres de pre y postgrado de medicina para la mejora en la certificación de las causas de defunción, 1992-1996. Rev Esp Salud Publica 1998;72:185-95.
30. Lu TH, Shih TP, Lee MC, Chou MC, Lin CK. Diversity in death certification: A case vignette approach. J Clin Epidemiol 2001;24:1086-93. 31. Brown DL, Al-Senani F, Lisabeth LD, Farnie MA, Colletti LA, Langa KM, et al. Defining Cause of Death in Stroke Patients: The Brain Attack Surveillance in Corpus Christi Project. Am J Epidemiol 2006;165(5):591-6. 32. Franco LJ, Mameri C, Pagliaro H, Iochida LC, Goldenberg P. Diabetes como causa básica ou associada de morte no Estado de São Paulo, Brazil, 1992. Rev Saude Publica 1998;35:237-45.
33. Mant J, Wilson S, Parry J, Bridge P, Wilson R, Murdoch W, et al. Clinicians didn’t reliably distinguish between different causes of cardiac death using case histories. J Clin Epidemiol 2006;59:862-7.
34. Smith Sehdev A, Hutchins G. Problems with Proper Completion and Accuracy of the Cause-of-Death Statement. Arch Intern Med 2001;131:277-84.
35. Cordeiro R, Olivencia Peñaloza ER, Cardoso CF, Cortez DB, Kakinami E, Souza JJGd, et al. Validade das informações ocupação e causa básica em declaraçoes de õbito de Botucatu, São Paulo. Cad Saude Publica 1999;15:719-28.
36. Johansson LA, Westerling R. Comparing Swedish hospital discharge records with death certificates: implications for mortality statistics. Int J Epidemiol 2000;29:495.
37. Nashelsky MB, Lawrence CH. Accuracy of cause of death
determination without forensice autopsy examination. Am J Forensic Med Pathol 2003;24:313-9.
38. Jougla E, Papoz L, Balkau B, Maguin P, Hatton F. The Eurodiab Subarea CSG. Death Certificate Coding Practices Related to Diabetes in European Countries--The ‘EURODIAB Subarea C’ Study. Int J Epidemiol 1992;21:343-51. 39. Carr JS, Scott SM, Wagner BM. The Necessary Role of the Autopsy in Cardiovascular Epidemiology. Human Pathol 1998;29:1469-79. 40. Fox CS, Evans JC, Larson MG, Lloyd-Jones DM, O’Donnell CJ, Sorlie PD, et al. A comparison of death certificate out-of-hospital coronary heart disease death with physician-adjudicated sudden cardiac death. Am J Cardiol 2005 Apr 1;95(7):856-9.