www.elsevier.es/rmuanl
ORIGINAL
ARTICLE
Evaluation
of
inter-batch
variability
in
the
establishing
and
quality
control
of
glucose
J.
Moya-Salazar
a,∗,
L.
Pio-Dávila
baM.T.,FacultaddeCienciasyFilosofía,UniversidadPeruanaCayetanoHeredia,Lima,Peru bM.L.T.,HospitalNacionalDosdeMayo,Lima,Peru
Received18October2015;accepted1March2016 Availableonline11June2016
KEYWORDS
Glucose;
Qualityrequirements;
Inter-batch variability; Operativepoint
Abstract Thisresearchevaluatedtheinter-batchvariabilityintheidentificationandquality controlofglucose,accordingtointernationalspecificationsdetailedintheguideCLSIEP-15. Type ofqualitative research, analytical, notexperimental, prospective cross-sectional con-ductedattheDepartmentofClinicalLaboratoryatPolyclinic‘‘LaFe’’duringJanuary2015was performed.Theinter-batchvariabilityforglucoseinthesemi-automatedbiochemicalanalyzer URIT-810withliquidenzymeglucose-LSreagent(GOD-PAP)Valtek® batch140825was evalu-ated.Thecalibrators(CS)werethelotCS-A:140428,CS-B:120912andCS-C:131202.Data analysiswasperformedinSPSSversion20.0statisticalanalyzerandMicrosoftOfficeExcel2010 forWindows.Thevaluesfoundbycalculatingthesigmametricwere:2(SE−0.35),0(SE 1.65) −0.9(SE−0.75) toCS-A,CS-BandCS-C,respectively (p<0.05).OnlyCS-Amightbe abletoimprovetheirperformance,althoughwithgreatercost.Sub-optimalperformance char-acteristicsbyusingstandardcalibratorsshowhighinter-lotvariability,suggestingthechoice andsearchforanewandbettercalibrationmethodtoensureresultsthatcontainnomedically importanterrorsaffectingpatienthealth.
©2016UniversidadAut´onomadeNuevoLe´on.PublishedbyMassonDoymaM´exicoS.A.Thisis anopenaccessarticleundertheCCBY-NC-NDlicense(http://creativecommons.org/licenses/ by-nc-nd/4.0/).
Introduction
Glucose is the main energetic biomolecule for most
liv-ingsystems,responsible formaintainingcellularfunctions
∗Correspondingauthorat:Pacifico957Urb,SanFelipeLima07,
Peru.Tel.:+5114873681;mobile:+511986014954.
E-mail addresses: jeel.moya.s@upch.pe, jeelms@outlook.com (J.Moya-Salazar).
through glucid catabolism. Since its isolation in 1747 by
AndreasSigismund, and the discovery of its configuration
in 1902 by Emil Fisher, the function of glucose has been
explainedandcorrelatedwiththedevelopmentofdiverse
disorders and homeostatic mechanisms for its control.1
Thus,glucoseallowsforthediagnosisofseveraldisorders,
suchasdiabetes mellitus, Cushing’s syndrome,meningeal
inflammatoryprocesses,metabolicsyndrome,
heredofamil-ial intracorpuscular hemolysis, and even enzymopathies,
intoleranceor improper carbohydrate enteric absorption,
http://dx.doi.org/10.1016/j.rmu.2016.03.004
kidney diseases, and in vitro tests for cellular functional statusevaluation,inadditiontobeingusedasa
preserva-tionagent for haemocomponents, among others.2 Hence,
glucoseistranscendentalfordiagnosisinalmostallclinical laboratoriesareas.
Itis mainlyusedfordiagnosing diabetesmellitus (DM),
a metabolic disease which imposes a high economic and
social cost in the world today, especially type II DM.
Diagnosis is made through signs and symptoms and
stim-uli/response tests, such as the oral glucose tolerance
test (OGTT), among others.3,4 Moreover, explorations of
carbohydrate metabolism are employed, such as random
glycemias,fastingplasmatic glycemias,the glucose toler-ancewithcorticoids test and,recently, withtheglycated hemoglobinA1Ctest,aswellasplasmaticinsulinlevel eval-uations,peptideCandglucagondosing,andglucoseinurine andlipidprofiles.5---7
Determined valuesindicate how the organism controls
glucose.Biochemicaldeterminationisgenerallyperformed
with reducing methods, enzymatic methods (hexokinase,
glucose-oxidase,andglucose-dehydrogenase),and
commer-cialdeterminationsbydrychemistryforclinicaldiagnosis,
aswell asfor in-homemonitoring andimmunoradiometric
trials.Enzymaticmethodsincommercialpresentationsare
the most utilized, followed by patient monitoring by dry
chemistry, usually with acceptable sensitivity ranges and
errormargins.8Nevertheless,glucoseisoneofthe metabo-liteswhichsuffersmorepre-analyticandanalyticchanges,
and onewhich presents an elevated biological intra-and
inter-individual variability. However, the reagent maker
incorporates internationally-validated technical specifica-tions;duetodifferentfactors,thesecannotbereproduced intheroutinelaboratory,thusmakingqualitycontrolunder workconditionswhichguaranteethequalityoftheirresults necessary.9,10
Parameterstoensurequalityinclinicalbiochemistry,as
described by the Clinical Laboratory Standards Institute
(CLSI), include analyticalmethods and verification guides
which lead to a correct planning and choosing of
qual-itycontrolrulesforcontinuousmonitoringofperformance
underworkconditions. Obtainingof thesedatesthetotal
erroroflaboratorymethod(Tea)iscomparabletothe
max-imum permissible error designed from different sources
liketheClinicalLaboratoryImprovementAmendments1988
(CLIA’88), biological variability, RCPA regulatory
require-ments,etc. Subsequently,planning andmethodcontrolas
wellasqualitywillshowcontinuousimprovement.11 Quality verificationof amethod’s analytical character-isticsis applicable toallkindsof laboratories.In addition
tomeasurable dataonthe system’sperformance
(inaccu-racy and bias), quality requirements and real reference
valuesarenecessary.12Qualityrequirementsforglucoseare diverse,withmaximumquantifiablepermissibleerrorvalues upto±10%(±6mg/dl)inmostsources.5,13
Subsequent to the establishment of internal quality
control,thesamereagentlotshouldbemaintainedin bio-chemistry(andhematology)for ayear,inordertocontrol performance.14Likewise,variabilityofthecontrolmaterials fromlot-to-lotshouldbeminimal.Sinceitrepresentsasmall amountofobservedvariation,thisshouldnotexceed10%.15 Amongstthecommunity,thecirculationoflyophilized con-trolsispredominant,which,unlikeliquidcontrols,present
highererrorandstabilityandlowercost,butrequirecareful handlingofvolumetricmaterial,distilledwaterand recon-stitution.
Withinthecommunity,therearefewclinicalanalysis lab-oratories withquality systemsin biochemistry. Consistent
with the evolution of laboratories, most National
hospi-tals and some private Health Centers in Lima maintain
internal,externalandinter-laboratoryquality implementa-tionwithoutacosmopolitanreachinthecapital.Thevast
majority of new clinical laboratories with economic
limi-tations, interest of profit, or those which are unfamiliar withtheclinicalimpactofresultswithoutaqualitysystem onlyuse‘‘standardcalibrator’’controls,usually
semiauto-maticbiochemicalanalyzersprovidedbythemanufacturer
asaqualityreferenceforworkperformanceevaluationand resultreliability.
Itisevidentthatthelackofconscienceaboutthissubject andtheampleuncertaintyproducedintheresult,sincethe errorisnotquantifiedorcorrected, willbemagnified pro-gressivelyandbecomeuncontrollable.Inthisregard,some
of themost commonlyusedreagents inclinical chemistry
amongstthecommunitydonothavethesamelotinsidethe
kit(inotherwords,adifferentlotfortheenzymaticreagent andforthestandardcalibrator).Then,howcanthequality oftheresultsbeensuredintheseconditions?
The objectiveof thisinvestigation wastoassess inter-batch variabilityin the determination andquality control
of glucose, according to the international specifications
detailedintheCLSIEP-15-A3guide.
Method
and
materials
A qualitative, analytic, non-experimental, prospective
cross-sectional study wasconducted in the Clinical
Labo-ratoryDepartmentatthebiochemicalareaofthe‘‘LaFe’’ PolyclinicHealthCareCenterduringJanuary,2015.Glucose inter-batch variabilitywas assessed according tothe CLSI EP15-A3guide,highlightingtheusefulnessof‘‘control
let-ters’’ (metric sigma, power control chartand Normalized
OPSpecschart).12
Sample
On-probabilistic,samplingintentionallybyconvenience.
Biochemicalanalyzer
In order to perform determinations, we used aURIT-810
MedicalElectronic(Guangxi,PRChina)semiautomatic
bio-chemicalanalyzer,whichwasstabilizedto220V,100VA.
Reagents
Valtek®Glucose-LSenzymaticliquidreagent(Valtek diagno-sis,SantiagodeChile,Chile)lot140825,withastoragerange
between 2 and 8◦C, 50ml bottle, with glucose
oxidase-peroxidase (GOD-PAP) enzymatic colorimetric method,
A
B
C
1 ml Reactive
0.1 ml Standard calibrator.
Lot: 140 825
Lot: 140 428 Lot: 120 912 Lot: 131 202
Analytic trial: 5 days i triplicate.*
BIAS %CV
BIAS %CV
BIAS %CV
Control letters Sigma metric, ∆SE
Westgard control rules (Monorregla-multirules)
Result quality Verification
Planning
Control
* Total management
of quality
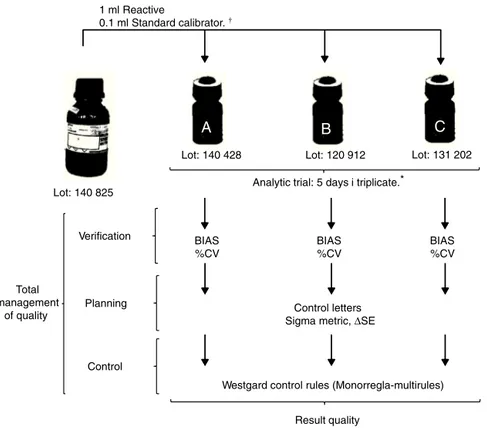
Established underthe work protocol forGlucosedetermination–LS Valtek® Analytictrials describedbytheCLSI EP-15 guide.
Figure1 Workschemewithintheglucoseserummatrix.
andCcalibrators(CS-BandCS-C)oflot120912and131202, respectively(100±1mg/dl).
Controlreagent
Inordertoperformmethodverification,thekit’s‘‘standard calibrators’’wereutilizedascontrolsaccordingtooperative needs.
Datarecollectiontechniqueandsampleprocessing
Accordingtothemaker’srecommendations,CSswere
sta-bilizedat roomtemperature(roomtemperature25±2◦C)
for10minbeforeprocessing.Theequipmentstabilizedfor
10min beforetheanalyticruns.Ablankreagentwasused
beforetheanalysisverificationfromlot-to-lot. Inorderto
evaluateprecision,threesetsofmeasurementsweremade
fivedaysinarow.Fortheevaluationofveracity,duplicates ofthe5daysoftheprecisionprotocolofthe3control mate-rials for glucose were necessary (CS-A, CS-B and CS-C).12 Analyticrunswereconductedbytheinstitution’spersonnel underthe work’s protocol specifications.17 Procedures for
glucoseverification wereconducted usingtheCLSI
EP-15-A3guide,measuredinstandarddeviation(SD)andvariance
coefficient (%VC) toasses bias and imprecision. With the
dataobtainedfrom%VC,biasandTea, thedotand
opera-tivelinesweredeterminedtoevaluatetheperformanceof
themethodology, demonstratedingraphics withincontrol
letters.Thesedeterminetheamountofcontrolsnecessary
fortheanalyticalrun,aswellastheclinical assaycontrol rules.18TheworkoutlineisshowninFig.1.
Dataanalysistechnique
Dataanalysis wasdone using the statistical analyzer IBM
SPSS, version 21 (Armonk, USA) and MS Excel 2010
(Red-mond,USA)forwindows.Thequalitymatrixwasdeveloped
inanExcelsheetshowingSD,%VC,Tea,sixsigmaandcritical systemicerror(SDEorSE).
Limitations
Severallimitations oughttobeaddressed before interpre-tingresults.
First,theremaybefailures inthe conservationor sta-bilityofstandard calibrators, withindomesticdistribution byfranchisesorthebrand’scommercialdistributors.These maybethecauseforerroneousresults.Asecondlimitation
is the fact that we were not able to compare the
inter-batch glucose variability results found in this study with
thosedescribed by Valtek reagentsfor glucose,which do
notshow significant systemic differences in accuracy and
imprecisionwhencomparedtoothercommercialreagents,
obtainedusingtheBSseriesMINDRAYauto-analyzer.16Athird limitationisthattheclinicalbiochemistrylaboratorywhere
thestudy wasconducted is not accredited under the ISO
15189 norm,but it does have the technical and
manage-rialrequirementsoftheISO 9001normimplemented.The
Table1 Averagebias%,%CV,teaforglucosewiththreeCS.
CS-A CS-B CS-C
bias% 0 10 21
%CV 6 11 12
Teaa 10 10 10
Sigma 2 0 0.9
SE 0.35 −1.65 −0.75
aQualityrequirementsunderCLIA’88.
and VALTROL-P (code210-110) areused in the
biochemi-calfieldonaweeklybasis.Lastly,notalllinkedprotocols wereanalyzedwithmethodverification(linearity,detection limit,referencevalues,etc.)11,17.Despitetheselimitations, thisresearchisthefirsttodescribeverificationprocesses, planningandqualitycontrolusingstandardcalibratorssuch ascontrolserainclinicalbiochemistry.
Results
Oftheconductedresearch,thevaluesfoundbythesigma
metriccalculationwere2,0and−0.9,forCS-A,CS-Band CS-C,respectively.Theseindicateaverypoorperformance, whichcannotbecontrolledormaintainedwithinthe appli-cationofastatisticalcontrol(p<0.05).19(Table1)
Sigma metric is a process improvement methodology.
Itsonly goal is toreach less than one defect per million
(99.9997% successes). Although quality requirements are
different for each magnitude, these unify with six sigma
inordertocomparemethodswithasinglevalue.20 Inthis
sense,we areable toexpressvalues andknow statistical
controlstrategiesbasedonsigma,asshowninFig.2asan example.
Othercontrollettersareoperativespecificationgraphics
(OPSpecs) and power control chart. Power control chart
represent the most powerful graphic because of the vast
amount of data which can be obtainedfrom them during
quality planning. These requires SE calculations, based
onthemethod’smaximumpermissibleerror,whichshould
not be more than the quality requirements (up to 90%
of quality assurance), which equals the statistical value
of 1.65 standard deviations.21 These functions present
the information about the performance of a rejection
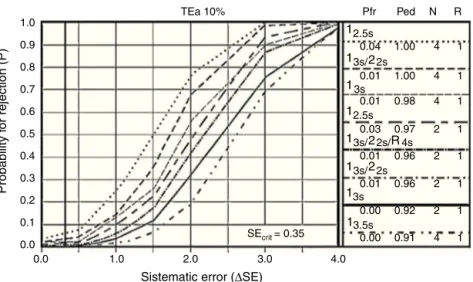
probability graphic control rule versus the analytic error measures,asshowninFig.3.
Every one of the cases underwent 2 control levelsfor
every analytical run (n=2). Choosing one control rulefor every analyte,therearefeweralarms ininternal control, thusfreeingtheanalyticalrunwithagoodchanceoferror detectionandalowprobabilityofrejectinggoodruns.Every letterbeginswiththechoiceofcontrolrules,accordingto
each case (mono-rules or multi-rules) whichevaluate and
controlimmeasurablesystemicandrandommistakes.
Discussion
Performancecharacteristicswerenotoptimalwiththeuse
of standardcalibratorsfor glucosedetermination, accord-ingtothesigmametricevaluation(Table1).Thesedeficient performances(sigma<3)suggestachoiceandsearchfora
newandimprovedcalibrationmethodwhichimproves
pre-cision,sincethereisnominimumqualitycontrolunderthe studied conditions. The analysisof results with statistical controlstrategychartsbasedonsigmametricsprovesthat
Manual selection TEa=10.00 %(SE)
Probability f
or rejection (P)
Process metric (Sigma-scale)
1.65 2.65 3.65 4.65 5.65 P
ed P
fr
1
1 2 3s 0.03
0.04 1
2.5s
3s 2s 4s 1.00
1.00 4 1
4 1
0.03 1.00 4 1
0.01 1.00 4 1
0.01 0.99 4 1
0.03
0.01 0.96
0.94 2
2 1
1
0.01
4.0 3.0
2.0 1.0
Control metric (∆SE, multiples of s)
0.0 0.0 0.1 0.2 0.3
Sigma = 2
∆SEcrit = 0.35
0.4 0.5 0.6 0.7 0.8 0.9 1.0
0.94 2 1 2s 4s 1s /
2 /
13s
13s
13s 12.5s
2s 2 /
2s 2 /
13s 2s/2 R /
4s R / R / /4
N R
1.0
TEa 10% Pfr Ped N R
0.9
0.8
0.7
0.6
0.5
Probability f
or rejection (P)
0.4
0.3
0.2
0.1
0.0
0.0 1.0 2.0
Sistematic error (∆SE)
SEcrit = 0.35
3.0
0.00
1
0.91 4 1 0.00 0.92 2 1
13s
1 2
2 R
2s 2s/ 4s
3s/
1 1
3s/
22s
13s/
13s
2.5s
12.5s
0.01 0.96 2 1 0.01 0.96 2 1 0.03 0.97 2 1 0.01 0.98 4 1 0.01 1.00 4 1 0.04 1.00 4 1
4.0 3.5s
Figure3 PowercontrolchartforglucoseCS-A.Showthateventhoughwith10%ofprobabilityforrejectionbeableestablisha correctplanningandchoosingofqualitycontrolruleswithstatisticalcontrolchart.
analytical qualitycontrol management with standard
cal-ibrators providedby the manufacturer are not enough to
ensure results free of medically significant errors affect-ingthehealthofthepatient.Moreover,statisticsshowthe specificconcentrationtestperformanceinworkconditions inherenttothementionedlaboratory.22
The vast majority of clinical chemistry laboratories in
Lima,which usemanualor semiautomaticmethodologies,
presentahighdegreeofinaccuracyinglucoseand choles-teroldeterminations,highlightingnotonlythepoorquality oflabresults,butalsotheneed fordynamicandefficient controls which ensurequality inprocesses.23 Bynot using Good ClinicalLaboratory Practices, theerror is not quan-tified,thusuncertaintyintheresultcreatesabadclinical diagnosis. Itis worth notingthatqualityis nota common characteristicamongstbiochemicallaboratoriesinLima.A
contrariosensu,withthedevelopmentandnormalizationof
clinicalmedicine,doctorsandpatients areexpectinghigh qualityresults,whichis achallengefor alllaboratoriesin
thecommunity.
Results provided during the calibrator’s analytical run
shouldbetruthfulandpreciseinordertocertifythatroutine
analyticaldeterminationsensureaminimumqualityanda
correctclinical interpretation, in additiontobeinguseful fortheirinter-laboratorycomparability.22,23
OPSpecs’ statistical control letters as well, as power
control chart, describe the acceptable imprecision and
inaccuracy for a method and qualitycontrol necessary to
supervise performance, as well as the test performance
understableconditions,andwarnifthereareanychanges thatmayaffectthereport.Thegoalistoobtain<90%
prob-ability of error detection (Ped or AQA) and less than 5%
probabilityof false rejection (Pfr),with an N(amount of controlsbeinganalyzed)aslowaspossibleandinasingle analytical run.24 In the example shown in Fig. 3,none of therules is eligible, withtwocontrols peranalytical run.
Through the use of control materials ‘‘CS’’ anda proper
statisticalmanagement,weareabletoprovethatnorule
orcontrolisusefulintheverificationofthemethod.25,26,27
In the same manner, the error in Valtek’s critical
glucose-LSlevelswereestimated.Thesystemicerroristhe
differencebetween the conventionallytruthful value and
the median value of a number of determinations which
are experimentally measured. Within this investigation,
we were able to find a 0%, 10% and 20% of bias for
CS-A, CS-B and CS-C, respectively. On the other hand, the
systemic error, that is to say the resultant precision of
the approximation’s repeated measured values, were 6%,
11% and 12% of CS-A, CS-B and CS-C, respectively. These
continuous quantitativevariables, when expressed
graph-ically, show thewide inter-batchvariability and error for
glucose.Of these, only lot140428 (CS-A) could be
capa-ble of improving its performance of being indispensable
for analysis in the laboratory, in other words,
capa-bleof recognizing, monitoring, minimizing and correcting
errors, although it would be costly to maintain it within
quality.14,15,17
Thecausesofthisvariabilitycouldbelinkedtodifferent motives,whichitisnotanobjectiveofthisinvestigationto describe.Butitistoconsiderwhetherornotsomefactors aredirectlyinterfering,suchthematrixtype,signal varia-tionbetweenequipment,lackofnoisecontrol,CSbehavior inworkconditions,measuredcommutability,transportation
and control storage and lack of preventive maintenance,
toname afew.In consequence, fullroutinemonitoring is
ineludible.
Glucose concentration is very important for
endocri-nologists,diabetologistsand diabeticpatients,evenwhen
dysglycemicor apparently healthy, particularly when the
concentrationisclosetothe upperlimitof thereference interval(±10%or6.1mmol/L).28Theconcerningprevalence ofdiabetesandprediabetessuggeststheimmediate prioriti-zationofhealthcareinordertoavoidfuturecomplications.
Diagnosis by stimuli-response and/or explorations of the
carbohydrate metabolism ought to be evaluated for all
phenomenawhichmayinterveneduringeveryanalysisand
generate non-quantifiable errors, which will not ensure
Conclusions
In this investigation, the measure of standard glucose
calibrators was performed in order to prove inter-batch
variability and the application of control letters,
follow-ingevaluationproceduresrecommendedby theCLSIEP15
guide.Totalerrorwasidentifiedandqualitycontrol
neces-sarytocontrolthemethodperformancewasevaluated.
Thewideinter-batchvarietyworksagainstresult
repro-ducibility and quality, hence we must opt for a different
controlmaterialforqualitymonitoringinglucose-LS
deter-mination with Valtek® reagents. Quality planning helps
clinicalanalysislaboratorieswhichdon’tquantifyerrorsor guaranteeatrustworthy diagnosisfacequalitychallenges.
However,theproblem withvariabilityand qualitycontrol
estimationsisthatmostlaboratoryusersarenotfamiliarized withtheconcepts and themeasuringprocess isstill
hier-archically restrained toreference methods, which ensure
processtraceability,butarenotaccessibleforeveryclinical
laboratorynationwide.
Itis notaproblemfor ourmethodtoworkwitha
cer-taindegree of error. The problem is for this error tobe
greaterthanthe maximumpermissibleamount, according
tothemethod’squalityspecifications.Inthissense,quality ofresultsisnotguaranteedbyusingonlystandard
calibra-torsprovidedby themanufacturer; thisevaluationshould
bethestartingpointtodevelopqualityprocesses.
Analytical chemistry shouldnot only equilibrate a
col-lection of data and methods, but obtain representative
samples,optimizemethodsand interferencemanagement
andguaranteequalityof data.We hope thisinvestigation
isabletopromotetheuseofoptimalcontrolmaterialsfor correctplanningandqualitycontrolinclinicalanalysis lab-oratories.
Funding
sources
Self-financedbytheauthors.
Conflict
of
interest
Theauthorsdeclarenottohaveanyconflictsofinterest.
References
1.FisherE.Synthesesinthepurineandsugargroup.NobelLect. 1902:21---35.
2.PrietoVJ,YusteAJ.Laclínicayellaboratorio-Balcells,vol.3, 20ed.Espa˜na:Elsevier-MassonPublisher;2006.p.47---50. 3.MoyaSJ,PioDL.Evaluationcriteriafortheinterpretationoftest
oforalglucosetolerance(OGTT)inHospitalNacionalDocente Madre-Ni˜no‘‘SanBartolome’’.MedUniv.2015;17:147---52. 4.Puig-DomingoM,LeivaHA.Diabetesmellitus:concepto,
clasi-ficaciónyetiología.In:CasanuevaFreijoF,VázquezGarcíaJA, editors.Endocrinologíaclínica.Espa˜na:DíazDeSantos;1995. p.241---9.
5.American Diabetes Association.Diagnosis and classification of diabetes mellitus. position statement. Diabetes Care. 2010;33:562---9.
6.TietzNW.Fundamentalsofclinicalchemistry.Philadelphia:WB Saunders;1996.
7.DeBuitragoJM.Bioquímicaclínica.Amsterdam:Elsevier Pub-lisher;1998.
8.SuardíazJ,CruzC,ColinaA.Laboratorioclínico.La Habana: EditorialCienciasMédicas;2004.p.12---3.
9.KrouwerJ.Settingsperformancegoalsandevaluatingtotal ana-lyticalerrorfordiagnosticassays.ClinChem.2002;6:919---27. 10.ChenH, Zhang L, Bi X, Deng X.Two evaluation budgetsfor
themeasurementuncertaintyofglucoseinclinicalchemistry. KoreanJLabMed.2011;31:167---71.
11.BadrikT.Qualityleadershipandqualitycontrol.ClinBiochem Rev.2003;24:81---93.
12.CLSIEP-15-A3.Userverificationofprecisionandestimationof bias;approvedguideline----ThirdEdition.950WestValleyRoad, Suite2500,Wayne,Pennsylvania19087,USA:Clinicaland Lab-oratoryStandardInstitute;2014.
13.WestgardJ,SeehaferJ,BarryP.Allowableimprecisionfor lab-oratory test based on clinical and analytical test outcomes criteria.ClinChem.1994;10:1909---14.
14.ÁlvarezFV,MontserratMM,KirchnerJA,etal.Elalgoritmode Westgardcomosistemadecontrolinterno.Sociedadespa˜nola deQuímicaClínica.QuímClín.1990;9:97---101.
15.ISO 15189 Medical Laboratories. Particular requirements for qualityandcompetence,2003.Geneva,Switzerland: Interna-tionalOrganizationforStandards;2007.p.2.
16.Trinder P. Determination of bloodglucose using an oxidase-peroxidasesystemwithanon-carcinogenicchromogenic.JClin Pathol.1969;22:158---61.
17.Valtekdiagnosis.Glucosa---LS(GOD---PAP)reactivolíquidopara ladeterminaciónfotométricadeGlucosaensuerooplasmay otrosfluidosbiológicos.Valtek, ˜Nu˜noa,SantiagodeChile;2010. 18.Guglielmore R, De Elías R, Kiener O, Collino C, Barzón S. Methodverificationinacertifiedlaboratoryandinternal qual-itycontrolpacification.ActaBioquímClínLatinoam.2011;45: 335---47.
19.D’IsaG,RubinsteinM.Sixsigmaenellaboratoriodequímica clínica.Bioanalisis.2009;1:12---5.
20.Terrés-SpezialesA.Sixsigma:determinacióndemetas analíti-cas con base en la variabilidad biológica y la evolución tecnológica.RevMexPatolClín.2007;54:28---39.
21.Westgard J, Groth T. Powerfunctions for statistical control rules.ClinChem.1979;6:863---9.
22.KonieczkaP,NamiesnikJ.Quality assuranceand quality con-trolintheanalyticalchemicallaboratory.NewYork:CRCPress Taylor&FrancisGroup,LLC;2009.p.97---129.
23.SandovalVM,SalazarCY,LoliPR,HuamánGO.Inexactitudenlas determinacionesbioquímicasdeglucosa,colesteroly triglicéri-dos,enlaboratoriosclínicosdeLima.RevInvUnivNorbWiener. 2014;3:31---40.
24.WestgardJ.Basicmethodvalidation.3ed.Madison,WI: West-gardQC,Inc;2008.
25.WestgardJO,SteinB.Anautomaticprocessforselecting sta-tisticalQCprocedures toassureclinicaloranalytical quality requirements.ClinChem.1997;43:400---3.
26.WestgardJO, GrothT. Powerfunctions for statisticalcontrol rules.ClinChem.1979;25:863---9.
27.Darán M. Control de calidad en los laboratorios clínicos. Barcelona:EditorialRevertéS.A.;2002.
28.WestgardJ,EhrmeyerS,FallonKD.CLIAfinalrulesforquality systems.ClinChem.2004;1:107---17.