Bird species in Mediterranean pine plantations exhibit different characteristics to those in natural reforested woodlands
36
0
0
Texto completo
(2) 1. 1. Pine. plantations. 2. croplands favour bird species that exhibit different. 3. characteristics. 4. woodlands. 5. Short title: Bird species characteristics and restoration. 6. Ismael Galván · José M. Rey-Benayas. to. in. Mediterranean. those. in. natural. abandoned. reforested. 7. 8. I. Galván · J.M. Rey-Benayas. 9. Department of Ecology, Universidad de Alcalá, Edificio de Ciencias, Ctra. de. 10. Barcelona km 33'600, E-28871 Alcalá de Henares, Spain. 11 12. Present address of I. Galván:. 13. Department of Evolutionary Ecology, Estación Biológica de Doñana (CSIC),. 14. Avda. Americo Vespucio s/n, E-41092 Sevilla, Spain. 15. e-mail: ism.galvan@gmail.com. 16. Phone: +34 954 466 700. 17. Phax: +34 954 621 125.
(3) 2. 18. Abstract Passive woodland regeneration following cropland abandonment and pine plantations. 19. are two major approaches for vegetation restoration in agricultural landscapes in the. 20. Mediterranean Basin. We compared the effects of these two contrasting approaches on local. 21. bird density in central Spain on the basis of species characteristics, including regional density,. 22. habitat breadth, life-history traits and plumage colouration. Local bird density increased with. 23. regional density and habitat breadth in both woodland and pine plantation plots following. 24. macroecological patterns of bird abundance and distribution. In woodlands, dichromatic species. 25. were more abundant than monochromatic species and bird density increased with the intensity. 26. of territory defense and as the proportion of plumage colour generated by pheomelanin. 27. decreased. Contrary to our prediction, this latter observation suggests that woodlands may. 28. induce higher levels of physiological stress in birds than pine plantations albeit these represent. 29. a novel habitat change. In pine plantations, sedentary species were more abundant than. 30. migratory species and bird density was negatively related to body and egg mass. These traits of. 31. bird species in pine plantations are characteristic of good invading species. The variation in bird. 32. density explained by phylogeny was twice in pine plantations than in woodlands, suggesting. 33. that pine plantations limit accessibility to some clades. Our results support, from an evolutionary. 34. perspective, the described inability of pine plantations on cropland to maintain or increase bird. 35. diversity in Mediterranean agricultural landscapes.. 36. Key-words Habitat restoration · Life-history · Pheomelanin · Plumage colouration · Vegetation. 37. restoration. 38. 39. 40 41. 42.
(4) 3. 43. Introduction. 44. In the last decades, large tracts of cropland in the world have been abandoned or reforested,. 45. resulting in noticeable effects on biological communities (Laiolo et al. 2004; Rey-Benayas et al.. 46. 2007). Cropland abandonment can lead to secondary succession (Rey-Benayas et al. 2008),. 47. which may take several decades in low productivity environments such as Mediterranean areas. 48. (Bonet and Pausas 2004). Cropland reforestation has been proposed to gain forest land at a. 49. shorter timescale than that at which secondary succession occurs naturally. In the case of the. 50. Agrarian Common Policy scheme of the European Union, this has been done through tree. 51. plantations focused on pine species (Meijl et al. 2006). Reforestation with pines creates a. 52. vegetation structure that is different from that present in natural Mediterranean woodlands.. 53. Thus, natural Mediterranean woodlands present higher tree cover and less complexity of. 54. vegetation strata than pine plantations (Sirami et al. 2007; Rey-Benayas et al. 2010), hence the. 55. impacts of these plantations on biodiversity (Donald 2004). Therefore, pine plantations in. 56. croplands represent novel environments to be colonised by native wildlife.. 57. Birds represent the group of vertebrates on which the effects of vegetation change in. 58. Mediterranean areas has been most intensively studied (Díaz et al. 1998; Brotons and. 59. Herrando 2001; Santos et al. 2002; Suárez-Seoane et al. 2002; Tellería et al. 2003; Sirami et al.. 60. 2007, 2008a,b). These studies have focused on community-level effects. However, the. 61. autoecological characteristics of bird species that colonize newly forested habitats have. 62. received less attention, although the capacity of species to respond to changing landscapes has. 63. been recognized as an ultimate factor driving community dynamics (Sirami et al. 2008a).. 64. Habitat requirements are the autoecological features most often used to explain the success of. 65. bird species in colonising reforested systems in Mediterranean areas, as increases in tree. 66. canopy cover favour woodland species and trigger shrubland species that are characteristic of. 67. Mediterranean native habitats (Díaz et al. 1998; Suárez-Seoane et al. 2002; Sirami et al.. 68. 2008a,b). If pine plantations in croplands represent novel environments for native. 69. Mediterranean birds, the autoecological characteristics of species that inhabit them should be. 70. similar to those of successfully colonising or invading species. Additionally, these characteristics.
(5) 4. 71. may explain the success of birds in pine plantations. To our knowledge, a possible similarity. 72. between species colonising afforested habitats and invasive species has never been tested.. 73. Different traits predict the colonization success of birds, the most important of them. 74. being migratory strategy (Veltman et al. 1996; Sol and Lefebvre 2000; Sol et al. 2005), body. 75. mass (Veltman et al. 1996; Green 1997; Sol and Lefebvre 2000; Blackburn and Duncan 2001;. 76. Sol et al. 2002; Cassey et al. 2001), relative brain mass (Sol and Lefebvre 2000; Sol et al. 2002,. 77. 2005), clutch size (Veltman et al. 1996; Green 1997; Cassey 2001; Duncan et al. 2001) and. 78. sexual plumage dichromatism (Sorci et al. 1998; McLain et al. 1999). The size of the natural. 79. range of the species also has a role in the case of spontaneous (i.e. not facilitated by human. 80. interventions) invasions (Croci et al. 2007, Møller 2009). Therefore, bird species colonising pine. 81. plantations in Mediterranean areas should present the characteristics of overall invasive species. 82. (see specific predictions below). Here we test this hypothesis by comparing species. 83. characteristics that predict the abundance of birds in two scenarios that represent contrasting. 84. approaches for vegetation restoration in abandoned cropland in Mediterranean landscapes,. 85. namely secondary succession and active vegetation restoration. With this aim we surveyed bird. 86. species in stands under secondary succession (referred to as woodlands hereafter) or planted. 87. with coniferous trees (referred to as pine plantations hereafter) in central Spain, where these. 88. two contrasting trajectories of vegetation restoration depart from recently (< 60 years, mostly. 89. <15 years) abandoned cropland.. 90. We made the following predictions (Table 1). (1) Species that are sendentary, have. 91. small body mass and large clutch size should be more abundant than species with opposite. 92. characteristics in pine plantations, as these are characteristics of species with high rates of. 93. population growth and consequently are expected to have higher establishment success in. 94. novel environments (Duncan et al. 2003). Although species with high population growth also. 95. tend to have more variable population sizes, and this could increase their risk of extinction in. 96. novel environments (Duncan et al. 2003; Schaffner 2005), small body size is a predictor of. 97. establishment success across species (Cassey et al. 2001). As egg mass covaries with body. 98. mass across species (Sæther 1987; Poiani and Jermiin 1994), the same was predicted for egg. 99. mass. (2) Large relative brain mass should be a predictor of species density in pine plantations,.
(6) 5. 100. as this trait reflects behavioural flexibility (Sol and Lefebvre 2000) and, more specifically, the. 101. diversity of food type and technical innovations of species (Overington et al. 2009). (3) Sexually. 102. monochromatic species should be more abundant than dichromatic species in pine plantations,. 103. as the conspicuous colourations displayed by the latter reduce their capacity to adapt to novel. 104. environments due to predation vulnerability and an increased risk of extinction (Sorci et al.. 105. 1998; Møller and Nielsen 2006). (4) Bird species that do not defend territories during the. 106. breeding season should be more abundant in pine plantations than territorial species, as. 107. absence of territoriality is related to high population growth in animals and particularly in birds. 108. (López-Sepulcre and Kokko 2005). Similarly, absence of territoriality has been found to be. 109. related to high invasion success by birds in novel environments produced by urbanization (Blair. 110. and Johnson 2008). By contrast, territorial species should be more abundant in woodlands. 111. (Blair and Johnson 2008). We tested all these predictions controling for the effect of maximum. 112. observed density at a regional scale, as this variable should be positively related to the density. 113. of species in both contrasting vegetation restoration trajectories. Similarly, we controlled for the. 114. effect of regional habitat breadth (Croci et al. 2007), as high habitat breadth is indicative of. 115. common species that tolerate a wide range of ecological conditions (Carrascal and Seoane. 116. 2008).. 117. In addition, we tested if bird species density in the two contrasting vegetation restoration. 118. trajectories is differentially predicted by the extension of melanin-based plumage colouration.. 119. The expression of plumage colour generated by melanins is intrinsically related to oxidative. 120. stress (i.e. the imbalance between the production of reactive oxygen species and the state of. 121. the antioxidant and repair machinery; Galván and Alonso-Alvarez 2008, 2009; Galván and. 122. Solano 2009), and novel habitat changes such as pine plantations can cause physiological. 123. stress (i.e. physiological, hormonal or behavioural changes that occur as a response to. 124. unpredictable and noxious stimuli; sensu Romero 2004) in birds (Badyaev 2005), which in turn. 125. can induce oxidative stress (e.g. Lin et al. 2004). Thus, melanization levels of birds may predict. 126. their abundance in the contrasting trajectories of vegetation restoration. The extension of. 127. plumage colour generated by eumelanin (i.e. the darkest form of melanin) may predict species. 128. density in pine plantations because the production of this pigment proceeds under high levels of.
(7) 6. 129. endogenous oxidative stress, which would increase the tolerance to stress of these species. 130. (Galván and Alonso-Alvarez 2009; Galván and Solano 2009). By contrast, the production of. 131. pheomelanin (i.e. the lightest form of melanin) requires higher levels of antioxidants to proceed. 132. (Galván and Alonso-Alvarez 2009; Galván and Solano 2009), so species with a high proportion. 133. of pheomelanin-based plumage colour may be more limited to establish in pine plantations. 134. (Table 1; see also Møller et al. 2010 for similar predictions for access to dietary antioxidants).. 135. The results of this investigation will provide useful insights for explaining what kind of species is. 136. attracted by active restoration plots from the available species pool (Haila and Järvinen 1983),. 137. as well as mechanistic patterns of colonization of novel habitats by birds that are expanding in. 138. many regions across the world.. 139. 140. Materials and methods. 141. Study area. 142. We surveyed bird communities in a ca. 6,000 km2 area of the Mesomediterranean bioclimatic. 143. domain (Rivas-Martínez 1981) located in central Spain. Extreme coordinates for the area are. 144. 41º00’ N (North), 39º54’ N (South), 3º46’ W (West) and 2º51’ E (East). Altitude ranges between. 145. 631 and 1,008 m a.s.l. Climate in this region is continental Mediterranean, with cold winters and. 146. warm dry summers.. 147. Natural vegetation chiefly consists of evergreen forests dominated by holm oak Quercus. 148. rotundifolia. The degradation of these forests has led to more open woodland dominated by Q.. 149. ilex, Q. coccifera or Juniperus oxycedrus, or to shrubland dominated by Cistus ladanifer,. 150. Retama sphaerocarpa, camephytes such as Thymus and Lavandula species, and herbs (e.g.. 151. Stipa spp.). Large tracts of land were reforested with pine species (Pinus halepensis and P.. 152. pinea) after the 1950s and the oldest pine plantations are now considered semi-natural forests. 153. (Peñuelas and Ocaña 1996). Following subsidies from the European Union, some cropland. 154. area was planted almost entirely with P. halepensis after 1993. Thus, most afforested.
(8) 7. 155. abandoned cropland ranges between 3 and 15 years in age at the time we surveyed bird. 156. communities. The natural or semi-natural vegetation and pine plantations intermingle with. 157. farmland mostly consisting of rain-fed cereals and recently abandoned (<4 years old) cropland. 158. under secondary succession.. 159 160. Bird census. 161. We carried out bird censuses during the breeding season (April 28th and June 1st) of two. 162. consecutive years (2008–2009) by means of single-visit point-counts (Bibby et al. 2000), 10 min. 163. long each, recording all birds heard or seen within a 50-m radius plot. We did not consider. 164. overflying birds. We conducted the censuses by the same two well trained field technicians on. 165. windless and rainless days, between sunrise and 1100 h GMT in the morning. Point counts do. 166. not provide absolutes densities, but relative abundances. Nevertheless, the small area covered. 167. by the plots (0.78 ha), and the relatively long time devoted to bird counts, maximizes the. 168. detection probability of species and, thus, the accurate estimations of their abundance (Shiu. 169. and Lee 2003). Bird censuses were conducted in pine plantations and natural woodlands, and. 170. also in recently abandoned crops (< 4 years old) surrounding them because they contain. 171. species that could potentially occupy pine plantations and natural woodlands. We detected a. 172. total of 44 bird species (Online Resource 1). From these, two were present in neither pine. 173. plantations nor natural woodlands and were only detected in croplands (i.e. common skylark. 174. Alauda arvensis and common quail Coturnix coturnix; see Online Resource 1). These two. 175. species were nevertheless included in the analyses because they can potentially occupy pine. 176. plantations and natural woodlands. The remaining species were present in pine plantations. 177. and/or natural woodlands.. 178. Prior to sampling, we first explored the entire territory by means of aerial photographs. 179. and Google Earth, and then visited the potential survey localities to locate the census plots. A. 180. total number of 152 census plots were obtained in 48 localities distributed throughout the study. 181. area in an attempt to sample the whole availability of habitats and the gradient of altitudes (we. 182. censused every plots in one year only to maximize a wide regional coverage). We spanned.
(9) 8. 183. censuses of the different habitats considered throughout the study period, avoiding censusing. 184. certain habitats in only one year. We did not observe any clear inter-annual variation in bird. 185. abundance of the study species, so we pooled all the censuses obtained in both years. We geo-. 186. referenced the census plots with a portable GPS and interspersed these by at least 200 m from. 187. each other. We located them in order to include homogeneous habitat types of the study area.. 188. These main habitat types were abandoned cropland, pastureland, camephyte shrubland,. 189. shrubland (mainly of the genera Cistus and Genista), several stages of holm oak succession to. 190. mature stands, and a range of afforested croplands with pines (from seedlings to pine stands. 191. ca. 60 years old). We used these habitat types as a guideline to select the survey localities. Of. 192. the 152 plots, 62 were located in stands under woodland secondary succession, 75 in pine. 193. plantation stands, and 15 in recently (<4 years) abandoned cropland stands. A full description of. 194. habitat features in the census plots can be found in Rey Benayas et al. (2010).. 195 196. Bird regional density and habitat breadth. 197. We summarized regional patterns of distribution-abundance of the bird species detected in the. 198. 152 point counts according to maximum density and habitat breadth of species in the. 199. biogeographic region where the study area is included (Central Spain Mesomediterranean. 200. region). We estimated the maximum regional density (birds/km2) recorded in 13 major habitat. 201. types of the study region as a measure of the maximum ecological abundance that a species. 202. can attain in its most favourable environment. We established these 13 habitat types. 203. considering vegetation structure, floristic composition and human impact and these account for. 204. more than 95% of the surface of the whole study area. They were the following: two types of. 205. urban environments (according to building height and density), non-irrigated arable crops,. 206. irrigated arable crops, mixed orchards, vineyards, olive plantations, two types of shrubland. 207. (according to shrub height and density), pasturelands, pinewoods, deciduous woodlands and. 208. holm oak woodlands. We obtained the data base for this analysis from the Spanish SACRE. 209. program (monitoring of common breeding birds in Spain), using 3,417 five-min point-counts. 210. censused in 2004-2006, and distributed over the study area. We obtained absolute densities for.
(10) 9. 211. this data base using detectability provided by Carrascal and Palomino (2008) of the same. 212. census program.. 213 214. We calculated regional habitat breadth of species in the 13 major habitat types following Levins' (1968) index divided by the number of habitat categories:. 215. HB = [(Σpi2)-1]/13. 216. where pi is the proportion of the density for each species measured in the habitat i (dividing. 217. density in habitat i by the sum of all maximum densities recorded in the 13 habitat types). This. 218. index ranges between 1 (evenly distributed across the 13 habitat types) and 1/13 (only present. 219. in one habitat type).. 220 221. Morphological and life-history traits of birds. 222. We obtained body mass and brain mass of the bird species detected in the census plots from. 223. Mlikovsky (1989), Møller et al. (2005, 2006), Garamszegi et al. (2007a,b) and Møller (2008).. 224. Highly significant repeatabilities among studies indicate that information on brain mass can be. 225. combined across sources (Garamszegi et al. 2005). We calculated relative brain mass as the. 226. residuals of the log-log regression of brain mass against body mass. We obtained body mass. 227. from the same source as brain mass, but when brain mass was not available (six species;. 228. Online Resource 1), we took body mass from Lislevand et al. (2007).. 229. We took information on clutch size, egg mass and territorial behaviour from Lislevand et. 230. al. (2007). We defined territorial behaviour by a three-level variable: score 0: species in which. 231. males and females do not share resources and feed away from their breeding territory; score 1:. 232. species in which males and females share resources on their territory only during the breeding. 233. season; score 2: species in which males and females share resources on their territory all year. 234. round (Lislevand et al. 2007). These scores were consistent among observers (rS = 0.628 -. 235. 0.674, n = 1454 - 1629 species, P < 0.001; Lislevand et al. 2007). Territorial behaviour was not. 236. available for five species (Online Resource 1). We took information on the migratory strategy of.
(11) 10. 237. birds (trans-Saharan migrant, score 0 vs. resident, score 1) in the study area from Seoane and. 238. Carrascal (2007).. 239 240. Bird plumage colouration. 241. We obtained information on sexual dichromatism in plumage by examining illustrations in. 242. Cramp and Simmons (1977-1994) and photographs of birds captured in Spain from the. 243. Identification Atlas of Birds of Aragón (2010). We also examined text descriptions of plumage. 244. characteristics in these sources. We considered that a species was sexually dichromatic (score. 245. 1) when both sexes exhibited a conspicuous and clearly distinguishable difference in plumage. 246. colouration. Otherwise the species were categorised as monochromatic (score 0). Seddon et al.. 247. (2010) have recently shown that human visual assessment of sexual dichromatism is positively. 248. correlated with the avian perception of the trait. Althouh species that we consider sexually. 249. monochromatic may indeed be dichromatic regarding ultraviolet (UV) reflectance, to which we. 250. are blind, UV reflectance is generated by structural feather colourations (Prum 2006). However,. 251. most species in our list do not present such colourations, but they are mainly coloured by. 252. melanins. Thus, it is not likely that a classification of mono-/dichromatic species that consider. 253. UV reflectance significantly changes our conclusions.. 254. Eumelanic and pheomelanic traits are generally of distinctive colours, the formers being. 255. responsible for black and grey colours and the latters for yellowish, reddish, chestnut and brown. 256. colours (Toral et al. 2008). Eumelanin and pheomelanin normally occur simultaneously in the. 257. tissues (Ozeki et al. 1997), but the darker colours conferred by eumelanin (Toral et al. 2008). 258. make evident the lower content of this pigment in chestnut and brown colours as compared to. 259. black and grey colours (Galván and Alonso-Alvarez 2009). Furthermore, many bird species. 260. present feather melanin contents of high purity (> 90% of either eumelanin or pheomelanin;. 261. McGraw and Wakamatsu 2004; J.J. Negro pers. com.). Therefore, we considered that black and. 262. grey plumage colours were predominantly generated by eumelanin, while chestnut and brown. 263. colours were predominantly generated by pheomelanin. We did not consider conspicuous. 264. yellow or red colourations suspicious of being generated by other pigments (i.e. carotenoids),.
(12) 11. 265. unless chemically identified as melanin-based by Toral et al. (2008). Although a rough. 266. approximation to the real proportion of eumelanic and pheomelanic plumage, the assumption. 267. that black-grey colours are eumelanic and brown-chestnut colours are pheomelanic should be. 268. adequate for comparative purposes (Owens and Hartley 1998). Thus, one of us (IG) quantified. 269. the proportion of melanic plumage parts by examining illustrations in Cramp and Simmons. 270. (1977-1994) and photographs of birds captured in Spain from the Identification Atlas of Birds of. 271. Aragón (2010). Several authors have used this method previously (see, e.g., John 1995;. 272. Yezerinac and Weatherhead 1995; Caro 2009), and it has been shown to be a reliable method. 273. of quantifying different components of plumage colour that is even correlated with the avian. 274. perception of colour (del Val et al. 2009; Seddon et al. 2010). We examined illustrations of both. 275. resting and flying birds. We followed the method used by Beauchamp and Heeb (2001) and. 276. Galván (2008) to obtain estimates of the proportion of eu- and pheomelanic colour present in. 277. the plumage of each species, assigning scores that ranged from 0 (total lack of melanic colour). 278. to 5 (all melanic). When a species was sexually dichromatic regarding the type of melanin-. 279. based colouration (i.e. eumelanic vs. pheomelanic), we averaged eumelanic and pheomelanic. 280. scores obtained for males and females. Our scores were highly correlated with those assigned. 281. by an independent observer (eumelanin-based colour score: rs = 0.85, n = 44 species, P <. 282. 0.0001; pheomelanin-based colour score: rs = 0.93, n = 44 species, P < 0.0001).. 283 284. Data analyses. 285. We analysed the relationships between the response variables (average bird density in the two. 286. contrasting vegetation restoration trajectories) and ecological, morphological and life-history. 287. traits of the species (predictor variables) by means of Partial Least Squares Regressions. 288. (hereafter PLSR; Carrascal et al. 2009), using the species as the sample unit (n = 44). This. 289. statistical tool is an extension of multiple regression analysis where associations are established. 290. with factors extracted from predictor variables that maximize the explained variance in the. 291. dependent variable. These factors are defined as a linear combination of independent variables,. 292. so the original multidimensionality is reduced to a lower number of orthogonal factors to detect.
(13) 12. 293. structure in the relationships between predictor variables and between these factors and the. 294. response variable. The extracted factors account for successively lower proportions of original. 295. variance. We calculated the relative contribution of each variable to the derived factors by. 296. means of the square of predictor weights. Results obtained with PLSR are similar to those from. 297. conventional multiple regression techniques; however, it is extremely robust to the effects of. 298. sample size and degree of correlation between predictor variables, which makes PLSR. 299. especially useful when sample size is low and in cases of severe multicollinearity (Carrascal et. 300. al. 2009). We introduced all predictor variables as continuous variables (log-transformed) in the. 301. PLSR models, except migratory strategy and sexual dichromatism that were introduced as. 302. categorical factors.. 303. Bird species are evolutionarily related through phylogeny, and therefore, they should not. 304. be treated as independent sample units (Felsenstein 1985). Therefore, the effect of common. 305. ancestry among taxa can lead to an overestimation of degrees of freedom if phylogenetic. 306. relationships are not taken into account. We used phylogenetic eigenvector regression (PVR) to. 307. quantify the amount of phylogenetic signal and to correct for it in the analysis of the relationship. 308. between bird density and ecological, morphological and life-history traits (Diniz-Filho et al.. 309. 1998). Diniz-Filho and Torres (2002) and Martins et al. (2002) tested several comparative. 310. methods (Felsenstein’s independent contrasts, autoregressive method, PVR, and phylogenetic. 311. generalized least squares) and found that PVR yields good statistical performance regardless of. 312. the details of the evolutionary mode used to generate the data and provides similar results to. 313. other methods, with very good (i.e., low) error types I and II. Moreover, PVR does not assume. 314. any a priori evolutionary model (an advantage if the true evolutionary model is unknown or if it is. 315. too complex) and has similar statistical performance even under evolutionary processes distinct. 316. from Brownian motion.. 317. We took the phylogenetic hypothesis (Online Resource 2) from the species-level. 318. supertree constructed by Davis (2008). Since this supertree was not calibrated as it was made. 319. from different phylogenies that used different methods, we set all branch lengths equal to unity. 320. in our compiled phylogeny, thus assuming a speciational model of evolution..
(14) 13. 321. We first performed a Principal Coordinates Analysis (PCORD) on the matrix of pairwise. 322. phylogenetic distances between the 44 bird species (after a double-center transformation). In a. 323. second step we selected the first 10 eigenvectors to account parsimoniously for the. 324. phylogenetic signal. Eigenvectors extracted from double-centered phylogenetic distance. 325. matrices are able to detect the main topological features of the cladogram under different. 326. sample sizes or number of taxa used in the analyses (Diniz-Filho et al. 1998). We found that the. 327. original matrix of phylogenetic distances between the 44 bird species and the reproduced matrix. 328. of distances estimated based on the first 10 eigenvectors were very similar (Mantel test with. 329. 999 randomised matrices to estimate significance: r = 0.920, P < 0.001; test carried out using. 330. PopTools 3.1; Hood 2009). We used these eigenvectors as additional predictor variables in the. 331. PLSR models described above in order to control for phylogeny.. 332. We used the Akaike information criterion (AIC) (Burnham and Anderson 2004) to. 333. corroborate the results obtained with the PLSR models. With this aim we selected the most. 334. important predictor variables that resulted from the PLSR models (i.e. those with predictor. 335. weights that retained > 5% of the information content of the PLSR axes) and performed a. 336. Generalized Linear Model (GLM) for the dependent variables and these predictor variables. We. 337. calculated the Akaike's second order information criterion (AICc) and weights (w) for all possible. 338. models with these variables, considering that two models were equally probable if the difference. 339. in AICc (ΔAICc) or the division of their weights was > 2 (Burnham and Anderson 2004). We. 340. carried out all analyses using MVSP version 3.13 (Covach Computing Services) and Statistica. 341. 8.0 (StatSoft Inc.).. 342 343. Results. 344. Bird density in woodlands. 345. The PLSR model generated an axis that explained 22.1% of variation in bird density in. 346. woodland plots. Bird density was significantly correlated with this axis (Table 2, Fig. 1). This. 347. PLSR component was positively related to maximum regional density, sexual dichromatism (i.e..
(15) 14. 348. dichromatic species were more abundant than monochromatic species), and territorial. 349. behaviour (i.e. bird density increased with the intensity of territory defense) (Table 2; Fig. 2). By. 350. contrast, the PLSR component was negatively related to pheomelanic plumage colour score,. 351. indicating that the lower the proportion of plumage generated by pheomelanin, the more. 352. abundant the species (Table 2). Eumelanic plumage colour score and body mass also. 353. contributed, though to a lesser degree (4.4% of variance), to the information content of the. 354. positive and negative parts, respectively, of the PLSR component (Table 2). EV1-EV10 alone. 355. retained 22.9% of the information content of the PLSR component, and as this component. 356. accounted for 22.1% in original variance (Table 2), the phylogenetic signal in bird density in. 357. plots under passive restoration was 22.1 x 0.229 = 5.1%.. 358. AIC corroborated the conclusions of the PLSR model. After considering the most. 359. important factors contributing to the information content of the PLSR axis (i.e. maximum. 360. regional density, plumage dichromatism, pheomelanic plumage score, territoriality, EV1 and. 361. EV2), we found that the model entering maximum regional density, plumage dichromatism and. 362. pheomelanic plumage score presented the lowest AICc value and the highest weight. There. 363. were no other probable models, as the lowest ΔAICc was 4.4 and the lowest division between. 364. AIC weights was 9.2. Maximum regional density, plumage dichromatism and pheomelanic. 365. plumage score were the factors that retained > 10% in the information content of the PLSR axis. 366. (Table 2).. 367 368. Bird density in pine plantations. 369. The PLSR model generated an axis that explained 30.0% of bird density variation in pine. 370. plantations. Bird density was significantly correlated with this axis (Fig. 1). This PLSR. 371. component was positively related to maximum regional density and to the migratory strategy. 372. (i.e. resident species were more abundant than migratory species), and negatively related to. 373. body and egg mass (Table 2). Regional habitat breath was also positively related, though to a. 374. lesser degree (4.8%), to this PLSR component (Table 2). EV1-EV10 alone retained 36.6% of.
(16) 15. 375. the information content of the PLSR component, meaning that the phylogenetic signal in bird. 376. density in pine plantations was 11.0%.. 377. The results from AIC also highlighted the importance of the factors that retained > 10%. 378. in the information content of the PLSR axis, that is, maximum regional density and egg mass. 379. (Table 2). Thus, the lowest AICc value corresponded to the model entering maximum regional. 380. density, egg mass and EV7, which was of similar probability (ΔAICc = 1.5) than the model that. 381. only included maximum regional density. The division of AIC weights for these models was,. 382. however, > 2 (2.1), suggesting that the model entering maximum regional density, egg mass. 383. and EV7 was more likely. The rest of model comparisons yielded a lowest value for ΔAICc of. 384. 2.4 and for AIC weights division of 3.4.. 385 386. Discussion. 387. Overall, we found that density of bird species occurring at two contrasting trajectories of. 388. vegetation restoration in agricultural Mediterranean landscapes, namely natural woodland under. 389. secondary succession and pine plantations, are explained by a range of ecological and life-. 390. history traits, melanin-based plumage colouration, and phylogenetic variables. As expected,. 391. local bird density increased with maximum density that the species attain at a regional level. 392. and, to a lesser degree, with regional habitat breadth in plots at both trajectories (Tables 1 and. 393. 2). This finding is in agreement with well described patterns that follow Brown’s (1984). 394. superorganism theory, i.e those species that better exploit resources will attain higher density,. 395. broader habitat breadth and larger geographical ranges (see Rey-Benayas et al. 1999 for a. 396. review of concepts). However, other species characteristics differed between the two. 397. contrasting trajectories of vegetation restoration.. 398 399. Life-history traits.
(17) 16. 400. We recorded the highest observed densities of birds in pine plantations in species with small. 401. body mass, low egg mass and do not migrate, while these traits did not contribute to explain. 402. bird density in plots under secondary succession. The effect of territoriality on bird density in. 403. pine plantations was low but in the predicted direction, i.e. bird density tended to be higher in. 404. non-territorial species. These characteristics of bird species in pine plantations are similar to. 405. those of good invasive species (Veltman et al. 1996; Green 1997; Sol and Lefebvre 2000;. 406. Blackburn and Duncan 2001; Cassey 2001; Duncan et al. 2001; Sol et al. 2002, 2005).. 407. Not all characteristics of the most abundant species in pine plantations were similar to. 408. those of good invasive species (Table 1). Different studies have shown that species. 409. accomplishing high invasion success are those with large clutch size (Duncan et al. 2003) and. 410. have high behavioural flexibility as reflected by large relative brain mass (Sol and Lefebvre. 411. 2000; Sol et al. 2002, 2005), and others show that sexual plumage dichromatism may also play. 412. a role (Sorci et al. 1998; McLain et al. 1999). Neither clutch size, relative brain mass nor. 413. plumage dichromatism importantly contributed to explain bird density in the studied pine. 414. plantations. However, the characteristics of the most abundant bird species that we recorded in. 415. pine plantations may not completely resemble those of spontaneous invading species because. 416. pine plantations do not represent completely novel environments for birds as this habitat type is. 417. actually surrounded by a matrix of croplands and natural woodland. However, the number of. 418. species traits shared with good invaders is significantly high for the number of species detected. 419. in our census plots, suggesting that the characteristics of invading species can predict. 420. establishment success in novel environments generated by pine plantations even at a small. 421. scale as that considered here.. 422. Bird density in woodland plots was explained by different life-history traits than those. 423. that explained bird density in pine plantations. In woodlands, territoriality was the most relevant. 424. factor that affected bird density, and this effect was in the opposite direction to that observed in. 425. pine plantations (i.e. bird density increased and decreased with the intensity of territory defense. 426. in woodlands and pine plantations, respectively, though in the latter the effect was weak). Other. 427. studies found that novel environments favour non-territorial species, whereas more natural sites. 428. promote territorial behaviour (Blair and Johnson 2008), probably because the absence of.
(18) 17. 429. territoriality is associated with high population growth that favours the establishment of. 430. populations in novel environments (Duncan et al. 2003). Bird density in woodlands was higher. 431. in dichromatic species than in monochromatic species, in contrast to the observed pattern in. 432. good invading species (Sorci et al. 1998; McLain et al. 1999). This suggests that natural. 433. selection on plumage conspicuousness may be relaxed in natural environments as compared to. 434. novel environments (Møller and Nielsen 2006), as species may not be forced to present. 435. behavioural adaptations that are constrained by plumage conspicuousness (Sorci et al. 1998),. 436. and may thus suffer lower predation rates in secondary woodlands as compared to pine. 437. plantations. We found that bird density was not only unconstrained, but even positively related. 438. to plumage dichromatism in woodlands. This is probably due to the fact that plumage. 439. dichromatism is associated with intense sexual selection, and polygynous mating prevents. 440. extinction of small populations (Legendre et al. 1999) such as those present in fragmented. 441. natural Mediterranean forests in our study region (Tellería and Santos 1995).. 442 443. Melanin-based plumage colouration. 444. Our predictions for melanin-based plumage colouration were fulfilled in woodlands instead of. 445. pine plantations. As the production of pheomelanin occurs with high levels of endogenous. 446. antioxidants (Galván and Alonso-Alvarez 2009; Galván and Solano 2009), maintaining these. 447. physiological conditions should be constrained in novel stressful environments such as pine. 448. plantations for species in which natural selection has favoured the genetic mechanism that tips. 449. melanogenesis towards the production of pheomelanin (Galván and Solano 2009). The. 450. particular antioxidant whose levels must be high for pheomelanin synthesis (i.e. glutathione,. 451. GSH), is not only under genetic control, but also highly sensitive to several environmental. 452. factors in birds and other vertebrates (Sewalk et al. 2001; Galván and Alonso-Alvarez 2009), so. 453. stress induced by novel habitat changes can potentially affect GSH levels and exert selection. 454. pressures on individuals of species that differ in the proportion of melanin-based plumage. 455. colouration. Indeed, human-induced degradation of forest patches increases corticosterone (i.e..
(19) 18. 456. a physiological stress-related hormone) levels in birds (Suorsa et al. 2003), and corticosterone. 457. increases can produce oxidative stress (e.g. Lin et al. 2004).. 458. Our results suggest that the density of bird species with large extension of pheomelanic. 459. plumage colouration is limited in woodlands but not in pine plantations. A similar tendency of. 460. lower magnitude (Table 2) but in the opposite direction, as expected from the low antioxidant. 461. levels required for eumelanogenesis (Galván and Alonso-Alvarez 2008, 2009; Galván and. 462. Solano 2009), was found for the proportion of eumelanic plumage. Thus, it is possible that pine. 463. plantations, albeit representing a novel habitat change, induce lower levels of physiological. 464. stress in birds than woodlands. This would agree with the observation that, in our study area,. 465. bird species richness is higher in pine plantations than in woodland patches (Rey-Benayas et al.. 466. 2010). It is not likely that our results are due to pine plantations providing better camouflage. 467. benefits to pheomelanic birds than secondary woodlands, as pine plantations support a larger. 468. development of tree canopy as compared to secondary woodlands (Díaz et al. 1998; Rey-. 469. Benayas et al. 2010), while most pheomelanic species probably predominate in more open. 470. habitats (pers. obs.). Furthermore, we made our analyses controling for the habitat breadth of. 471. birds.. 472. Our results highlight the capacity of melanin-based colouration to predict bird density,. 473. although they should be tested by future studies measuring antioxidants in birds in the different. 474. vegetation restoration trajectories. In bird species that exhibit discrete colour morphs differing in. 475. the type of plumage melanin, fitness disadvantages have been shown for individuals belonging. 476. to the pheomelanic morph as compared to individuals of the eumelanic morph (Brommer et al.. 477. 2005), especially in stressful environments (Roulin et al. 2008). These findings may support our. 478. prediction that pheomelanism should limit the capacity of individuals to cope with stressful. 479. environmental conditions. To our knowledge, this is the first time that melanin-based colouration. 480. is found to be a predictor of population dynamic characteristics at an interspecific level.. 481 482. Phylogenetic effects on bird density.
(20) 19. 483. Finally, we found that bird density presented a low phylogenetic signal in both vegetation. 484. restoration trajectories, and that it was twice as large in pine plantations as in woodlands. This. 485. suggests that pine plantations limit accessibility for some clades. This limitation is not high, but. 486. certainly higher than in woodlands, and suggests the existence of selection pressures acting on. 487. birds establishing in these afforested habitat patches in addition to those related to life-history. 488. traits that reflect the capacity to colonize new environmental conditions.. 489 490. Conclusions. 491. Our results support from an evolutionary perspective the inability of pine plantations established. 492. as a result of cropland reforestation with coniferous species to maintain or increase bird. 493. diversity in Mediterranean areas reported by other authors (Díaz et al. 1998; Maestre and. 494. Cortina 2004). Thus, programs of cropland reforestation in Mediterranean regions should. 495. consider a range of tree species and approaches that allow conciliation of vegetation restoration. 496. and biota conservation.. 497 498. Acknowledgements We are indebted to Irene Razola and Jorge Meltzer for their assistance to. 499. survey birds and to Luis M. Carrascal for suggestions that greatly improved the manuscript. This. 500. research was funded by the Spanish Ministry of Science and Education (project CGL2007-. 501. 60533-BOS) and the Madrid Government REMEDINAL project (S2009AMB-1783).. 502 503. References. 504. Badyaev AV (2005) Stress-induced variation in evolution: from behavioural plasticity to genetic. 505 506 507. assimilation. Proc R Soc B 272:877-886. Beauchamp G, Heeb P (2001) Social foraging and the evolution of white plumage. Evol Ecol Res 3:703–720..
(21) 20. 508 509 510 511 512 513 514 515 516 517 518 519 520 521 522 523 524 525 526 527 528 529 530 531. Bibby CJ, Burgess ND, Hill DA, Mustoe SH (2000) Bird census techniques, 2nd edn. Academic Press, London. Blackburn TM, Duncan RP (2001) Determinants of establishment success in introduced birds. Nature 414:195-197. Blair RB, Johnson EM (2008) Suburban habitats and their role for birds in the urban-rural habitat network: points of local invasion and extinction? Landscape Ecol 23:1157-1169. Bonet A, Pausas JG (2004) Species richness and cover along a 60-year chronosequence in old-fields of southeastern Spain. Plant Ecol 174:257–70. Brommer JE, Ahola K, Karstinen T (2005) The colour of fitness: plumage coloration and lifetime reproductive success in the tawny owl. Proc R Soc B 272:935-940. Brown JH (1984) On the relationship between abundance and distribution of species. Am Nat 124:255-279. Burnham KP, Anderson DR (2004) Multimodel inference: understanding AIC and BIC in model selection. Sociol Method Res 33:261-304. Caro T (2009) Contrasting coloration in terrestrial mammals. Philos Trans R Soc B 364:537548. Carrascal LM, Palomino D (2008) Tamaño de población de las aves comunes reproductoras en España en 2004-2006. SEO/BirdLife, Madrid. Carrascal LM, Seoane J (2008) Explanations for bird species range size: ecological correlates and phylogenetic effects in the Canary Islands. J Biogeogr 35:2061–2073. Carrascal LM, Galván I, Gordo O (2009) Partial least squares regression as an alternative to current regression methods used in ecology. Oikos 118:681-690. Cassey P (2001) Determining variation in the success of New Zealand land birds. Global Ecol Biogeogr 10:161-172..
(22) 21. 532 533 534 535 536 537. Cramp S, Simmons KEL (1977-1994) The birds of the Western Palearctic. Oxford University Press, Oxford. Croci S, Le Quilliec P, Clergeau P (2007) Geographical range as predictor of spatial expansion of invading birds. Biodivers Conserv 16:511-524. Davis KE (2008) Reweaving the tapestry: a supertree of birds. PhD Thesis, University of Glasgow.. 538. del Val E, Borràs A., Cabrera J, Senar JC (2009) Plumage colour of male Common Crossbills. 539. Loxia curvirostra: visual assessment validated by colorimetry. Revista Catalana. 540. d'Ornitologia 25:19-25.. 541. Diniz-Filho JAF, Torres NM (2002) Phylogenetic comparative methods and the geographic. 542. range size – body size relationship in new world terrestrial carnivora. Evol Ecol 16:351-. 543. 367.. 544 545 546 547 548 549. Diniz-Filho JAF, De Sant'ana CER, Bini LM (1998) An eigenvector method for estimating phylogenetic inertia. Evolution 52:1247-1262. Donald P (2004) Biodiversity impacts of some agricultural commodity production systems. Conserv Biol 18:17–37. Duncan RP (1997) The role of competition and introduction effort in the success of passeriform birds introduced to New Zealand. Am Nat 149:903-915.. 550. Duncan RP, Bomford M, Forsyth DM, Conibear L (2001) High predictability in introduction. 551. outcomes and the geographical range size of introduced Australian birds: a role for. 552. climate. J Anim Ecol 70:621-632.. 553 554 555. Duncan RP, Blackburn TM, Sol D (2003) The ecology of bird introductions. Annu Rev Ecol Evol S 34:71-98. Felsenstein J (1985) Phylogenies and the comparative method. Am Nat 125:1–15..
(23) 22. 556 557 558 559. Galván I (2008) The importance of white on black: unmelanized plumage proportion predicts display complexity in birds. Behav Ecol Sociobiol 63:303-311. Galván I, Alonso-Alvarez C (2008) An intracellular antioxidant determines the expression of a melanin-based signal in a bird. PLoS ONE 3:e3335.. 560. Galván I, Alonso-Alvarez C (2009) The expression of melanin-based plumage is separately. 561. moduated by exogenous oxidative stress and a melanocortin. Proc R Soc B 276:3089-. 562. 3097.. 563. Galván I, Solano F (2009) The evolution of eu- and pheomelanic traits may respond to an. 564. economy of pigments related to environmental oxidative stress. Pigment Cell Melanoma. 565. Res 22:339-342.. 566 567 568 569. Garamszegi LZ, Eens M, Erritzøe J, Møller AP (2005) Sperm competition and sexually size dimorphic brains in birds. Proc R Soc B 272:159–166. Garamszegi LZ, Erritzøe J, Møller AP (2007a) Feeding innovations and parasitism in birds. Biol J Linn Soc 90:441-455.. 570. Garamszegi LZ, Biard C, Eens M, Møller AP, Saino N, Surai P (2007b) Maternal effects and the. 571. evolution of brain size in birds: Overlooked developmental constraints. Neurosci. 572. Biobehav R 31:498-515.. 573 574 575 576. Green RE (1997) The influence of numbers released on the outcome of attempts to introduce exotic bird species to New Zealand. J Anim Ecol 66:25–35. Haila Y, Järvinen O (1983) Land bird communities on a Finnish island: species impoverishment and abundance patterns. Oikos 41:255-273.. 577. Hood GM (2009) PopTools version 3.1.1. Available at http://www.cse.csiro.au/poptools. 578. Identification. 579. Atlas. of. Birds. of. Aragón. (2010). Available. http://www.ibercajalav.net/actividades.php?codopcion=2251&codopcion2=2502. at.
(24) 23. 580 581 582 583 584 585. Iwaniuk AN, Nelson JE (2003) Developmental differences are correlated with relative brain size in birds: a compartive analysis. Can J Zool 81:1913-1928. John JL (1995) Haematozoan parasites, mating systems and colourful plumages in songbirds. Oikos 72:395-401. Laiolo P, Dondero F, Ciliento E, Rolando A (2004) Consequences of pastoral abandonment for the structure and diversity of the alpine avifauna. J Appl Ecol 41:294–304.. 586. Legendre S, Clobert J, Møller AP, Sorci G (1999) Demographic stochasticity and social mating. 587. system in the process of extinction of small populations: the case of passerines. 588. introduced to New Zealand. Am Nat 153:449-463.. 589 590. Levins R (1968) Evolutions in changing environments: Some theoretical explorations. Princeton University Press, Princeton.. 591. Lin H, Decuypere E, Buyse J (2004) Oxidative stress induced by corticosterone administration. 592. in broiler chickens (Gallus gallus domesticus): 2. Short-term effect. Comp Biochem. 593. Physiol B 139:745-751.. 594 595 596 597 598 599 600 601 602 603. Lislevand T, Figuerola J, Székely T (2007) Avian body sizes in relation to fecundity, mating system, display behavior, and resource sharing. Ecology 88:1605. López-Sepulcre A, Kokko H (2005) Territorial defense, territory size, and population regulation. Am Nat 166: 317-329. Maestre FT, Cortina J (2004) Are Pinus halepensis plantations useful as a restoration tool in semiarid Mediterranean areas? Forest Ecol Manag 198:303-317. Martins EP, Diniz-Filho JAF, Housworth EA (2002) Adaptive constraints and the phylogenetic comparative method: A computer simulation test. Evolution 56:1-13. McGraw KJ, Wakamatsu K (2004) Melanin basis of ornamental feather colors in male Zebra Finches. Condor 106:686-690..
(25) 24. 604. McLain DK, Moulton MP, Sanderson JG (1999) Sexual selection and extinction: the fate of. 605. plumage-dimorphic and plumage-monomorphic birds introduced onto islands. Evol Ecol. 606. Res 1:549–565.. 607. Meijl H van, Rheenen T van, Tabeau A, Eickhout B (2006) The impact of different policy. 608. environments on agricultural land use in Europe. Agr Ecosyst Environ 114:21–38.. 609. Mlikovsky J (1989) Brain size in birds: 2. Falconiformes through Gaviiformes. Vest Cs Spolec. 610 611 612 613 614 615 616 617 618 619 620 621 622. Zool 53:200-213. Møller AP (2008) Flight distance and population trends in European breeding birds. Behav Ecol 19:1095-1102. Møller AP (2009) Successful city dwellers: a comparative study of the ecological characteristics of urban birds in the Western Palearctic. Oecologia 159:849–858. Møller AP, Nielsen JT (2006) Prey vulnerability in relation to sexual coloration of prey. Behav Ecol Sociobiol 60:227-233. Møller AP, Erritzøe J, Garamszegi LZ (2005) Covariation between brain size and immunity in birds: implications for brain size evolution. J Evol Biol 18:223-237. Møller AP, Nielsen JT, Garamszegi LZ (2006) Song post exposure, song features, and predation risk. Behav Ecol 17:155-163. Møller AP, Erritzøe J, Karadas F (2010) Levels of antioxidants in rural and urban birds and their consequences. Oecologia 163:35-45.. 623. Overington SE, Boogert NJ, Morand-Ferron J, Lefebvre L (2009) Technical innovations drive. 624. the relationship between innovativeness and residual brain size in birds. Anim Behav. 625. 78:1001-1010.. 626 627. Owens IPF, Hartley IR (1998) Sexual dimorphism in birds: why are there so many different forms of dimorphism? Proc R Soc B 265:397-407..
(26) 25. 628. Ozeki. H,. Ito. S,. Wakamatsu. K,. Ishiguro. I. (1997). Chemical. characterization. of. 629. pheomelanogenesis starting from dihydroxyphenylalanine or tyrosine and cysteine.. 630. Effects of tyrosinase and cysteine concentrations and reaction time. Biochim Biophys. 631. Acta 1336:539–548.. 632 633. Peñuelas JL, Ocaña L (1996) Cultivo de plantas forestales en contenedor. Ministerio de Agricultura, Pesca y Alimentación y Mundi-Prensa, Madrid.. 634. Poiani A, Jermiin LS (1994) A comparative analysis of some life-history traits between. 635. cooperatively and non-cooperatively breeding Australian passerines. Evol Ecol 8:471-. 636. 488.. 637. Prum RO (2006) Anatomy, physics, and evolution of structural colours. In: Hill GE, McGraw KJ. 638. (eds) Bird coloration, volume I: mechanisms and measurements. Harvard University. 639. Press, Cambridge, pp 295–353.. 640. Rey-Benayas JM, Scheiner M, García S, Colomer M, Levassor, C. (1999) Commonness and. 641. rarity: theory and application of a new model to Mediterranean montane grasslands.. 642. Conserv Ecol 3:5.. 643. Rey-Benayas JM, Martins A, Nicolau JM, Schulz J (2007) Abandonment of agricultural land: an. 644. overview of drivrs and consequences. Perspectives in Agriculture, Veterinary Science,. 645. Nutrition and Natural Resources 2:057.. 646. Rey-Benayas JM, Bullock JM, Newton AC (2008) Creating woodland islets to reconcile. 647. ecological restoration, conservation, and agricultural land use. Front Ecol Environ. 648. 6:329–336.. 649. Rey-Benayas JM, Galván I, Carrascal LM (2010) Differential effects of vegetation restoration in. 650. Mediterranean abandoned cropland by secondary succession and pine plantations on. 651. bird assemblages. Forest Ecol Manag 260:87-95.. 652 653. Rivas-Martínez S (1981) Les étages biaclimatiques de la végétation de la Péninsule Ibérique. Anales Jard Bot Madrid 37:251–268..
(27) 26. 654 655 656 657 658 659. Romero LM (2004) Physiological stress in ecology: lessons from biomedical research. Trends Ecol Evol 19:249-255. Roulin A, Gasparini J, Bize P, Ritschard M, Richner H (2008) Melanin-based colorations signal strategies to cope with poor and rich environments. Behav Ecol Sociobiol 62:507-519. Sæther BE (1987) The influence of body weight on the covariation between reproductive traits in European birds. Oikos 48:79-88.. 660. Santos J, Tellería JL, Carbonell R (2002) Bird conservation in fragmented Mediterranean. 661. forests of Spain: effects of geographical location, habitat and landscape degradation.. 662. Biol Conserv 105:113-125.. 663 664 665 666. Schaffner U (2005) What makes a species invasive? Environmental Documentation Nr. 191. Swiss Agency for the Environment, Forests and Landscape, Berne. Seddon N, Tobias J, Eaton M, Odeen A (2010) Human vision can provide a valid proxy for avian perception of sexual dichromatism. Auk 127:283-292.. 667. Seoane J, Carrascal LM (2007) Interspecific differences in population trends of Spanish birds. 668. are related to habitat and climatic preferences. Global Ecol Biogeogr 17:111-121.. 669. Sewalk CJ, Brewer GL, Hoffman DJ (2001) Effects of diquat, an aquatic herbicide, on the. 670 671 672 673 674. development of mallard embryos. J Toxicol Env Heal A 62:33–45. Shiu HJ, Lee PF (2003) Assessing avian point-count duration and sample size using species accumulation functions. Zool Stud 42:357-367. Sirami C, Brotons L, Martin JL (2007) Vegetation and songbird response to land abandonment: from landscape to census plot. Divers Distrib 13:42–52.. 675. Sirami C, Brotons L, Martin JL (2008a) Spatial extent of bird species response to landscape. 676. changes: colonisation/extinction dynamics at the community-level in two contrasting. 677. habitats. Ecography 31:509-518..
(28) 27. 678. Sirami C, Brotons L, Burfield I, Fonderflick J, Martin JL (2008b) Is land abandonment having an. 679. impact on biodiversity? A meta-analytical approach to bird distribution changes in the. 680. north-western Mediterranean. Biol Conserv 141:450–459.. 681 682 683 684 685 686 687 688. Sol D, Lefebvre L (2000) Behavioural flexibility predicts invasion success in birds introduced to New Zealand. Oikos 90:599-605. Sol D, Timmermans S, Lefebvre L (2002) Behavioural flexibility and invasion success in birds. Anim Behav 63:495-502. Sol D, Duncan RP, Blackburn TM, Cassey P, Lefebvre L (2005) Big brains, enhanced cognition, and response of birds to novel environments. Proc Nat Acad Sci USA 102:5460-5465. Sorci G, Møller AP, Clobert J (1998) Plumage dichromatism of birds predicts introduction success in New Zealand. J Anim Ecol 67:263-269.. 689. Suárez-Seoane S, Osborne PE, Baudry J (2002) Responses of birds of different biogeographic. 690. origins and habitat requirements to agricultural land abandonment in northern Spain.. 691. Biol Conserv 105:333–344.. 692. Suorsa P, Huhta E, Nikula A, Nikinmaa M, Jäntti A, Helle H, Hakkarainen H (2003) Forest. 693. management is associated with physiological stress in an old-growth forest passerine.. 694. Proc R Soc B 270:963-969.. 695 696. Tellería JL, Santos T (1995) Effects of forest fragmentation on a guild of wintering passerines: The role of habitat selection. Biol Conserv 71:61-67.. 697. Tellería JL, Baquero R, Santos T (2003) Effects of forest fragmentation on European birds:. 698. implications of regional differences in species richness. J Biogeogr 30:621-628.. 699. Toral GM, Figuerola J, Negro JJ (2008) Multiple ways to become red: pigment identification in. 700 701 702. red feathers using spectrometry. Comp Biochem Physiol B 150:147-152. Veltman CJ, Nee S, Crawley MJ (1996) Correlates of introduction success in exotic New Zealand birds. Am Nat 147:542–557..
(29) 28. 703 704. Yezerinac SM, Weatherhead PJ (1995) Plumage coloration, differential attraction of vectors and haematozoa infections in birds. J Anim Ecol 64:528-537..
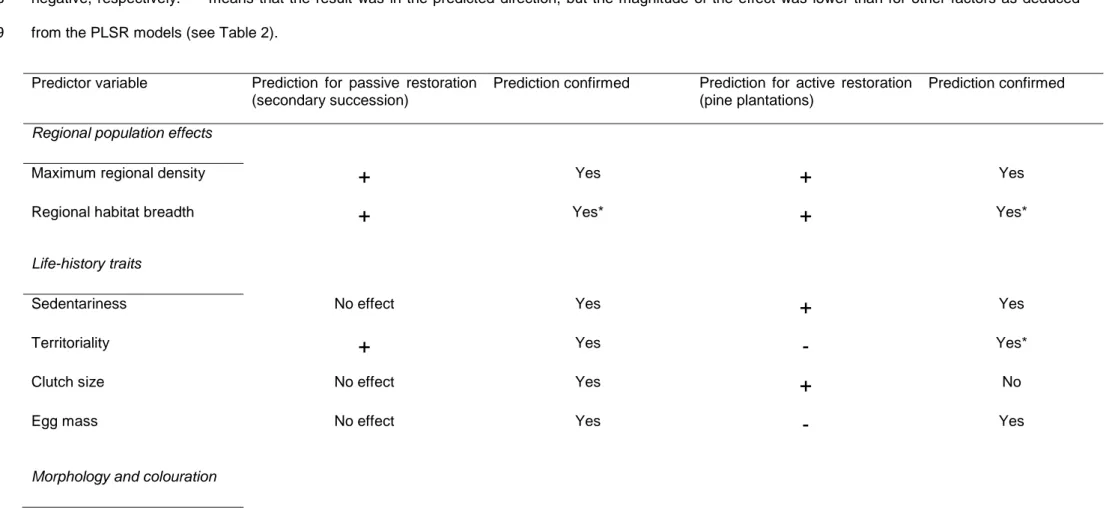
(30) 29. 705. Table 1 Predictions made for bird species density in two contrasting trajectories of vegetation restoration in agricultural landscapes of Central Spain regarding. 706. ecological, life-history and morphological traits, and results obtained in the present study considering that the most abundant bird species establishing in a. 707. novel habitat type (i.e. pine plantations) should exhibit characteristics of good invaders. '+' and '-' indicate that the effect on bird density should be positive and. 708. negative, respectively. '*' means that the result was in the predicted direction, but the magnitude of the effect was lower than for other factors as deduced. 709. from the PLSR models (see Table 2). Predictor variable. Prediction for passive restoration (secondary succession). Prediction confirmed. Prediction for active restoration (pine plantations). Prediction confirmed. Regional population effects Maximum regional density. +. Yes. +. Yes. Regional habitat breadth. +. Yes*. +. Yes*. No effect. Yes. +. Yes. Territoriality. +. Yes. -. Yes*. Clutch size. No effect. Yes. +. No. Egg mass. No effect. Yes. -. Yes. Life-history traits Sedentariness. Morphology and colouration.
(31) 30. 710 711 712 713 714 715 716 717. Body mass. No effect. Yes. -. Yes. Relative brain mass. No effect. Yes. +. No. Sexual dichromatism. No effect. No. -. No. Eumelanic plumage score. No effect. In the other restoration trajectory. +. In the other restoration trajectory. Pheomelanic plumage score. No effect. In the other restoration trajectory. -. In the other restoration trajectory.
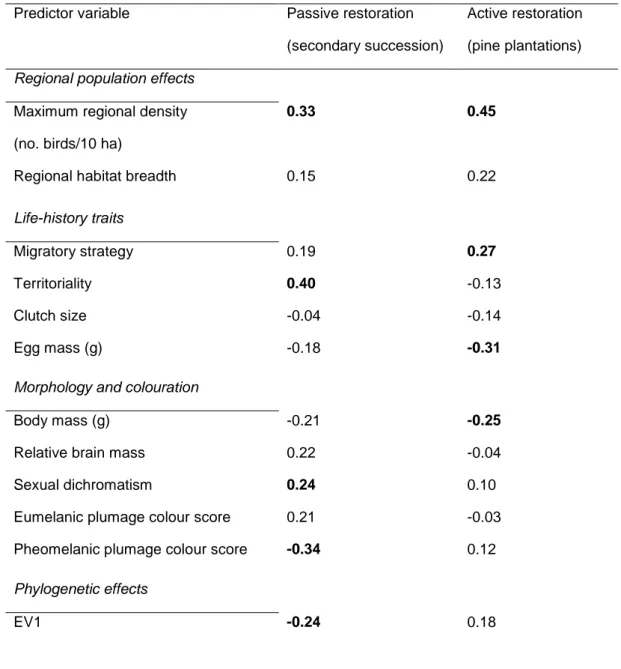
(32) 31. 718. Table 2 Predictor weights of the two Partial Least Squares Regression (PLSR) analyses. 719. explaining the relationship between the average density of 44 bird species occurring in 152. 720. surveyed census plots (50 m radius; birds/10 ha) in two contrasting trajectories of vegetation. 721. restoration in agricultural landscapes of Central Spain (response variables) and ecological, life-. 722. history and morphological traits of the species (predictor variables). Additional predictor. 723. variables account for variability due to phylogenetic effects, which are computed from the first. 724. 10 eigenvectors (EV1 to EV10) obtained from Principal Coordinates Analysis applied to the. 725. matrix of pairwise phylogenetic distances between the 44 bird species. Predictor weights. 726. represent the contribution of each predictor variable to the PLSR axis. Predictor weights that. 727. retain > 5% of the information content of the PLSR axis are shown in bold type. Predictor variable. Passive restoration. Active restoration. (secondary succession). (pine plantations). 0.33. 0.45. 0.15. 0.22. Migratory strategy. 0.19. 0.27. Territoriality. 0.40. -0.13. Clutch size. -0.04. -0.14. Egg mass (g). -0.18. -0.31. Body mass (g). -0.21. -0.25. Relative brain mass. 0.22. -0.04. Sexual dichromatism. 0.24. 0.10. Eumelanic plumage colour score. 0.21. -0.03. Pheomelanic plumage colour score. -0.34. 0.12. -0.24. 0.18. Regional population effects Maximum regional density (no. birds/10 ha) Regional habitat breadth Life-history traits. Morphology and colouration. Phylogenetic effects EV1.
(33) 32. 728 729 730 731 732 733 734 735 736 737 738 739 740 741. EV2. -0.29. -0.03. EV3. -0.08. 0.23. EV4. -0.12. -0.06. EV5. -0.01. 0.20. EV6. -0.01. 0.05. EV7. 0.11. 0.29. EV8. -0.12. -0.14. EV9. -0.01. 0.26. EV10. 0.20. 0.25. % variance accounted for. 22.1. 30.0. Eigenvalue. 2.25. 2.02.
(34) 33. 742. Fig. 1. Relationship between average bird density and the scores of a PLSR component. 743. collecting information on ecological, life-history, morphological and phylogenetic traits in 44 bird. 744. species detected in 152 census plots in two contrasting restoration trajectories in agricultural. 745. landscapes of Central Spain. Phylogenetic effects were computed from the first 10 eigenvectors. 746. (EV1 to EV10) obtained from Principal Coordinates Analysis applied to the matrix of pairwise. 747. phylogenetic distances between the 44 bird species. Regression lines and Pearson correlation. 748. tests for both trajectories are shown.. 749 750. Fig. 2. Relationship between average bird density in secondary succession (woodland) plots. 751. and territoriality score of the species (0: species in which males and females do not share. 752. resources and feed away from their breeding territory; 1: species in which males and females. 753. share resources on their territory only during the breeding season; 2: species in which males. 754. and females share resources on their territory all year round). For illustrative purposes, the size. 755. of the data points increases logarithmically with the number of species. The line is the. 756. regression line.. 757 758 759 760 761 762 763 764 765 766.
(35) 34. 767 768 769 770 771 772 773 774 775 776 777 778 779 780 781 782 783 784 785 786 787 788 789 790 791 792 793 794 795. Figure 1.
(36) 35. 796 797. 799 800 801 802 803 804 805. Bird species density (no. birds/10ha). 798. 16 14 12 10 8 6 4 2 0 -2. 806. 0. Territoriality score. 807 808 809. 1. Figure 2. 2.
(37)
Figure
Documento similar
Other variables were highly influential at some of the spatial scales, showing a greater resistance in pine forests or plantations with a higher diversity of pine sizes, greater
In addition, given the widespread use of prescription benzodiazepines in society, and their diversion to the illicit drug market, the increase in new benzodiazepines might also
The GINI index shows that in Mediterranean Europe the rates of unemployment, risk of poverty, social exclusion, and social inequality were similar in 2019 to those during
Parallel analyses of a tropical tree species, Symphonia globulifera L.f., and two Mediterranean pine species, Pinus pinaster Aiton and Pinus halepensis Miller, allowed me to
The model simulated how an infectious migrant bird belonging to a species in the a R group arrived in the Ebre Delta at the beginning of each period of study, and then represented
Observed number of species was relatively high in comparison with other studies in the Mediterranean, and we found no effects of fragment characteristics on species density,
The main objectives of this thesis were: (1) to investigate variations on bird abundance and species richness in the fields, with respect to past haying events
Karst (PCAB) are the two tree species, which constitute the timberline ecotone in the Tatra Mountains, Western Carpathians, however Stone pine also frequently lives in the
