Evidence on the role of ownership structure on firms’ innovative performance
20
0
0
Texto completo
(2) 12 Ortega-Argiles. 232. 28/9/09. 12:30. Página 232. Ortega-Argilés, R. and Moreno, R.. tado innovador dependa de un sistema de factores relacionados con las características internas de las empresas y que están influenciadas por el ambiente. Específicamente, con respecto a los determinantes internos de las empresas, se analizan el efecto de la concentración de la propiedad, la composición de las juntas directivas y el efecto de la naturaleza de la propiedad (extranjera y pública). Además, para capturar los determinantes del ambiente en el cual la firma opera, se consideran otras variables referentes a la internacionalización del mercado, las economías de la aglomeración y las externalidades regionales del conocimiento. Para determinar el impacto de estos determinantes en el número de patentes y en los modelos de utilidad obtenidos por la empresa, considerando el carácter discreto de la variable. Aplicamos los modelos de Poisson y binomiales negativos para una evaluación más completa de la hipótesis en un panel de empresas industriales españolas. Los resultados muestran que la actividad de desarrollo de patentes se ve favorecida positivamente al estar localizada en una región de alta actividad innovadora, debido a la existencia de externalidades de conocimiento y de economías de aglomeración. Clasificación JEL: D210, O310, G320. Palabras clave: Función de producción de conocimiento, patentes, I+D, estructura de propiedad, regiones.. 1. Introduction The Knowledge Production Function (KPF) framework originally developed by Griliches (1979) has been widely used to analyse the relationship between firms’ R&D investment and patent applications, the latter seen as a relevant, although not perfect, measure of the technological effectiveness of R&D activities. This basic model was lately modified so that the increment of the innovative output depends upon a number of further factors related to the internal characteristics of the firms and environmental variables related with the market and the region where the firm is operating. The literature shows that a company’s ability to innovate depends on a series of factors, in such a way that whether or not they are present has a favourable or unfavourable influence on the innovation process. Among others, these factors may be placed in the following groups: 1. The existence of favourable conditions in the demand structure or in market size, in the life cycle of the products the company manufactures, or in the evolution of the scientific procedures and technology it employs. The conditions of the environment are mainly captured by the characteristics of the market and the region where the firm decides to be located. 2. The resources the company allocates to engineering, design, research and marketing. These favourable conditions together with the company’s technical capacity need to be integrated within the framework of an innovative strategy in order that the following factors can be called into play:.
(3) 12 Ortega-Argiles. 28/9/09. 12:30. Página 233. Evidence on the role of ownership structure on firms’ innovative performance 233. 3. The company’s management and organisational structure. 4. The company’s desire to differentiate its products or processes from those of its competitors. While many studies analyse specific factors that determine the company’s ability to patent very few incorporate variables related with the corporate governance characteristics. Aspects related to the ownership structure of the firm, such as the level of ownership concentration, the composition of the decision-making powers or the nature of this ownership, among others, have been avoided in the innovative literature so far. Although, there exist a number of papers that analyse the influence of some corporate governance variables on the R&D investments (Hosono et al., 2004; Hill and Snell, 1988; Czarnitzki and Kraft, 2003), in our knowledge there are few works that explain the effect of some variables related with the management and the organisational and ownership structure on the firm innovative performance measured by patents. A few attempts in the literature try to explain this relationship focussing the attention to the information asymmetries between managers and owners in the firm decision-making process. On the one hand, the literature pointed that large shareholders have strong incentives in profit maximization and enough control over the assets of the firm to put pressure on managers to have their interest respected and risky projects maintained (Shleifer and Vishny, 1997). In the same line, some studies explain that the concentration of capital in a small number of owners helps to align the management team with the shareholders’ interests, leading to reducing high risk investment policies such as the ones of innovation, and to a loss of some of the benefits of specialisation (Hill and Snell, 1988; Burkart et al., 1997). The question to address from these studies is: has the concentration of the ownership in few hands a direct impact of firm innovative performance? On the other hand, the incorporation of owners in the management positions and the composition of the boards of directors appear to be relevant in the process of resource allocation devoted to innovative activities. The entrepreneurship literature put emphasis in the role played by the entrepreneur, which most people recognize as meaning someone who organizes and assumes the risk of a business in return of the profits. In many cases (and in almost all large corporations), owners delegate decisions to salaried managers, and the question is: are independent directors better suited as decision-makers for innovative strategies than insiders? The owners have appropriate information about firm’s activities and this is fruitful to enhance innovation, but in most cases, the innovative activities carry out “new combinations” by such things as introducing new products or processes, identifying new exports markets or sources of supply, or creating new types of organization and the owner needs judgment to deal with the novel situations connected with innovation (Casson, 1991; Crespi, 2004). Some others papers have focussed their research in the analysis of the effect of the nature of the ownership and the presence of outsiders on the innovative result. It is frequently argued that branch plants have a relatively low level of autonomy with regard to major decisions. So, in the case of centralization of decisions within a fo-.
(4) 12 Ortega-Argiles. 234. 28/9/09. 12:30. Página 234. Ortega-Argilés, R. and Moreno, R.. reign parent company, the implementation of innovations originating at the plant level is likely to be considered at a corporate rather than plant level (Bishop and Wiseman, 1999). Also, publicly-owned firms are characterized for developing a risk adverse competitive strategy in all the investments in which they are involved (Lafuente et al., 1985). In fact, the literature analysing the subject of ownership has provided interesting papers with the objective of studying the relationship between ownership and performance (Gugler and Yurtoglu, 2003; Demsetz and Lehn, 1985; Himmelberg et al., 1999; Leech and Leahy, 1991; Mørck et al., 1988; Smith and Watts, 1992). The debate in the corporate governance literature goes back to Berle and Means (1932) with the suggestion of an inverse relation between the diffuseness of shareholdings and firm performance. Ownership structure thus seems to be an important issue when adopting risky decisions such as innovation investments. However, as far as we know, there is very little evidence concerning the role that may be played by a company’s ownership structure on its innovative performance, and especially on its patenting activity. In this paper we analyse the impact that some internal and external variables may have on firm patenting activities. As regards to the internal characteristics of the firm, we focus our attention in the characteristics of the ownership structure, although we also control for the traditional ones (size, age and sector). Regarding the external characteristics of the firm, we focus our attention on the environment in which the firm is developing its activity. The environment can be characterized by the determinants of the market were the firm operates and the determinants of the region where the firm is located. On the one hand, the market where the firm is operating is determinant in characterising the innovative behaviour of the firms. Operating in highly competitive markets creates a pushing effect that forces firms to secure their innovation from the competitors to maintain their market shares. The presence of Porter externalities, which are due to the fact that the firm is operating in a highly competitive and specialized environment, is higher in markets characterized by an international or global dimension. On the other hand, being located in a highly innovative region generates knowledge spillovers creating a favourable environment for innovation (Audretsch and Feldman, 1999 and 2005, Greunz, 2004 and van der Panne, 2004). The innovative regional dimension, captured by a strong regional innovative intensity (by means of the presence of highly innovative inputs) or regional innovative performance (by means of a high innovation output per citizen), creates agglomerating forces and knowledge externalities exerting a positive impact in the firms operating in such regions (basically Marshall-Arrow-Romer —MAR— and Jacobs externalities). The accessibility to labour force or the industrial dynamicity generates agglomeration economies that influence positively the innovative behaviour of the located firms (Autant-Bernard, 2001). The regional or local firms’ competition for ideas, which are embodied in individual employees, is determined by industry-specific firm-employment ratio: the more firms per employee, the better individuals are enabled to pursue and implement new ideas due to a higher dynamicity in the area. Basically, we can summarize that this paper evaluates the influence of internal and external characteristics of the firm on the patenting activity in the context of a.
(5) 12 Ortega-Argiles. 28/9/09. 12:30. Página 235. Evidence on the role of ownership structure on firms’ innovative performance 235. knowledge production function. The empirical analysis will be carried out for a sample of Spanish manufacturing firms from the period 1990-2002. Due to the lower share of firms that account patents in our sample, we decided to include the utility models or models of use, as an appropriate measure of the innovative activity of the firm in the same line than other authors (Beneito, 2006). Given the discreteness of the output variable, econometric models for count panel data are considered. The paper is structured as follows. After this introduction with a short review of the literature related to the subject, section two describes the methodology, discussing the advantages of the method of analysis chosen. Section three describes the data and the variables to be introduced in the analysis. We then describe the main results from our study in section five. Finally, section six concludes.. 2. Methodology The basic model considers patents as a function of contemporary and/or lagged flow of the firms’ R&D expenditures. In this paper we consider a group of determinants in the KPF such as the firm’s size and age, the technological opportunity and the competition level of the sector to which the firm belongs to, aspects related with the market and the location where the firm is operating as well as some additional ones related to the ownership concentration and status of the firm. The usual way to deal with the discrete non-negative nature of the patent dependent variable is to consider a count data model, among which the most common is the Poisson regression model, in which the number of events, given a set of regressors x, has a Poisson distribution with parameters where i indexes firms and t indexes time periods: λit = exp (xit β) = exp [β0 + β1 log (RDit) + β2zit ] so that is the vector of parameters to be estimated, RD is the flow of R&D expenditures and z represents the other determinants of patents (for a short description of the variables see Table 1). We can use the time series dimension to control for unobserved heterogeneity in the cross sectional unit. A key advantage of longitudinal data over cross-sectional data is that it permits more general types of individual heterogeneity. The firm-specific term of either the random or fixed effect models proxy unobserved firm-specific propensity to patent. The application of the Poisson model requires equality of means and variance, which is not always met in practice. If the data show an excess of zeros, the standard errors of the Poisson model will be biased to the low end, giving spurious high values for the t statistics (Cameron and Trivedi, 1990). The most common formulation for taking into account this excess of zeros is the negative binomial model, which does not impose equidispersion in the dependent variable. This assumes that the variance is a quadratic function of the mean. We will estimate both type of models3. 3. Moreover we have estimated two more count data models, the Zero-inflated Poisson model and the Zero-inflated Negative Binomial model for the pooled sample. The estimated results remain practically the same..
(6) 12 Ortega-Argiles. 236. 28/9/09. 12:30. Página 236. Ortega-Argilés, R. and Moreno, R.. 3. Dataset and variables 3.1. Dataset The database used is the Survey of Entrepreneurial Strategies (Encuesta sobre Estrategias Empresariales, henceforth ESEE) produced by the “Public Enterprise Foundation” of Spain for what is today the Ministry of Science and Technology (previously the Ministry of Industry and Energy). The Public Enterprise Foundation’s Economic Research Programme designed the survey, supervises its annual production and maintains the database. The ESEE is a statistical research project that surveys a number of companies representing manufacturing industries in Spain on an annual basis. Its design is relatively flexible and it has two applications. On the one hand, it provides in-depth knowledge of the industrial sector’s evolution over time by means of multiple data concerning business development and company decisions. The ESEE is also designed to generate microeconomic information that enables econometric models to be specified and tested. As far as its coverage is concerned, the reference population of the ESEE is companies with ten or more workers in what is usually known as manufacturing industry. The geographical area of reference is Spain, and the variables have a timescale of one year. One of the most outstanding characteristics of the ESEE is its high degree of representativeness. The ESEE contemplates the production activity of firms aggregated to a 2-digit level corresponding to the manufacturing sector. This aggregation in 20 industries corresponds to the NACE-CLIO4. 3.2. Internal firm characteristics As Beneito (2003) points out, the possibility offered by the ESEE of considering not only patents, but also utility models, is particularly important in a sample where the number of SMEs, as we will see later, is considerable. Large proportions of innovations in SMEs are incremental innovations and are not reflected as patents. However, the consideration of utility models may serve to compensate for this, as long as they are a means of protecting incremental innovations. Therefore, the number of patents and utility models obtained by a firm in the years under analysis is the dependent variable (PAT). A utility model can be seen as an exclusive right granted for an invention, which allows the holder to prevent others from using the protected invention commercially for a limited period of time, without authorization. The requirements for acquiring utility models are less stringent than for patents, their term of protection is shorter and they vary from country to country. Utility models are much cheaper to obtain and maintain, and finally, in some countries utility model protection can only be obtained in certain fields of technology and then only for products, not for processes. We include as firm innovative inputs the variable RD. It is constructed as the logarithm of the total R&D expenditures incurred by the firm in a given year. Thus, ac4. NACE is a general industrial classification of economic activities within the European Union and CLIO is the Classification and Nomenclature of the Input-Output table. Both classifications are officially recognised by the Accounting Economic System (National Institute of Statistics INE: http://www.ine.es)..
(7) 12 Ortega-Argiles. 28/9/09. 12:30. Página 237. Evidence on the role of ownership structure on firms’ innovative performance 237. Table 1. Variables. Variables in the model Description. PAT RD RD-2 RDMEAN SIZE AGE SHARE OWN. Number of national patents, foreign patents and utility models R&D expenses (base=1992) in logs Two year lagged R&D expenses in logs Mean of the R&D expenses during the last three years in logs Number of employees (31st December) in logs Years since the company was first founded in logs Percentage of the company’s share capital in hands of the main shareholder Percentage of the owners or relatives in management positions of the total number of employees 1 for firms that have foreign capital; 0 otherwise FOR 1 for firms that have public or state capital; 0 otherwise PUB 1 for firms belonging to a high technological opportunity sector; 0 otherwise5 HIGH 2-digit sectoral dummy variables SECTOR 1 for firms whose main market is the international one; 0 otherwise MARKET EMPLREG Ratio of the employment of the region over the total employment of Spain. INNOVREG 1 for firms locating in a region with technological opportunity higher than the average level Number of registered patents per resident accounted in the region PATREG Ratio of the R&D expenditures in the region over the total R&D investment in Spain RDREG Year dummies YEAR. cording with the literature, we can expect that as higher firm research and development expenses as higher the number of patents accounted by the firm. The variable SHARE reflects the effects of the mechanism that seeks to increase the concentration of ownership and so control managerial behaviour. This variable describes, therefore, the percentage of the company’s share capital in the hands of the main shareholder6. A high concentration may act as a mechanism to relieve any agency problems arising from the lack of identity between ownership and control. However, a high degree of control wielded by the owners over the management team, owing to a high level of concentration, can lead to a reduction in the number of highrisk investments and, hence, fewer innovative activities. A number of studies conclude that while concentration may reduce the agency problem, it might also mean 5 High technological opportunity sectors are: Office machinery, computers and optics; Chemical products; Mechanical equipment; Electronic machinery; Motors and autos; other transport material; Publishing and graphic arts. Medium sectors are: the meat industry; food and tobacco products; beverages; rubber and plastics; non-metallic mineral products; metallurgy; metal products. Low sectors are: textiles and clothing, leather and footwear, wood; paper; furniture and other manufacturing industries (this classification has also been used in Lafuente and Lecha 1988 and Beneito 2003, among others). 6 The variable SHARE has been built using the information of the question survey “State whether other company or companies has a stake into the company’s capital. If that was the case, please state the percentage owned by the company with the biggest stake”. For the relative high values of the variable distribution the variable captures the concentration of the ownership in a more severe way, in the case of lower values it can be the case that the results appear a bit biased to the higher ones..
(8) 12 Ortega-Argiles. 238. 28/9/09. 12:30. Página 238. Ortega-Argilés, R. and Moreno, R.. that the firm no longer enjoys the benefits of specialisation (Burkart et al., 1997; Hill and Snell, 1988).Therefore, the expected effect on patenting activity would be negative, because of the limited action of the managers in making high-risk decisions such as those involved in introducing innovative activities. The variable OWN, is the number of owners or family members holding management posts expressed as a percentage of the company’s total staff as of 31 December in the years analysed7. This variable seeks to reflect how the appointment of owners to decision-making posts may alleviate problems associated with the separation of ownership and management functions. Such a separation has a series of advantages which businesses cannot ignore, in particular in terms of specialisation and the greater efficiency with which this endows the decision-making process. In the specific case of investment decisions, the effect of this separation of functions and the reduced specialisation of the management team can lead to cuts in investment for the development of activities related to a firm’s growth opportunities, which is the case of patent accounts. Therefore a negative effect of having owners in management positions is expected on the volume of patents acquired by the firm. Some other variables explaining the nature of the corporate ownership are included. On the one hand, the foreign ownership influence is explained by the dichotomous variable FOR, which takes the value of the unit when the firm has foreign ownership and a null value when the all the ownership is domestic. On the other hand, the effect of having public ownership is captured by the dichotomous variable PUB, which takes the value of the unit when the ownership of the firm is partially or totally public and a null value otherwise. These dichotomous variables have been used to analyse the cross-effects of the having a concentrated ownership or having owners in management positions and at the same time being partly or totally foreign or public company. The variables describing the company’s internal structure include the variable SIZE, which shows the size of the business8 —the total number of personnel as of 31 December; and the variable AGE, which shows the company’s age or maturity— the number of years since the company was first founded. As regards the former, Schumpeter (1942) emphasised the positive influence of size on innovation, while a number of theoretical studies claim that larger companies have potentialities such as economies of scale, lower risk, a larger market and greater opportunities for appropriation (Fernández, 1996). However, empirical studies do not describe such a clear picture. So we find those that report a positive relationship between size and innovation (Scherer, 1992; Scherer and Ross, 1990; Love et al., 1990; Cohen and Kleeper, 1996; among others), and others that are unable to confirm this positive influence (Mansfield, 1964; Acs and Audretsch, 1991; among others, who report that small firms have 7. The variable OWN has been constructed with the information of family members or relatives in managerial posts. The fact that a similar variable has been used in other studies for classifying family and nonfamily firms shows that the results of this particular variable will reflect mostly the problems of the identification of managers and owners in the case of Spanish business family firms (Ortega-Argilés, 2007). 8 Other variables such as total sales might also have been considered. In previous analyses we have observed that results remain the same regardless of the variable used to proxy firm size..
(9) 12 Ortega-Argiles. 28/9/09. 12:30. Página 239. Evidence on the role of ownership structure on firms’ innovative performance 239. an innovative advantage in highly innovative industries and in highly competitive markets). The age variable has also been widely studied as a determinant of a firm’s innovative activities. A firm’s age indicates the experience and knowledge that it has accumulated throughout its history and seems to be linked to a better management of its communication systems and of higher levels of the creativity needed to innovate, as well as to a more effective capacity to absorb (Galende and De la Fuente, 2003). The expected sign for the age variable, in line with the literature, is therefore positive. We have classified the firms into different categories depending on the technological opportunity of the sector to which they belong, since technological opportunity can be considered as being determined by the characteristics of the specific industrial sector. Variables of this type would seem to capture various dimensions of technology including technological opportunity, technology life-cycle, the necessity for complementary and specialised assets when implementing innovations and appropriability regimes (either by protection strategies of intellectual property rights as a barrier to entry, or by informal processes such as the first-mover advantage or a continuous implementation of innovation processes). Following Lafuente et al. (1985), the industrial sectors are classified here as presenting high, medium or low technological opportunities9. In order to avoid perfect multicollinearity, we have eliminated the middle category. Therefore, the variable HIGH is a dichotomous variable which takes the value 1 when the company belongs to a high technological opportunity sector of activity and 0 when it does not. We expect those companies belonging to high opportunity sectors to show greater innovative activity than those belonging to medium opportunity sectors. In some specifications of the model a set of two-digit dummy variables has been included to analyse in more detailed way how the technological opportunity may differ between different sectors of activity. Taking into account the effect that the environment in which the firm is operating can have on its capability to innovate, some variables are taken into consideration. Trying to capture the competitive environment where the firm operates, the variable MARKET has been included. This provides information concerning the geographical area of the main market. It is a dichotomous variable that classifies companies according to whether their market is greater than, or equal to, the national area. It takes the null value when it is smaller than the national area. This variable shows the effect on R&D activities of a company’s decision to expand its market to a larger geographical area, with an a priori expectation that firms with a larger main market carry out innovative activities with greater intensity10.. 9. High technological opportunity sectors are: office machinery, computer processing, optical and similar equipment; chemical products; machinery and mechanical equipment; electrical and electronic machinery and material; motors and autos; other transport material, publishing and graphic arts. Medium sectors are: the meat industry; food and tobacco products; beverages; rubber and plastics; non-metallic mineral products; Metallurgy; metal products. Low sectors are: Textiles and clothing, leather and footwear, wood; Paper; Furniture and other manufacturing industries. (This classification has also been used in Lafuente et al., 1988 and Beneito, 2003, among others). 10 Several studies include factors related to the market characteristics in which a firm operates. See, for example, Blundell et al. (1999), Crépon et al. (1998), Kraft (1989), Licht and Zoz (1998), among others..
(10) 12 Ortega-Argiles. 240. 28/9/09. 12:30. Página 240. Ortega-Argilés, R. and Moreno, R.. 3.3. Firm location determinants Finally, some additional variables have been constructed to complement the baseline model and capture the effects of firm location. The fact that the ESEE is not representative in a regional way, forces us to use another source of data for capturing the regional effects. We use the data for the Spanish National Statistical Institute (INE) and the Spanish Office of Patents and Trademarks. The dichotomous variable INNOVREG, which describes the innovative behaviour of the region in which the firm is located, places firms in one of two categories: the firms that are located in a region with technological opportunities (R&D expenses per employee) higher than the mean for the Spanish regions take the value 1, while those with a score lower than the mean take a value of 0. The regions that are considered as having the higher technological opportunity level in Spain are Catalonia, Madrid, Navarre, Valencia and the Basque Country. We expect the firms located in a region with high technological opportunities to have greater possibilities of obtaining R&D output. The variable EMPLREG is based on information from the Encuesta Industrial, and tries to pick up the effect of the agglomeration economies. It is constructed as the ratio of manufacturing employment in each region11 over the total manufacturing employment in Spain for the year under observation. This variable tries to capture the economic industrial dynamicity of the region, and will explain how the presence of MAR or Jacobs externalities coming from being situated in a region with high economic activity can influence the patent activity of the firm. The higher the ratio, the higher the accessibility to a better endowment of human capital and the industrial activity of the region. The hypothesis that can be tested is therefore that agglomeration economies incentive competiveness increasing the patentability of the firms located in such regions. The variable PATREG and RDREG capture the regional knowledge spillovers. The variable PATREG, one of the traditional proxies of regional absorptive capacities, is constructed as the number of the registered patents per resident in the region where each firm is located and shows the patentability effort of the region. A positive relation has been postulated between the absorptive capacity at the regional level and the innovative performance of the firms located in the region. The expected effect is that the innovative performance of the region causes a positive effect into the firms that are registered in such region. With regard to the variable RDREG, another traditional proxy of regional absorptive capacity, it captures the innovative effort of the region where the firm is located, and is constructed by the amount of R&D expenses of the region over the total amount of R&D expenses accounted in Spain during the year under consideration. In an intuitive way, we may think that the transformation of inputs into innovative outputs requires some time, which has motivated us to include the two-year lagged value of this variable. A positive effect of the innovative past R&D effort of the region is expected on the patentability activity of the firms located in it. Similar results was 11. The study considers as a region the so called Comunidades Autónomas..
(11) 12 Ortega-Argiles. 28/9/09. 12:30. Página 241. Evidence on the role of ownership structure on firms’ innovative performance 241. found by Bottazzi and Peri (2003) that demonstrate that increasing the R&D in one region is found to increase innovation output capture by patent applications. That R&D generates tacit knowledge not easily transferred over large distances is a common result in much of the empirical literature on knowledge spillovers (Jaffe, Trajtenberg and Henderson, 1993; Griffith, Harrison and Van Reenen, 2006; Griffith, Lee and Van Reenen, 2007). In order to check the robustness of the model, some additional specifications have been checked, the inclusion of lagged values of the innovation input variable (RD-2), or the average of R&D expenditures in the last three years (RDMEAN) are some of them.. 4. Empirical findings Table 2 gives some descriptive statistics regarding the main variables in our study. Table 2. Variables PAT RD RDMEAN SIZE AGE SHARE OWN. Descriptive analysis. Mean. Min. Median. Max. Std. Dev.. Share Diff. from 0. 0.6557 123918.8 3.1279 270 23 27.86 2.72133. 0 1 1 1 0 0 0. 0 0 0 47 25 0 0. 500 1.40e+08 17.4767 25363 266 100 100. 7.1390 1579794 5.2624 837 22 41.1956 5.4396. 8.69 23.04 20.53 ————-. As can be seen, the patent activity is not surprisingly higher in the Spanish manufacturing sector, less than 9% of the firms do patent. With respect to the R&D expenditures, only around 23% of the firms appear to invest in R&D. Regarding the previous two variables, it is worthy to point out the huge overdispersion that account the two continuous variables based on patent and R&D information. Table 3 presents the estimation results for the KPF for our baseline specification. Special attention is paid to the firm internal ownership structure. Table 4 presents the estimation results distinguishing by technological opportunity of the sector. Table 5 presents the estimation results for the model including the regional context in which the firm is operating. Finally, Table 5 includes as well some robustness checks with different specifications of the R&D input variable. All the tables include the results obtained with the estimation of a count-data model using both the poisson and the negative binomial model, taking into account the over-dispersion in the dependent variable, the total number of patents and utility models that the firm accounts every year. Since we want to do inference on the population, the assumption of using the random-effects estimation when we are sampling on a larger population of firms seems reasonable since a random-effects specification assumes that individual specific.
(12) 12 Ortega-Argiles. 242. 28/9/09. 12:30. Página 242. Ortega-Argilés, R. and Moreno, R.. constant terms are randomly distributed across cross-sectional units (Cameron and Trivedi, 1998). This section will summarize the results focussing on the determinants that have been included in the different specifications of the model. The coefficients of current and lagged R&D expenditures are all significant and positive, although with a value which is slightly lower than those found in other empirical studies (see table 5 for the robustness checks in which different specification of the R&D effort have been taken into account). Regarding the firm internal determinants, firm size has the expected positive sign in all the specifications of the model, a result in line with the literature (Scherer, 1965; Schumpeter, 1942; among others). The age of the firms appears to have a negative effect, the more mature is the firms the fewer patents it accounts; although when we run the analysis only for the firms belonging to high technological opportunity level (Table 4) we found that the maturity of the firm can increase the chances of patenting. There seems to be learning by doing effect in these particular set of sectors. This can easily be explained by the fact that firms that are operating in these sectors have a more competitive environment and their innovations have to be protected in order to maintain their market share (Table 4). As regards to the technological opportunity level of the sector of activity, firms belonging to high-tech sectors have a positive effect of accounting patents. These results are similar to earlier reports for the Spanish case (Busom, 1993; Gumbau, 1997). Also as expected, the number of patents increases with the geographical extent of the market. Concerning the variables regarding the ownership and management structure of the firm, we have found same results in the different specifications of the model. Mainly, ownership concentration presents a negative and significant effect, that is, the greater the concentration of capital in one person or group, the lower the volume of patents. Among other reasons, one may argue that closely-held firms could limit the action of the managers in risky decisions, moving the firm away from the benefits of specialisation. However, the effect of ownership concentration on patenting is not independent of its foreign or public nature. This is shown by the significant parameters of the multiplicative variables relating the concentration ownership and its status. Closely-held firms with foreign capital have an even lower propensity to patent than domestic firms. This could be explained by the fact that the patenting activity is generally taken by headquarters in the country of origin. On the contrary, state-owned firms are more innovative than privately-owned firms. A possible explanation has to do with the separation between the ownership and the management system, which tends to be very high in public firms, with the managers being less reluctant to be involved in innovation activities. Another possible explanation has to do with spin-offs from universities and technological and scientific parks, which tend to be public in Spain and of a high technological opportunity nature. The composition of the board of directors, measured by the percentage of owners in management position tasks over the total of the number of employees in the firm, seems to have a negative and significant parameter. As can be deduced from this result, the incorporation of owners in the firm decision-process might reduce the number of high-risk projects due to the lower specialisation of the owners in the patenting system and in the technical tasks..
(13) 12 Ortega-Argiles. 28/9/09. 12:30. Página 243. Evidence on the role of ownership structure on firms’ innovative performance 243. Table 3.. Estimation Results. Baseline Model12 Poisson. Variables. Negative Binomial. I. II. III. IV. RD. 0.032*** (0.005). 0.031*** (0.005). 0.118*** (0.009). 0.113*** (0.009). SIZE. 0.605*** (0.040) –0.135*** (0.028). 0.666*** (0.041) –0.146*** (0.027). 0.225*** (0.040) –0.040 (0.042). 0.119*** (0.038) -0.029 (0.041). –0.002*** (0.001) –0.006*** (0.010) 0.010*** (0.003). ——. –0.002** (0.001) –0.004*** (0.001) –0.003 (0.003). ——. OWN. ——. ——. OWN*FOR. ——. OWN*PUB. —— 0.609*** (0.134) 0.535*** (0.057). –0.029*** (0.010) –0.281** (0.142) –0.811* (0.431) 0.500*** (0.133) 0.620*** (0.051). 0.097 (0.093) 0.159 (0.127). -0.030** (0.014) -0.060 (0.166) 0.042 (0.243) 0.094 (0.091) 0.210* (0.121). –3.153*** (0.020) 15.565*** (0.821). –3.485*** (0.196) 14.811*** (1.061). –3.532*** (0.185). -3.037*** (0.194). 472.66*** 8501 3417 –7018.18. 561.23*** 10114 3415 –8412.76. 434.70*** 8501 3417 –4315.71. 420.53*** 10114 3415 –4913.32. 25000***. 30000***. 311.75***. 543.57***. AGE. SHARE SHARE*FOR SHARE*PUB. HIGH MARKET. Intercept α Wald test: Chi2(K-1) N. Obs N. Indivs Log Likel: LR test ·=0; chi2(1):. —— ——. —— ——. —— ——. The public company’s effect is ambiguous. However, the negative effect of having foreign ownership could be explained by the fact that there is some evidence that branch plants tend to have relatively little R&D activity, and that this is often as12. The dependent variable is PAT, the number of patents and/or utility models awarded by the firm. In brackets the standard deviation is present. Moreover, *** indicates significance at the 1% level, ** 5% level and * 10% level. Estimations are made by maximum likelihood methods..
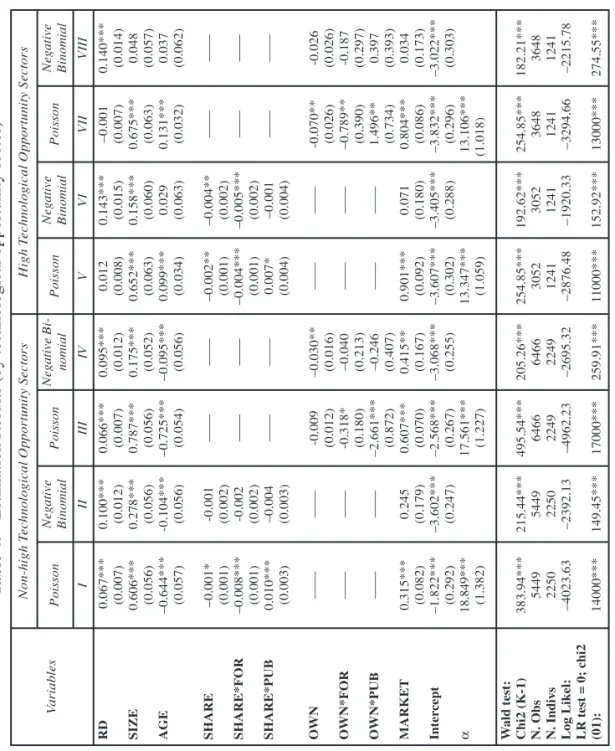
(14) 12 Ortega-Argiles. 244. 28/9/09. 12:30. Página 244. Ortega-Argilés, R. and Moreno, R.. sociated with the more routine development work rather than basic research (Howels, 1984). Indeed at the macro level the theories of “endogenous” growth have stressed the importance of foreign direct investment as a vehicle for the import of superior technologies, techniques and business methods (Romer, 1990). In the last columns of Table 3 the NegBin model estimations are shown; this model generalizes the Poisson by allowing for an additional source of variance above that due to pure sampling error. Therefore, we have observed some differences in the sign and significance of the variables explaining the outcome of the innovation process on the type of model under estimation, either a Poisson or a NegBin. Econometrically, since our data show a clear overdispersion of zeros in the case of patents (the coefficient of overdispersion of the NegBin model is statistically significant), the second estimation model is pointed out as the most accurate, and therefore their results are the ones we prefer. The basic result of the NegBin models is that the patenting activity is explained by the effect of the R&D effort and the size like other papers explained. But the most interesting fact is that there are some variables that remain significant in the patentability activity of Spanish manufacturing firms. All in all, we obtain that the knowledge accumulation through R&D investments is the most important effect for the patenting activity in Spanish manufactures (with a higher elasticity than in the Poisson model), as well as the size of the firms, since the bigger the firm the more it patents. Additionally, once the overdispersion of the data is taken into account, the firms’ ownership still matters with diffusely-held firms patenting more than closely-held firms. This negative effect of ownership concentration is even increased in the case of foreign owned firms, which patent even less. Concerning the introduction of owners in the board of directors the same negative effect that the one obtained with the Poisson estimation is obtained, although now this effect is independent of the ownership structure. Following the idea pointed by Yafeh and Yosha (2003) that the volatility of results in the papers that studied the relationship between corporate governance and innovative strategy may rely first on sectoral and technological differences among other aspects like the regional differences (Lee and O’Neil, 2003; Lee, 2005), we have run the same regressions distinguishing between low-medium and high technological opportunity sectors (Table 4). The main interesting finding in relation to corporate governance is that the variables proxying this issue are more significant in the high technological opportunity sectors, with the signs maintained as for the whole sample. Concerning the ownership variables, the concentration of the ownership and the inclusion of owners or relatives in management decision tasks seem to have the same negative effect in all the regressions. Only the composition of the board of directors seems not have the same important effect in the non-high tech firms as in the firms that belong to high-tech sectors, and the major cause is the lack of the knowledge in these types of activities as far as the owners and relatives concerns. An additional interesting finding is the contrary sign of the age variable in the two analysed sub-samples. This result underlines the existence of the necessity of a cumulative learning in the technological innovative activities like the evolutionary economics pointed (Nelson and Winter, 1982; Dosi, 1988; among others)..
(15) Wald test: Chi2 (K-1) N. Obs N. Indivs Log Likel: LR test = 0; chi2 (01):. α. 149.45***. 0.245 (0.179) –3.602*** (0.247). 14000***. 0.315*** (0.082) –1.822*** (0.292) 18.849*** (1.382). MARKET. ——. 215.44*** 5449 2250 –2392.13. ——. OWN*PUB. ——. ——. -0.001 (0.002) -0.002 (0.002) –0.004 (0.003). 383.94*** 5449 2250 –4023.63. ——. OWN*FOR. Intercept. ——. OWN. SHARE*PUB. SHARE*FOR. –0.001* (0.001) –0.008*** (0.001) 0.010*** (0.003). 17000***. 495.54*** 6466 2249 –4962.23. -0.009 (0.012) -0.318* (0.180) –2.661*** (0.872) 0.607*** (0.070) –2.568*** (0.267) 17.561*** (1.227). ——. ——. ——. 0.066*** (0.007) 0.787*** (0.056) –0.725*** (0.054). III. Poisson. 259.91***. 205.26*** 6466 2249 –2695.32. –0.030** (0.016) –0.040 (0.213) –0.246 (0.407) 0.415** (0.167) –3.068*** (0.255). ——. ——. ——. 0.095*** (0.012) 0.175*** (0.052) –0.095*** (0.056). IV. Negative Binomial. 11000***. 254.85*** 3052 1241 –2876.48. 0.901*** (0.092) –3.607*** (0.302) 13.347*** (1.059). ——. ——. ——. –0.002** (0.001) –0.004*** (0.001) 0.007* (0.004). 0.012 (0.008) 0.652*** (0.063) 0.099*** (0.034). V. Poisson. 152.92***. 192.62*** 3052 1241 –1920.33. 0.071 (0.180) –3.405*** (0.288). ——. ——. ——. –0.004** (0.002) –0.005*** (0.002) –0.001 (0.004). 0.143*** (0.015) 0.158*** (0.060) 0.029 (0.063). VI. Negative Binomial. 13000***. 254.85*** 3648 1241 –3294.66. -0.070** (0.026) –0.789** (0.390) 1.496** (0.734) 0.804*** (0.086) –3.832*** (0.296) 13.106*** (1.018). ——. ——. ——. –0.001 (0.007) 0.675*** (0.063) 0.131*** (0.032). VII. Poisson. 274.55***. 182.21*** 3648 1241 –2215.78. -0.026 (0.026) -0.187 (0.297) 0.397 (0.393) 0.034 (0.173) –3.022*** (0.303). ——. ——. ——. 0.140*** (0.014) 0.048 (0.057) 0.037 (0.062). VIII. Negative Binomial. 12:30. SHARE. II 0.100*** (0.012) 0.278*** (0.056) -0.104*** (0.056). I 0.067*** (0.007) 0.606*** (0.056) –0.644*** (0.057). Negative Binomial. Poisson. 28/9/09. AGE. SIZE. RD. Variables. High Technological Opportunity Sectors. Estimation Results (by technological opportunity sector)5, 12. Non-high Technological Opportunity Sectors. Table 4.. 12 Ortega-Argiles Página 245. Evidence on the role of ownership structure on firms’ innovative performance 245.
(16) 12 Ortega-Argiles. 246. 28/9/09. 12:30. Página 246. Ortega-Argilés, R. and Moreno, R.. 4.1. The regional dimension Finally, taking into account the importance of the environment where the firm is operating we have introduced the regional component in some specifications of the model (Table 5). The results show that firm’s location is important for explaining the patent activity of Spanish manufacturing firms. The effect of the spatial distribution of technological opportunities in Spain has been analysed by González and Jaumandreu (1998) with similar conclusions being drawn. It seems that there is a positive effect on being located in an environment with highly innovative activity (Table 5, column I, II and III). In other words, the fact of being located where there is a high innovative activity implies the existence of knowledge spillovers across individuals of different firms which would result in a higher patenting activity as other authors found (Audretsch and Feldman, 1999 and 2005; Greunz, 2004 and van der Panne, 2004). The results show that the knowledge externalities arising from R&D activities feedback and looping relations among the individuals involved influence the regional innovation creation. On the other hand, the presence of agglomeration economies coming from a dense labour market with a subsequent higher endowment of human capital (column IV) would also imply higher levels of innovation outputs. Thus our results are consistent with the literature that rely on knowledge-based theories of endogenous growth, assuming that the density of economic activity facilitates face-to-face contacts and thus knowledge and ideas flows either within (MAR externalities) or between (Jacobs externalities) industries. After controlling for overdispersion, knowledge spillovers and agglomeration economies seem to remain determinant in the patent activity of Spanish manufacturing firms. On one hand, having a geographical extent of the main market higher than the national one appears to favour accounting for patents. On the other, being located in a region with a highly innovative environment seems to encourage firm to patent.. 5. Conclusions The separation of ownership and management is one of the main reasons that cause agency problems in the investment decisions of the firm because of the informational asymmetries between managers and owners. In this study we have analysed the effect of some internal variables related with the firm ownership on its patenting activity. On one hand, we have considered those based on the concentration of the ownership, the inclusion of owners in the board of directors and the effect of the nature of the ownership (foreign and public). Taking into account the high difference between the sectoral aspects we have developed the analysis for two different groups of sectors according to their technological opportunity. The findings fit with the theoretical approach that the control of the decision of the management team by means of concentration of the ownership and introduction of owners in management positions tasks reduced the amount of innovations pursued by the firm probably due to the reduction of the specialization of the decision tasks and the adverse-risky innovative strategy..
(17) 2952 1443 -4517.91 11000***. 891.52***. 0.117** (0.050) -0.388*** (0.074) -0.002*** (0.001) -0.007*** (0.001) 0.006 (0.004) 0.473*** (0.072) ---0.613*** (0.207) ------YES YES -3.078*** (0.554). 1798 1029 -2246.51 6484.95***. 322.25***. 0.995*** (0.081) -0.841*** (0.135) -0.002* (0.000) -0.012*** (0.001) 0.004 (0.012) 0.564*** (0.111) ------2.167** (1.052) ---YES NO -2.230* (0.732). ----. 2330 1349 -3611.13 11000***. 384.92***. 0.287*** (0.053) -0.611*** (0.074) 0.002* (0.001) -0.007*** (0.001) 0.0078* (0.004) 0.937*** (0.082) ---------0.005*** (0.002) YES NO -3.078*** (0.554). ----. 0.258*** (0.031) ----. IV. 2949 1441 -2825.95 190.45***. 118.08***. 0.171*** (0.056) -0.086 (0.062) -0.001 (0.002) -0.007*** (0.002) -0.005 (0.004) 0.058 (0.147) 0.022*** (0.007) ---------YES NO -3.155*** (0.467). ----. 0.128*** (0.033) ----. V. 2952 1443 -2794.41 196.28***. 179.88***. -0.054 (0.063) -0.061 (0.066) -0.001 (0.002) -0.007*** (0.002) -0.007 (0.004) -0.030 (0.149) ---0.353*** (0.133) ------YES YES -3.296*** (0.487). ----. 0.304*** (0.045) ----. VI. 1798 1029 -1618.95 47.83***. 79.95***. 0.168** (0.078) 0.062 (0.101) -0.001 (0.003) -0.006*** (0.002) -0.009 (0.006) -0.185 (0.227) -------0.058 (0.717) ---YES NO -3.543*** (0.594). ----. 0.140*** (0.043) ----. VII. Negative Binomial. The dependent variable is PAT. *** Significant at the 1%, ** 5% and * 10% level. Standard errors in brackets.. 2949 1441 -4780.76 12000***. N. Obs N. Indivs Log Likel: LR test. 13. 483.68***. Wald test:Chi2(K-1). SECTOR YEAR Intercept. PATREG. RDREG. INNOVREG. MARKET EMPLREG. SHARE*PUB. SHARE SHARE*FOR. 0.509*** (0.049) -0.937*** (0.069) -0.006 (0.001) -0.008*** (0.001) 0.009** (0.004) 0.432*** (0.067) 0.060*** (0.012) ---------YES NO -0.967* (0.570). ----. III 0.066*** (0.023) ----. Poisson 0.443*** (0.027) ----. II. 2330 1349 -2414.28 150.51***. 122.64***. 0.041 (0.068) -0.018*** (0.067) -0.001 (0.002) -0.008*** (0.002) -0.007 (0.005) 0.316** (0.166) ---------0.005** (0.002) YES NO -2.956*** (0.520). ----. 0.246*** (0.047) ----. VIII. 1252 737 -1635.44 4058.06***. 295.56***. 1.102*** (0.091) -0.855*** (0.155) -0.001 (0.001) -0.011*** (0.001) -0.001 (0.010) 0.875*** (0.118) 0.669** (0.297) ---------YES YES -3.805*** (0.761). 0.141*** (0.024) ----. ----. 6188 2424 -3984.60 16000***. 489.63***. 0.514*** (0.068) 0.516*** (0.114) -0.283 (0.178) -0.002** (0.001) -0.006*** (0.002) -0.002 (0.012) 1.730*** (0.118) 0.607* (0.297) ---------YES YES -6.855*** (1.120). ----. ----. Robustness Checks. 12:30. AGE. SIZE. ----. 0.115*** (0.018) ----. I. Estimation Results. The regional context13. 28/9/09. RDMEAN. RD-2. RD. Variables. Table 5.. 12 Ortega-Argiles Página 247. Evidence on the role of ownership structure on firms’ innovative performance 247.
(18) 12 Ortega-Argiles. 248. 28/9/09. 12:30. Página 248. Ortega-Argilés, R. and Moreno, R.. The first ownership characteristics considered in the study is the effect of the concentration of capital in a small number of owners. This mechanism has a range of associated disadvantages, related to the increased risk borne by the owners (due to the reduction in their number to obtain greater control levels), less liquidity in markets and fewer opportunities for negotiation of the company’s values. As can be seen in our study, the concentration of the ownership does not favour the amount of output in innovation. With regards to the composition of the board of directors, measured by the share of owners in management and administration tasks with respect of the total amount of employees, we observe that the effect is negative in the majority of the analyzed regressions. The owners or relatives could move the company away from the benefits of specialisation if the firm belongs to high-tech sectors because of the lack of expertise. Specialisation is often necessary, in order to have directors with the ability to administer complex organisational structures, diversify risk among shareholders and obtain large volumes of funds to acquire specific assets. Decreasing the divergences of interests because of an increase in the number of owners in management positions will make agency costs lower, but risky projects will not be adopted due to the failure to take advantage of specialisation or because there is a high degree of concentration of risk in the hands of a few owners. As shown in our results, an increase in the participation of owners in management positions has a negative impact on the total amount of patents and utility models awarded by the firm. Additionally, some other aspects regarding the environment where the firm is operating are also significant for explaining the patent activity in Spanish manufacturing firms. Operating in a global market has a positive influence, showing that the greater the market area, the more intense the competition will be. The presence of agglomeration economies as well as knowledge spillovers in the region where the firm is located appear to be an engine for encourage firm to do patents. Spatial concentration of individuals, capacities, information and knowledge within a limited geographic area provides an environment in which ideas flow quickly from person to person. Since dynamic externalities arise from communication between economic agents, their effects should be more important and observable via patents within an environment where communications are focused, which eases face-to-face contacts and thus the spillover of (tacit) knowledge and ideas. International competition or in a higher innovative environment are more diverse and intense than competition in smaller or lower innovative geographical areas, meaning that internal capabilities must be improved by adopting riskier patents in order to obtain a safe market share.. 6. References Acs, Z.J., Audretsch D.B. and Feldman, M.P. (1991): “Real effects of academic research: a comment”. Am Econ Rev, 82(1):363-367. Audretsch, D.B. and Feldman, M.P. (1999): “Innovation in cities: science-based diversity, specialization and localized competition”, European Economic Review, 43:409-29. Audretsch, D.B. and Feldman, M.P. (2005): “Knowledge Spillovers and the Geography of Innovation”, in V.Henderson and J.Thisse (eds.), Handbook of Urban and Regional Economics: Cities and Geography, North-Holland..
(19) 12 Ortega-Argiles. 28/9/09. 12:30. Página 249. Evidence on the role of ownership structure on firms’ innovative performance 249. Autant-Bernard, C. (2001): “Science and Knowledge Flows: evidence from the French case”, Research Policy, 30(7):1069-78. Beneito, P. (2003): “Choosing among alternative technological strategies: an empirical analysis of formal sources of innovation”, Research Policy, 32(4):693-713. Berle, A.A. and Means, G.C. (1932): The Modern Corporation and Private property. McMillan Publishing Co., New York. Bishop, P. and Wiseman, N. (1999): “External ownership and innovation in the United Kingdom”, Applied Economics, 31:443-450. Bottazzi, L. and Peri, G. (2003): “Innovation and spillovers in regions: Evidence from European patent data”, European Economic Review, 47:687-710. Blundell, R., Griffith, R. and van Reenen, J. (1999): “Market Share, Market Value and Innovation in a Panel of British Manufacturing Firms”, Review of Economic Studies, 66:529-554. Burkart, M., Gromb, D. and Panunzi, F. (1997): “Large shareholders, monitoring, and the value of the firm”, Quarterly Journal of Economics, 62:693-728. Busom, I. (1993): “Los proyectos de I+D de las empresas: un análisis empírico de algunas de sus características”, Revista Española de Economía (Monográfico: Investigación y Desarrollo), 39-65. Cameron, A. and Trivedi, P. (1990): “Regression-based tests for over-dispersion in the Poisson Model”, Journal of Econometrics, 46:347-364. Cameron, A. and Trivedi, P. (1998): Regression analysis of count data, Econometric Society Monographs (Cambridge University Press, Cambridge). Casson, M.C. (1991): The Entrepreneur: An Economic Theory. New York. Cohen, W. and Klepper, S. (1996): “A reprise of size an R&D”. Economic Journal, 106:925-951. Crepon, B. and Duguet, E. (1997): “Research and Development, Competition and Innovation. PseudoMaximum likelihood and simulated maximum likelihood methods applied to count data models with heterogeneity”, Journal of Econometrics, 79:355-378. Crépon, B., Duguet, E. and Mairesse, J. (1998): “Research, Innovation and Productivity: An Econometric Analysis at the firm level”, Economics of Innovation and New Technology, 7 (2):115-58. Crespi, F. (2004): Notes on the Determinants of Innovation: A Multi-Perspective Analysis, Fondazione Eni Enrico Mattei Note di Lavoro Series Index, num. 42.2004. Czarnitzki, D. and Kraft, K. (2003): Management Control and Innovative Activity. WP, ZEW, September. Demsetz, H. and Lehn, K. (1985): “The Structure of Corporate Ownership: Causes and Consequences”, Journal of Political Economy, 93:1155-1177. Dosi, G. (1988): “Sources, Procedures, and Microeconomic Effects on Innovation”, Journal of Economic Literature, 26:1120-71. Fagerberg, J., Mowery, D.C. and Nelson, R.R. (2005): The Oxford Handbook of Innovation, Chapter 5. Organizational Innovation by Alice Lam (Oxford University Press, New York) Fernández, E. (1996): Innovación, tecnología y alianzas estratégicas: factores clave de la competencia. Biblioteca Civitas Economía y Empresa. Galende, J. and De la Fuente, J. M. (2003): “Internal Factors Determining a Firm’s Innovative Behaviour”, Research Policy, 32:715-736. González, X. and Jaumandreu, J. (1998): Threshold effects in product R&D decisions: theoretical framework and empirical analysis, EUNIP 1998 International Conference Rethinking Industrial Policy in Europe, Barcelona. Gumbau, M. (1994): “Los determinantes de la innovación: el papel del tamaño de la empresa”. Investigación Comercial Española, 726:117-127. Greunz, L. (2004): “Industrial Structure and Innovation – Evidence from European Regions”, Journal of Evolutionary Economics, 14(5):563-92. Griffith, R., Harrison, R. and Van Reenen, J. (2006): “How special is the special relationship: Using the impact of US R&D Spillovers on British firms as a test of technology sourcing”, American Economic Review, 96:1859-1875. Griffith, R., Lee, S. and Van Reenen, J. (2007): Is distance dying at last? Falling home bias in fixed effects models of patent citations, CEPR Discussion Paper n.6435. Griliches, Z. (1979): “Issues in Assessing the Contribution of R&D to Productivity Growth”, Bell Journal of Economics, 10:92-116..
(20) 12 Ortega-Argiles. 250. 28/9/09. 12:30. Página 250. Ortega-Argilés, R. and Moreno, R.. Gugler, K. and Yurtoghu, B. (2003): “Average q, marginal q, and the relation between ownership and performance”, Economics Letters, 78:379-384. Gumbau, M. (1997): “Análisis microeconómico de los determinantes de la innovación: aplicación a las empresas industriales españolas”, Revista Española de Economía, 14 (1):41-66. Hall, B., Griliches, Z. and Hausman, J. (1986): “Patents and R and D: Is there a lag?”, International Economic Review, 27:265-283. Hill, C. and Snell, S. (1988): “External control, Corporate Strategy and Firm Performance in ResearchIntensive Industries”, Strategic Management Journal, 9:577-590. Himmelberg, C., Hubbard, R. and Palia, D. (1999): “Understanding the determinants of managerial ownership and the link between ownership and performance”, Journal of Financial Economics, 53:353-384. Hosono K., Tomaína, M. and Miyagawa, T. (2004): “Corporate Governance and research and development: evidence from Japan”, Economics of Innovation and New Technology, 13:141-164. Howells, J.R.L. (1984): “The location of research and development: some observations and evidence from Britain”, Regional Studies, 18:13-29. Jaffe, A., Trajtenberg, M. and Henderson, R. (1993): “Geographic localization of knowledge spillovers as evidenced by patent citations”, Quartely Journal of Economics, 108:577-598. Kraft, K. (1989): “Market Structure Firm Characteristics and Innovative Activity”, The Journal of Industrial Economics, 37, (March). Lafuente, A. and Lecha, G. (1988): “Determinantes sectoriales del nacimiento de empresas en la industria española”, Investigaciones Económicas (segunda época) XII(2):329-335. Lafuente, A., Salas, V. and Yagüe, M.J. (1985): “Formación de capital tecnológico en la industria española”, Revista Española de Economía 2:269-290. Lee, P. G. (2005): “A comparison of ownership structures and innovations of US and Japanese firms”, Managerial and Decision Economics, 26::39-50. Lee, P. G. and O’neil, H. M. (2003): “Ownership structures and R&D investments of U.S. and Japanese firms: agency and stewardship perspectives”, Academy of Management Journal, 46::212-225. Leech, D. and Leahy, J. (1991): “Ownership structure, control type classifications and the performance of large British companies”. The Economic Journal, 101:1418-1437. Licht, G. and Zoz, K. (1998): “Patents and R&D An Econometric Investigation Using Applications for German European and US Patents by German Companies”, Annales d’Économie et de Statistique, 4950:329-360. Love, J.H., Ashcroft, B. and Dunlop, S. (1996): “Corporate structure, ownership and the likelihood of innovation”. Appl Econ, 28:737-746. Mansfield, E. (1964): “Industrial research and development expenditures: determinants, prospects and relation of size of firm and inventive output”. J Polit Econ, 72:319-340. Mørck, R., Schleifer, A. and Visnhy, R.N. (1988): “Management ownership and market valuation”. Journal of Financial Economics, 20:293-315. Nelson, R.R. and Winter, S. G. (1982): An Evolutionary Theory of Economic Change, Cambridge, Mass. Romer, P.M. (1990): “Endogenous Technical Change”, Journal of Political Economy, 98, S71-S102. Scherer, F.M. (1965): “Firm Size, Market Structure, Opportunity and the Output of Patented Inventions”. The American Economic Review, 57:1097-1125. Scherer, F.M. and Ross, D.R. (1990): Industrial market structure and economic performance. Houghton Mifflin Co., 3rd edn. Schumpeter, J. (1942): Capitalism, socialism and democracy. Harper & Row, New York. Shleifer, A. and Wishny, R.W. (1997): “A survey of corporate governance”, Journal of Finance, 52:737783. Smith, C.W. and Watts, R. (1992): “The investment opportunity set and corporate financing, dividend and compensation policies”. Journal of Financial Economics, 32:263-292. van der Panne, G. (2004): “Agglomeration Externalities: Marshall versus Jacobs”, Journal of Evolutionary Economics, 14(5):593-604. Yafeh, Y. and Yosha, O. (2003): Large shareholders and banks: who monitors and how?, The Economic Journal, 113:128-146..
(21)
Figure


Documento similar
In the preparation of this report, the Venice Commission has relied on the comments of its rapporteurs; its recently adopted Report on Respect for Democracy, Human Rights and the Rule
the lack of support and guidance for professional and work development is the one issue on the working conditions of the staff where there is more room for improvement,
In the “big picture” perspective of the recent years that we have described in Brazil, Spain, Portugal and Puerto Rico there are some similarities and important differences,
This research focuses on increasing the available stock of knowledge with regards to assessing the resulting impact of collaboration between firms and knowledge
Nevertheless, the ratio of corporations using patents of introduction is higher than that obtained from the analysis of the entire patent system as a whole (around 8.5% from 1820
Given the much higher efficiencies for solar H 2 -generation from water achieved at tandem PEC/PV devices ( > 10% solar-to-H 2 energy efficiency under simulated sunlight) compared
Different proxies for growth options ratio to the firm’s total value (GOR) (either MBAR (the market to book assets ratio), Q (Tobin’s Q), or RDsales (the ratio of R&D expenses
The influence of puberty on vitamin D status in obese children and the possible relation between vitamin D deficiency and insulin
